LUNAR CARTOGRAPHY: PROGRESS IN THE 2000
SAND PROSPECTS FOR THE 2010
SR. L. Kirk*, B. A. Archinal, L. R. Gaddis, M. R. Rosiek
Astrogeology Science Center, U.S. Geological Survey, Flagstaff, Arizona 86001 USA (rkirk, barchinal, lgaddis, mrosiek)@usgs.gov
Commission IV, WG IV/7
KEY WORDS: Extra-terrestrial, extraterrestrial, planetary, international, databases, cartography, geodesy, mapping
ABSTRACT:
The first decade of the 21st century has seen a new golden age of lunar exploration, with more missions than in any decade since the 1960’s and many more nations participating than at any time in the past. We have previously summarized the history of lunar mapping and described the lunar missions planned for the 2000’s (Kirk et al. 2006; 2007; 2008). Here we report on the outcome of lunar missions of this decade, the data gathered, the cartographic work accomplished and what remains to be done, and what is known about mission plans for the coming decade.
Four missions of lunar orbital reconnaissance were launched and completed in the decade 2001–2010: SMART-1 (European Space Agency), SELENE/Kaguya (Japan), Chang’e-1 (China), and Chandrayaan-1 (India). In addition, the Lunar Reconnaissance Orbiter or LRO (USA) is in an extended mission, and Chang’e-2 (China) operated in lunar orbit in 2010-2011. All these spacecraft have incorporated cameras capable of providing basic data for lunar mapping, and all but SMART-1 carried laser altimeters. Chang’e-1, Chang’e-2, Kaguya, and Chandrayaan-1 carried pushbroom stereo cameras intended for stereo mapping at scales of 120, 10, 10, and 5 m/pixel respectively, and LRO is obtaining global stereo imaging at 100 m/pixel with its Wide Angle Camera (WAC) and hundreds of targeted stereo observations at 0.5 m/pixel with its Narrow Angle Camera (NAC). Chandrayaan-1 and LRO carried polarimetric synthetic aperture radars capable of 75 m/pixel and (LRO only) 7.5 m/pixel imaging even in shadowed areas, and most missions carried spectrometers and imaging spectrometers whose lower resolution data are urgently in need of coregistration with other datasets and correction for topographic and illumination effects. The volume of data obtained is staggering. As one example, the LRO laser altimeter, LOLA, has so far made more than 5.5 billion elevation measurements, and the LRO Camera (LROC) system has returned more than 1.3 million archived image products comprising over 220 Terabytes of image data.
The processing of controlled map products from these data is as yet relatively limited. A substantial portion of the LOLA altimetry data have been subjected to a global crossover analysis, and local crossover analyses of Chang’e-1 LAM altimetry have also been performed. LRO NAC stereo digital topographic models (DTMs) and orthomosaics of numerous sites of interest have been prepared based on control to LOLA data, and production of controlled mosaics and DTMs from Mini-RF radar images has begun. Many useful datasets (e.g., DTMs from LRO WAC images and Kaguya Terrain Camera images) are currently uncontrolled.
Making controlled, orthorectified map products is obviously a high priority for lunar cartography, and scientific use of the vast multinational set of lunar data now available will be most productive if all observations can be integrated into a single reference frame. To achieve this goal, the key steps required are (a) joint registration and reconciliation of the laser altimeter data from multiple missions, in order to provide the best current reference frame for other products; (b) registration of image datasets (including spectral images and radar, as well as monoscopic and stereo optical images) to one another and the topographic surface from altimetry by bundle adjustment; (c) derivation of higher density topographic models than the altimetry provides, based on the stereo images registered to the altimetric data; and (d) orthorectification and mosaicking of the various datasets based on the dense and consistent topographic model resulting from the previous steps. In the final step, the dense and consistent topographic data will be especially useful for correcting spectrophotometric observations to facilitate mapping of geologic and mineralogic features. We emphasize that, as desirable as short term progress may seem, making mosaics before controlling observations, and controlling observations before a single coordinate reference frame is agreed upon by all participants, are counterproductive and will result in a collection of map products that do not align with one another and thus will not be fully usable for correlative scientific studies. Only a few lunar orbital missions performing remote sensing are projected for the decade 2011-2020. These include the possible further extension of the LRO mission; NASA’s GRAIL mission, which is making precise measurements of the lunar gravity field that will likely improve the cartographic accuracy of data from other missions, and the Chandrayaan-2/Luna Resurs mission planned by India and Russia, which includes an orbital remote sensing component. A larger number of surface missions are being discussed for the current decade, including the lander/rover component of Chandrayaan-2/Luna Resurs, Chang’e-3 (China), SELENE-2 (Japan), and privately funded missions inspired by the Google Lunar X-Prize. The US Lunar Precursor Robotic Program was discontinued in 2010, leaving NASA with no immediate plans for robotic or human exploration of the lunar surface, though the MoonRise sample return mission might be reproposed in the future. If the cadence of missions cannot be continued, the desired sequel to the decade of lunar mapping missions 2001-2010 should be a decade of detailed and increasingly multinational analysis of lunar data from 2011 onward.
* Corresponding author.
1. INTRODUCTION
The first decade of the 21st century has seen a new golden age of lunar exploration, with more missions to the Moon launched than in any decade since the 1960’s and many more nations participating than at any time in the past. In a series of previous papers (Kirk et al. 2006; 2007; 2008), we summarized the history of lunar mapping from the beginning of the space age, described the new missions planned for the 2000’s, and reported on early results from some of those missions. Here we report on the outcome of lunar missions of this decade, the data gathered, the cartographic work accomplished and most importantly what remains to be done, and conclude with a brief review of what is known about mission plans for the coming decade.
2. EXPLORATION AND MAPPING IN THE 2000S
2.1 Missions
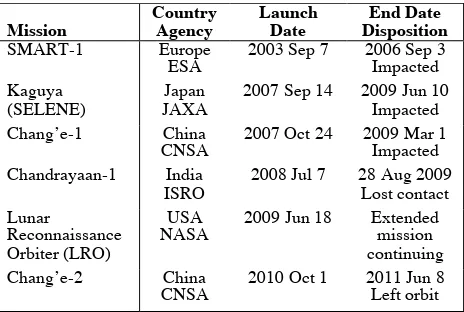
A total of six orbital missions carrying instruments for mapping the Moon were launched in the decade 2001–2010. These missions are listed in Table 1. In the table, the term “impacted” indicates that the spacecraft was deliberately placed on an orbit that intersected the lunar surface. Omitted from the table are several other probes that impacted on the Moon but did not perform orbital remote sensing: LCROSS, which was launched with LRO and impacted the Moon near its south pole, the Moon Impact Probe (MIP) deployed by Chandrayaan-1, and the Okina International Archives of the Photogrammetry, Remote Sensing and Spatial Information Sciences, Volume XXXIX-B4, 2012
(V*) subsatellite of Kaguya, which was deorbited at the end of its mission.
Mission
Country Agency
Launch Date
End Date Disposition
SMART-1 Europe ESA
2003 Sep 7 2006 Sep 3 Impacted Kaguya
(SELENE)
Japan JAXA
2007 Sep 14 2009 Jun 10 Impacted Chang’e-1 China
CNSA
2007 Oct 24 2009 Mar 1 Impacted Chandrayaan-1 India
ISRO
2008 Jul 7 28 Aug 2009 Lost contact Lunar
Reconnaissance Orbiter (LRO)
USA NASA
2009 Jun 18 Extended mission continuing Chang’e-2 China
CNSA
2010 Oct 1 2011 Jun 8 Left orbit
Table 1. Lunar Orbital Missions of the 2000s.
The first five missions in Table 1 were described in our earlier papers, and the reader is directed to Kirk et al. (2008) for a more extensive table containing a brief description of the most important instruments for mapping on each spacecraft. The Chang’e-2 spacecraft was a duplicate of Chang’e-1 and carried a similar suite of instruments, but the laser altimeter and CCD camera were both improved. Whereas the Chang’e-1 CCD obtained 120 m/pixel images from 200 km orbit altitude, the new camera was able to obtain global 10 m/pixel coverage from a 100 km orbit (Clark 2010). After lowering of the periselene to 15 km, regional coverage of Sinus Iridium at 1.5 m/pixel was obtained to support selecting a landing site for the Chang’e-3 rover mission planned for 2013. After completion of its orbital mission in 2011, Chang’e-2 left lunar orbit and flew to the L2 Lagrange point of the Earth-Moon system (Xinhua, 2011). All of these missions are considered successful. Perhaps the greatest challenges affected Chandrayaan-1, which experienced difficulties with thermal control in the lunar orbital environment. High temperatures onboard the spacecraft may have contributed to the progressive degradation of the attitude control system and the eventual loss of contact in 2009 after less than half of the two-year planned mission (e.g., Boardman et al. 2011). Nevertheless, more than 95% of mission objectives were judged to have been achieved (The Hindu, 2011).
2.2 Cartographic Datasets and Uncontrolled Products
All of the missions listed in Table 1 carried cameras capable of providing key data for lunar mapping, and all but SMART-1 carried laser altimeters. The nominal resolutions of these cameras ranged over more than two orders of magnitude, from 0.5-1.5 m/pixel for LRO’s Narrow Angle Camera (LROC NAC) and the best Change’e-2 images to 100-120 m/pixel for the LRO Wide Angle Camera (WAC) and Chang’e-1 CCD. Many of the cameras were designed to collect stereo imagery by using the multi-line pushbroom principle. Others were designed to obtain multispectral images. Two of the missions (Chandrayaan-1 and LRO) carried polarimetric synthetic aperture radars (SAR) capable of imaging the interior of shadowed regions near the poles at ground sample distances from 7.5 to 75 m/pixel. Collectively, the missions also carried a wide variety of imaging and profiling spectrometers and other remote sensing instruments such as thermal and ultraviolet imagers. These instruments are secondary in a cartographic sense; although their data are scientifically very valuable, their resolutions are generally lower, and as a result, their products are usually tied to the primary control networks defined by altimeter and camera data as opposed to contributing to the definition of these networks.
2.2.1 SMART-1: The Advanced Moon micro-Imager Experiment (AMIE) camera was a pushframe design, with multiple color filters directly bonded to a 1024 x 1024 pixel CCD detector (Pinet et al. 2005). More than 32,000 images were obtained, with resolution generally increasing toward the south pole (Grieger et al. 2008). Mosaics have been made (e.g., Despan et al. 2008) but only a limited number have been released. The raw and calibrated image data are available in NASA Planetary Data System (PDS) format through the ESA Planetary Science Archive at http://www.rssd.esa.int/index.php ?project=PSA&page=smart1.
2.2.2 Kaguya: The LALT (Laser ALTimeter; Araki et al. 2009) recorded more than 20 million shots, of which 10 million had high quality orbital data and were used for topographic modeling (Araki, 2012). The Lunar Imager/Spectrometer System (LISM; Haruyama et al. 2008) included the Terrain Camera (TC), a 10 m/pixel pushbroom camera with fore- and aft-looking detector lines and the Multiband Imager (MI), a 20 m/pixel framing camera with 5 visible and 4 near infrared bands, as well as the Spectral Profiler (SP), a 296-band point instrument. Nearly complete global image coverage was obtained with both morning and evening illumination. An uncontrolled 10 m/post global DTM has been produced by stereoanalysis of the TC images (Haruyama et al. 2012). The SELENE Data Archive at http://l2db.selene.darts.isas.jaxa.jp/ index.html.en contains ~6 GB of LALT, 13 TB of TC, and 1.6 TB of MI data in PDS format. These products include high level derived products (topographic and image maps), but unfortunately do not include the geometrically raw TC images.
2.2.3 Chang’e: The Laser Altimeter (LAM; Li et al. 2010b) on Chang’e-1 recorded more than 9 million shots, of which ~3.2 million were useful for topographic mapping (Huang et al. 2010). These data were used to make both gridded DTMs (or “DEMs”; Cai et al. 2009; Li et al. 2010b) and 360 degree/order spherical harmonic models (Huang et al. 2010; Su et al. 2011). Nearly complete image coverage was obtained with the CCD camera, a 120 m/pixel 3-line pushbroom scanner. The data were used to assemble a global image mosaic (Li et al. 2010a). This mosaic could be described as semicontrolled, in that the positions of some images were adjusted to bring them into ≤2 pixel agreement with neighboring orbit strips. The CCD images have also been used to produce controlled (to LAM) DTMs with 500 m grid spacing (Liu et al. 2009). In addition, infrared spectral images were obtained at 200 m/pixel by the IIM (Interferometer Spectrometer) instrument. Approximately 7.5 TB of Chang’e-1 data are publically available in PDS format at http://159.226.88.59:7779/CE1OutWeb/, with an English lang-uage version of the website planned (Zuo et al. 2011). The archive includes both raw and derived products, but unfortu-nately trajectory data for the mission are not being released (K. Di, pers. comm. 2011). Chang’e-2 data totalling another 3.9 TB will be added to the archive when their proprietary period expires. This delivery is likely to include the recently released 7 m/pixel global CCD-2 image mosaic (Xinhua 2012a; http://159.226.88.30:8080/CE2release/cesMain.jsp)
2.2.4 Chandrayaan-1: The Lunar Laser Ranging Instrument (LLRI) and Terrain Mapping Camera (TMC), a 5 m/pixel three-line stereo pushbroom scanner, were the primary cartographic instruments on Chandrayaan-1 (Goswami and Annadurai 2009). The payload also included the Hyperspectral Imager (HySI) and Smart Infrared Spectrometer (SIR-2). The premature termination of the mission, and the attitude control difficulties prior to that, undoubtedly reduced their coverage from what was planned. Production of DTMs and orthoimages from the TMC images is nevertheless proceeding (Krishna et al. 2009; Radhadevi et al. 2011; Krishna et al. 2012). A public archive of PDS-formatted mission data is planned (Krishna et al. 2010), but the website http://www.issdc. gov.in/ is not yet populated with data as of April 2012.
More information is available about the US-provided Mini-RF Forerunner radar, also known as Mini-SAR, and the Moon Mineralogy Mapper (M3
) infrared imaging spectrometer. Mini-RF (Spudis et al. 2010) collected 75 m/pixel S-band (12.6 cm International Archives of the Photogrammetry, Remote Sensing and Spatial Information Sciences, Volume XXXIX-B4, 2012
wavelength) polarimetric images of both lunar poles down to 80° latitude, plus a handful of image strips closer to the equator. The Level 1 (unprojected, range-azimuth geometry) images total 32 GB. Map-projected products include 18 GB of individual images (Level 2) and 1 GB of mosaics (Level 3). These products are uncontrolled and unrectified (i.e., projected onto a sphere, so parallax distortions are uncorrected), and contain less than the full set of polarization information. The M3 obtained nearly complete global coverage at 140 m/pixel with 85 spectral bands and targeted coverage at 70 m/pixel with 260 bands (Boardman et al. 2011). The full dataset includes 0.75 TB of Level 0 (raw) data, 2.12 TB of Level 1B (calibrated radiance) data and 1.78 TB of Level 2 (reflectance) data. The Level 1B and 2 data are selenoreferenced (i.e., latitude-longitude coordinates of each pixel are provided) based on control to LRO altimetry but are unprojected. These Mini-RF and M3
products can be obtained from the NASA PDS at http://pds-geosciences.wustl.edu/ missions/chandrayaan1/.
2.2.5 LRO: The primary cartographic instruments are the Lunar Orbiter Laser Altimeter (LOLA), LROC, and Mini-RF (Chin et al. 2007). Secondary instruments providing important compositional data at lower resolution include the Diviner Lunar Radiometer Experiment (DLRE) and Lyman Alpha Mapping Project (LAMP). LOLA, Mini-RF, and DLRE data are publically available through the PDS Geosciences Node (http://pds-geosciences.wustl.edu/missions/lro/), whereas LROC and LAMP data are hosted by the PDS Imaging Node (http://pds-imaging.jpl.nasa.gov/volumes/lro.html).
The 5-spot design and 10 Hz pulse rate of LOLA (Smith et al. 2009) allow it to gather significantly more data than previous altimeters. At the time of writing, LOLA has made 2.2 billion laser shots (G. Neumann, written comm. 2012) and collected 5.5 billion valid range measurements (http://imbrium.mit.edu/ BROWSE/LOLA_RDR/. Archived data include raw (EDR) and processed (RDR) tables of point-by-point measurements, raster DTMs (GDR) at grid spacings ranging from 4 to 512 pixels/degree (i.e., 7.5 km to 60 m/pixel), and spherical harmonic coefficients (SHDR).
LROC (Robinson et al. 2010) consists of wide (WAC) and narrow-angle (NAC) cameras. WAC uses a pushframe design with 90° total crosstrack field of view and color coverage in 5 visible and 2 ultraviolet bands over 60° field of view. The nominal ground sample distance is 100 m/pixel in the infrared and ~400 m in the UV. NAC consists of a pair of identical pushbroom cameras with wide spectral sensitivity, 0.5 m/pixel nominal ground sample distance, and 5 km total swath width. The wide swath of WAC allows for useful stereo sidelap with neighboring orbit coverage, while NAC stereopairs are obtained by rolling the spacecraft to image the same target on different orbits. To date, the LROC team has delivered 222.9 TB of data to the PDS, consisting of 74.3 TB of raw (EDR) and 148.6 TB of calibrated (CDR) products (http://www.lroc.asu.edu/news/ index.php?/archives/541-LROC-9th-PDS-Release.html). This dataset includes 667,572 EDRs and 667,572 CDRs of which about 2/3 are NAC images. The WAC images provide global monochrome, color, and stereo coverage. NAC images cover only a few percent of the Moon, but include complete coverage of both poles and about 1200 stereopairs (M. Robinson, written comm. 2012). High level products (RDRs) on the LROC team site (http://wms.lroc.asu.edu/lroc/rdr_product_select) include an uncontrolled 100 m/pixel WAC global mosaic and DTM (Scholten et al. 2011), regional color WAC mosaics, uncontrolled polar and local NAC mosaics, and NAC DTMs. Mini-RF on LRO (Nozette et al. 2010; Raney et al. 2011) is substantially more capable than the Chandrayaan-1 Forerunner, adding a second wavelength (X band, 4.2 cm), a 7.5 m/pixel zoom mode, and capabilities for interferometry and bistatic observations. Between the beginning of operations in 2009 July and the failure of the transmitter in 2010 December, the instrument obtained near-complete S-band zoom coverage of both poles to about 70°, with both eastward and westward look and illumination directions, as well as ~70% coverage from 80°–90° N in X-baseline mode. About 60% of the mid to low
latitudes were also imaged, mainly in S-zoom mode. The PDS archive includes raw (PDR) data, Level 1 calibrated but unprojected (CDR) images, and Level 2 map-projected (CDR-MAP) single images but no mosaics to date. The volume of Level 1 CDR products is 9.9 TB. The other products contain equivalent information but are larger because of redundancy and non-data pixels. The dataset is roughly 3 orders of magni-tude larger than was anticipated when Mini-RF was added to the LRO payload as a technology demonstration in 2005.
2.3 Controlled Cartographic Products
The archives described in the previous section include numerous cartographic products, as well as geometrically raw (unprojected) observations, but the majority of these cartographic datasets are uncontrolled or at best semicontrolled. The number of controlled mosaics, DTMs, and other map products is much smaller. Foremost among the controlled products is the LOLA altimetric dataset, for which orbit trajectories and ground point coordinates have been adjusted to maximize the consistency of elevations where altimetric profiles cross (Mazarico et al. 2011) or where dense gridded data products already exist, such as at the poles (Mazarico et al. 2012). Given the dense sampling of LOLA, and the ability of its 5-spot pattern to measure local slopes as well as elevations, this dataset provides the best current reference for other mapping data. The Chang’e-1 LAM data are also being corrected by crossover analysis (Hu et al. 2011), though so far on a local rather than global basis. Most encouragingly, studies exploring the potential of mutual adjustment of the altimetry from different missions (Iz et al. 2011; Shum et al. 2012) have recently been initiated.
Imaging data are generally controlled using the altimetric products as a reference. Examples of controlled image products include the adjusted selenoreferencing of M3
data based on LOLA (Boardman et al. 2011) and the production of polar (Lee et al. 2012) and region-of-interest (Rosiek et al. 2012) controlled mosaics of LROC NAC images. The polar mosaics are thought to be – in numbers of pixels – the largest controlled extraterrestial map products ever made, covering the lunar polar caps from 85.5° to the pole at 1 m/pixel. Much of the latter work has been sponsored by the NASA Lunar Mapping and Modeling Project (LMMP; Noble et al. 2009; data accessible through the LMMP Portal http://lmmp.nasa.gov/). A variety of controlled DTMs and derived products such as orthoimages have also been made. These include DTMs from Chandrayaan-1 TMC images (Radhadevi et al. 2011), Chang’e-1 CCD images (Liu et al. 2009), and LROC NAC images (see Beyer et al. 2011 for an overview of the multiple groups producing such DTMs under both LROC team and LMMP sponsorship, and Rosiek et al. 2012 and Burns et al. 2012 for more recent summaries). Radargrammetric analysis of LRO and Chandrayaan-1 Mini-RF images has yielded controlled DTMs (Kirk et al. 2011) and production of controlled polar mosaics is currently under way (Kirk et al. 2012).
3. UNIFYING THE CURRENT DATA
To obtain maximum value for science and exploration, the lunar remote sensing data discussed here must be co-registered in a common coordinate reference frame. Only such an effort will ensure the proper calibration, registration, and error analysis of the data, which in turn will permit the full comparative and synergistic use of the datasets. The summary in this section describes the steps needed to ensure the development and unification of these high-value lunar data products.
Topographic, imaging, and spectral data from all lunar missions need to be brought together into a common frame via geodetic control solutions (e.g., photogrammetric, radargrammetric, and altimetric crossover adjustments). This rigorous process will allow for the merging and registration necessary to generate the most accurate, highest resolution global DTM. Such a model can then be used to support photometric calibration and ortho-rectification of the datasets. Once the images are brought into a International Archives of the Photogrammetry, Remote Sensing and Spatial Information Sciences, Volume XXXIX-B4, 2012
common frame and a common DTM is in use, the datasets can be converted into information, primarily in the form of useful cartographic products. Such products are essential for addressing lunar science and exploration goals at the highest possible level of accuracy. As a result of the merging process, the accuracy level of such products will be known and documented, which will be critical for the comparison of the products and for their use in future decision making.
In order to meet the increasing needs of the science and exploration communities, datasets must be comparable at the pixel level with accuracy on the order of tenths of a pixel required for color and spectral data. Such accuracy is only possible with geodetically controlled products that are orthorectified onto DTMs with resolutions approaching those of the output image products.
Detailed arguments have been put forth that more extensive cartographic efforts are needed to exploit past missions fully and to prepare properly for future missions (Archinal et al. 2007; Kirk et al. 2008). The NASA Advisory Council has recognized the importance of such processing, recommending that all lunar datasets be geodetically controlled (NAC, 2007). The IAU Working Group on Cartographic Coordinates and Rotational Elements has also recently recognized the value of controlled products (Archinal et al. 2011, recommendation 1) and the need to generate them from new mission datasets. As noted in Section 2, controlled cartographic products from recent missions are greatly outnumbered by uncontrolled products. The number of controlled products is growing and efforts to combine data from multiple missions have begun (e.g., Iz et al. 2011; Shum et al. 2012) but given the volume and complexity of the data it is clear that a massive effort will be required to control even the most critical of these new large lunar datasets. Given the funding constraints on recent major international missions to the Moon and the need to register datasets from multiple missions, an international co-operative project would greatly facilitate accomplishment of the work described here. If necessary, significant progress could be made even without requiring the release of raw data from all missions. Joint efforts at mapping would be a good first step that would greatly encourage and facilitate broader international cooperation in the exploration of the Moon.
In the following subsections we describe the need for controlling the data, for generating a merged global DTM, and for establishing a common reference frame. Basic high resolution datasets are listed that need to be connected initially and principles of processing are described to outline in what order and how datasets could be registered to each other and a common frame. Some of the many and difficult challenges in accomplishing such work are briefly considered.
3.1 The Need for Geodetic Control
The only way to connect/register/compare data with quantified precision and accuracy is to geodetically (usually photo-grammetrically) process the data into controlled products. Otherwise the uncertainties in the comparison of datasets undermine their synergistic value. Users always want the best precision and accuracy possible and require that they be quantified. Such knowledge is critical for mineralogic, geologic, and other scientific investigations and exploration purposes such as site selection, landing, and landed operations. Con-trolling any single dataset provides many benefits including: (a) the best method of removal of mosaic seams for qualitative work; (b) proper orthometric projection of data (i.e., registration of images to topography in order to make or match existing mosaics and maps); (c) registration of multispectral data, which is essential to do at subpixel precision to avoid fringing artifacts; and (d) proper photometric correction of data. The value of such control increases exponentially when multiple datasets are considered, so it is essential that this work be planned for and done with new lunar data. Geodetic control adds substantial value to the data, especially relative to the cost of data collection and the immense risk that future surface
missions may fail if the maps used to evaluate landing site safety or plan their operations are insufficiently accurate.
3.2 The Need for Global Topography
As noted in Section 2, new global DTMs have recently been produced from Kaguya (Araki et al. 2009), LOLA (Smith et al. 2010), and Chang’e-1 (Li et al. 2010) altimetry, as well as Kaguya TC (Haruyama et al. 2012) and LROC WAC (Scholten et al. 2011) stereo imagery. As revolutionary and scientifically valuable as these models are, there is still a need for global topographic modeling at higher resolution and accuracy. For example, the laser altimetry models have substantial longi-tudinal data gaps at mid- and particularly equatorial latitudes. The WAC stereo DTM is based on ~100 m resolution images that, although aligned with LOLA Team derived spacecraft position information, are uncontrolled and may have errors comparable to their resolution. These existing global models are therefore insufficient for the orthoprojection of high resolution images at or even near the resolution of such data. They are also insufficient for the orthoprojection, slope correction, and calibration of medium resolution (100 m/pixel or more) color, multispectral, or infrared data (e.g., Kaguya MI and SP, LRO WAC and DLRE, Chandrayaan-1 M3
). Correction of slope based photometric effects requires topographic data with horizontal resolution at the image pixel scale or less and vertical precision on the order of a tenth of a pixel or less. Such photometric correction has been shown to affect the compositional interpretation of spectral data at the 5% level and significantly affect geologic interpretations of spectral variability (Robinson and Jolliff 2002).
A high-resolution, global DTM is not only needed to process global datasets in preparation for scientific analysis, it is critical for successfully planning and conducting robotic and human mission operations on the Moon. Even higher resolution DTMs are needed to process local to regional high-resolution data. Such DTMs can be generated from the combination of the altimeter data and stereo data, particularly (in order from highest to lowest resolution) NAC, Apollo, TMC, CCD-2, TC, MI, and LRO Mini-RF imagery.
3.3 What System and Frame?
The recommended coordinate system for the Moon (Archinal et al. 2011; LRO & LGCWG 2008) is the mean Earth / polar axis (ME) system, and the recommended way to access it is via the JPL DE 421 ephemerides, with an appropriate rotation to the ME system. The recommended mean radius for the Moon is 1737.4 km (Archinal et al. 2011; LRO & LGCWG, 2008), and fortunately most instrument teams and missions have adopted these recommendations. The real issue then becomes using or creating a reference frame within that coordinate system to which datasets can be referred. Currently the best lunar reference frames are those derived from Lunar Laser Ranging (LLR). These frames have coordinate system accuracies approaching the decimeter to centimeter level, but only for the 5 existing LLR targets. It will be necessary to tie the other datasets into an LLR frame or one based on it.
3.4 What Datasets?
Noted above are some of the highest density or resolution altimetric and stereo datasets that can be used to build a fundamental lunar reference frame and uniform global DTM. Other required data include spacecraft geometric (“SPICE” — Acton 1999—or similar) data and a lunar gravity model (ideally incorporating the results from the GRAIL mission). Once such a frame and model are established, all lunar data can be tied to them, including the recent mission data described in Section 2, and data from earlier missions such as Lunar Orbiter, Apollo, Clementine, and Lunar Prospector.
3.5 Processing Principles
Some flexibility exists concerning the order in which data should be processed, and in which algorithms, software, and International Archives of the Photogrammetry, Remote Sensing and Spatial Information Sciences, Volume XXXIX-B4, 2012
procedures should be developed. However, the most critical steps are to derive and register data to a common frame and DTM early in the process. For some datasets, the requisite processing has been or will soon be accomplished, as described in Section 2.3. For many of the other datasets listed in Section 2.2, planning has not begun and funding has not been identified. The following steps are recommended:
1) The global DTM should be created first, so that datasets can be controlled and calibrated relative to it and projected onto it.
2) “Co-located” or simultaneously collected data (e.g., LOLA and LROC), should be tied and adjusted simultaneously. These first two steps benefit one another and will likely have to be iterated if the DTM is significantly altered by adjusting the instrument pointing.
3) Less accurately located datasets need to be registered to more accurately located datasets.
4) Control, calibration, and orthomosaicking of lower reso-lution images and image-like spectral, compositional, and thematic data should be done last.
Because these steps are unlikely to be carried out in strict order, financial, human, and technical resources need to be set aside for some limited reprocessing of data. For example, as the subpixel resolution of a given dataset is approached in accuracy, reference frames, crossover solutions, tiepointing, and photo-grammetric solutions will improve.
3.6 Challenges
Completing the steps listed above will involve many technical challenges, including:
1) Tying any one of the dataset frames (e.g., LOLA) to an LLR frame.
2) Tying together “co-located” data (e.g., LOLA to LROC NAC and WAC, perhaps LALT to TC and MI).
3) Combining altimetric and photogrammetric solutions involving unprecedented amounts of data to increase the positional accuracy of both altimetric and image data. 4) Tying together multi-mission altimetric data (possibly by
merging or simultaneous crossover solutions) into one frame and DTM.
5) Tying and merging stereo images or DTMs, with altimetry. 6) Merging multiple resolution DTMs together.
7) Controlling pushframe images (e.g., LROC WAC). 8) Making geometric camera models available in various
software packages (or in a common package).
9) Improving algorithms and software for reliable automated tiepointing, large photogrammetric adjustments, automated stereo processing, outlier detection, and altimetric solutions.
Largely financial and political challenges include:
1) Finding sufficient funding for such work in an era of constrained budgets.
2) Arranging international collaborations including the release of raw or partially processed data.
4. MISSION PLANS FOR THE 2010S AND BEYOND
The number of orbital missions planned to conduct remote sensing of the Moon in the current decade is relatively small compared to the previous decade. Foremost among these is the further extension of the LRO mission, which would make it possible to collect a variety of additional data including WAC imagery with more consistent illumination and new NAC stereopairs. Global NAC image coverage could potentially be obtained at a reduced resolution of 2 m/pixel. The NASA GRAIL mission (Zuber et al. 2012), currently in operation, is not tasked with remote sensing, but is improving knowledge of the lunar gravity field, which could significantly improve the accuracy of orbit estimations for other spacecraft in the future, and thus improve the cartographic accuracy of their products. The NASA Lunar Atmosphere and Dust Environment Explorer (LADEE; Delory et al. 2009) planned for launch in 2013 is not a mapping mission. India and Russia are planning an ambitious joint mission Chandrayaan-2/Luna Resurs that will conduct
significant orbital remote sensing (Goswami and Annadurai 2011). This mission will include an Indian-built orbiter and a Russian lander carrying an Indian rover. Instruments on the orbiter will include a second Terrain Mapping Camera (TMC-2), a dual-wavelength SAR, and an Imaging Infrared Spectro-meter (IIRS). Launch of the mission was planned for 2014 but the recent failure of the Russian Phobos Grunt mission makes it likely that the joint Indian-Russian mission will be delayed by several years (Zak 2012).
The list of potential lunar landers in the 2010s is somewhat longer. Among the most definite are the lander/rover component of Chandrayaan-2/Luna Resurs and the Chinese Chang’e-3 lander scheduled for launch in 2013 (Xinhua 2012b). The Google Lunar X-prize, announced in 2007, would reward private organizations for lunar landing and operations, and has attracted numerous competitors, some of whom have conducted launch and operations tests (see Wikipedia, 2012 for a list of the announced entrants). The inclusion of lunar laser ranging retroreflectors (LLRR) on these missions is being discussed and could contribute to improving the absolute accuracy of lunar maps in the future. NASA has cancelled both its Lunar Precursor Robotic Program and its Constellation Program for human exploration of the Moon, and currently has no definite plans for lunar missions beyond those mentioned above. The MoonRise mission to return samples from the South Pole-Aitkin basin (Jolliff et al. 2010) was not selected as a NASA New Frontiers mission in 2011, but is likely to be reproposed at a future opportunity. Other concepts, such as SELENE-2 (Japan), Luna Grunt (Russia), MoonLITE and MoonRaker (UK), were first described in the mid-to-late 2000s, but little or no new information has been issued since, so they must be considered conjectural at best. Also in this category are the plans announced by nearly all space agencies in the past decade to land humans on the Moon in the era 2020–2030. Whichever of these missions comes to fruition, they will not be producers of cartographic data but will urgently require high-quality cartographic data in order to select and certify landing sites and plan surface operations (cf. Golombek et al. 2012).
5. CONCLUSIONS
To make full use of the new high-value lunar data, these data must be registered using a common reference frame and DTM. The resources required to do such processing thoroughly are significant and have not been forthcoming, but at a level of a few million dollars they pale in comparison to the billions already spent to collect the raw data and the billions more—not to mention human lives—that would be risked if future surface missions do not have accurate map data for landing site selection/certification and operations. Furthermore, the burden of systematic cartographic processing of the existing lunar datasets will be reduced if it is shared among nations. The small number of lunar orbital missions with firm plans in the immediate future presents an key opportunity for the current decade to be spent in intensive and increasingly international analysis of existing lunar remote sensing data rather than the collection of major new datasets.
6. REFERENCES
Acton, C.H., 1999. SPICE Products Available to the Planetary Science Community. LPS XXX, 1233.
Araki, H., 2012. The status of calibration/validation and data archive of LALT. 6th KAGUYA (SELENE) Science Working Team Meeting, Nagoya, January 2012.
Araki, H., et al., 2009. Lunar global shape and polar topography derived from Kaguya-LALT laser altimetry. Science 323, pp. 897-900.
Archinal, B.A., et al., 2007. Urgent processing and geodetic control of lunar data. Sci. Associated with the Lunar Exp. Arch., Tempe, AZ.
Archinal, B.A., et al., 2011. Report of the IAU Working Group on Cartographic Coordinates and Rotational Elements: 2009. Cel. Mech. & Dyn. Ast. 109, pp. 101–135.
Beyer, R.A., et al., 2011. LROC DTM comparison effort. LPS XLII, 2715.
Boardman, J.W., et al., 2011. Measuring moonlight: An overview of the spatial properties, lunar coverage, selenolocation, and related Level 1B products of the Moon Mineralogy Mapper. JGR 116, E00G14.
Burns, K.N., et al., 2012. Digital elevation models and derived products from LROC NAC stereo observations. This conference.
Chin, G., et al. 2007. Lunar Reconnaissance Orbiter Overview: The Instrument Suite and Mission. SSR 129, pp. 391–419. Clark, 2010. China’s second Moon probe dispatched from
Earth. http://www.spaceflightnow.com/news/n1010/ 01change2launch/ (14 April 2012).
Delory, G.T., et al., 2009. The Lunar Atmosphere and Dust Environment Explorer (LADEE). LPS XL, 2025.
Despan, D., et al., 2008. High Resolution Maps of the Moon Surface with AMIE/SMART-1. BAAS 40, p. 405.
Golombek, M.P., et al., 2012. Selection of the MSL landing site. P&SS, in press.
Goswami, J.N., and Annadurai, M., 2009. Chandrayaan-1: India’s first planetary science mission to the Moon. LPS XL, 2571.
Goswami, J.N., and Annadurai, M., 2011. The Chandrayaan-2 mission. LPS XLII, 2042.
Grieger, B., et al., 2008. Coverage and pointing accuracy of SMART-1/AMIE images. LPS XXXIX, 2221.
Haruyama, J., et al., 2008. Global lunar-surface mapping experiment using the Lunar Imager/Spectrometer on SELENE. EPS 60, pp. 243–255.
Haruyama, J., et al., 2012. Lunar global digital terrain model dataset produced from SELENE (Kaguya) Terrain Camera Stereo Observations. LPS XLIII, 1200.
The Hindu, 2011. Chandrayaan-1 Mission Terminated. http://www.hindu.com/2009/08/31/stories/200908315791010 0.htm (14 April 2012).
Hu, W., Yue, Z., and Di., K., 2011. Crossover Analysis of Chang’E-1 Laser Altimeter Data. ISPRS Workshop “Geospatial Data Infrastructure”, Guilin, China, 20-21 October 2011.
Huang, Q., et al., 2010. Improved global lunar topographic model by Chang’e-1 laser altimetry data. LPS XLI, 1265.
İz H.B., et al., 2011. Assessing Consistency of Chang’E-1 and SELENE Reference Frames using Nearly-colocated Laser Altimetry Footprint Positions, J. Geod. 86, pp. 109-117. Jolliff, B.L. et al., 2010. MoonRise: South Pole-Aitken Basin
sample return mission for solar system science, LEAG Annual Meeting, LPI Contribution 1595, p. 31.
Kirk, R.L., Archinal, B.A., Gaddis, L.R., and Rosiek, M.R., 2006. Cartography for lunar exploration: 2006 status and planned missions. IAPRS, XXXVI(4), "Geospatial Databases for Sustainable Development", Goa (CD-ROM).
Kirk, R.L., Archinal, B.A., Gaddis, L.R., and Rosiek, M.R., 2007. Cartography for lunar exploration: Current status and planned missions. XXIII Int. Cart. Cong., 6410 (DVD-ROM). Kirk, R.L., Archinal, B.A., Gaddis, L.R., and Rosiek, M.R., 2008. Cartography for lunar exploration: 2008 status and mission plans. IAPRS XXXVII(4), “A Silk Road for Information from Imagery”, Beijing, pp. 1473–1480 (DVD-ROM).
Kirk, R.L., et al., 2011. Radargrammetric mapping of the Moon with Mini-RF, ISPRS Workshop “Geospatial Data Infrastructure”, Guilin, China, 20-21 October 2011.
Kirk, R.L., et al., 2012. Progress in radargrammetric analysis of Mini-RF lunar images. LPS XLIII, 2772.
Krishna, A.S., et al., 2009. The Terrain Mapping Camera on Chandrayaan-1 and initial results. LPS XL, 1584.
Krishna, G., et al., 2010. Planetary data archiving activities in Indian Space Research Organisation (ISRO). 38th COSPAR Scientific Assembly, Bremen, 18-15 July 2010, p. 3.
Krishna, A.S., et al., 2012. Comparison of DEMs from Terrain Mapping Camera images with LOLA. LPS XLIII, 2026. Lee, E.M., et al., 2012. Controlled polar mosaics of the Moon
for LMMP by USGS. LPS XLIII, 2507.
Li, C.L., et al., 2010a. The global image of the Moon obtained by the Chang’E-1: Data processing and lunar cartography. Sci. China Earth Sci. 53, pp. 1091–1102.
Li, C.L., et al., 2010b. Laser altimetry data of Chang’E-1 and the global lunar DEM model. Sci. China Earth Sci. 53, pp. 1582–1593.
Liu, J.J., et al., 2009. Automatic DEM Generation from CE-1’s CCD Stereo Camera Images. LPS XL, 2570.
Mazarico, E., et al., 2011. Selenodesy with LRO: Radio tracking and altimetric crossovers to improve orbit knowledge and gravity field estimation. LPS XLII, 2215. Mazarico, E. et al., 2012. Topography of the Lunar Poles and
Application to Geodesy with the Lunar Reconnaissance Orbiter. LPS XLIII, 2423.
NAC, 2007. NASA Advisory Council Workshop on Science Associated with the Lunar Exploration Architecture Crosscutting Recommendation. Tracking Number: S-07-C-1. http://bit.ly/x0HnnM (14 April 2012).
Noble, S.K., et al., 2009. The Lunar Mapping and Modeling Program. LEAG Annual Meeting, LPI Contribution 1515, 2014.
Nozette, S., et al., 2010. The Lunar Reconnaissance Orbiter Miniature Radio Frequency (Mini-RF) technology demonstration. SSR 150, pp. 285–302.
Pinet, P., et al., 2005. The advanced Moon micro-imager experiment (AMIE) on SMART-1: Scientific goals and expected results. P&SS 53, pp. 1309–1318.
Radhadevi, P.V., et al., 2011. Rigorous photogrammetric pro-cessing of Chandrayaan-1 Terrain Mapping Camera (TMC) images for lunar topographic mapping. LPS XLII, 1384. Raney, R.K. et al., 2011. The lunar Mini-RF radars: hybrid
polarimetric architecture and initial results. Proc. IEEE 99, pp. 808-823.
Robinson, M.S., et al., 2010. Lunar Reconnaissance Orbiter Camera (LROC) Instrument Overview. SSR 150, pp. 81-154. Robinson, M.S., and Jolliff, B.L., 2002. Apollo 17 landing site:
Topography, photometric corrections, and heterogeneity of the surrounding highland massifs. JGR 107, 5110.
Rosiek, M.R., et al., 2012. USGS digital terrain models and mosaics for LMMP. LPS XLIII, 2343.
Scholten, F., et al. 2011. GLD100—The global lunar 100 meter raster DTM from LROC WAC stereo models. LPS XLII, 2046.
Shum, C.K., et al., 2012. Lunar topography model determined by integrating laser altimetry from multiple orbiters. LPS XLIII, 2407.
Smith, D.E., et al., 2010. The Lunar Orbiter Laser Altimeter Investigation on the Lunar Reconnaissance Orbiter Mission. SSR 150, pp. 209–241.
Spudis, P.D., et al., 2010. Initial results for the north pole of the Moon from Mini-SAR, Chandrayaan-1 mission. GRL 37, L06204
Su, X.L., et al., 2011. The improved topographic model from Chang’e-1 mission. LPS XLII, 1077.
LRO & LGCWG, 2008. A standardized lunar coordinate system for the Lunar Reconnaissance Orbiter and lunar datasets. LRO Project and LGCWG White Paper, Version 5, 2008 October 1. http://lunar.gsfc.nasa.gov/library/ LunCoordWhite Paper-10-08.pdf (14 April 2012).
Wikipedia, 2012 Google Lunar X Prize. http://en.wikipedia. org/wiki/Lunar_X_Prize (14 April 2012).
Xinhua, 2011. China’s second moon orbiter Chang’e-2 goes to outer space http://news.xinhuanet.com/english2010/china/ 2011-06/09/c_13920425.htm
Xinhua, 2012a. China publishes high resolution full-moon map.
http://news.xinhuanet.com/english/sci/2012-02/06/c_131393210.htm (14 April 2012).
Xinhua, 2012b. China to launch moon-landing orbiter in 2013.
http://news.xinhuanet.com/english/china/2012-03/05/c_131447340.htm (14 April 2012).
Zak, A., 2012. Luna-Resurs. http://www.russianspaceweb.com/ luna_resurs.html (14 April 2012).
Zuber, M.T. et al., 2012. Gravity Recovery and Interior Laboratory (GRAIL) Mission: Status at the Initiation of the Science Mapping Phase. LPS, XLIII, 1489.
Zuo, W., et al., 2011. Public data release of the Chinese Chang’E missions. EPSC 6, EPSC-DPS2011-995-1.