BENTHIC HABITAT MAPPING AND BIODIVERSITY ANALYSIS IN THE PRIMEIRAS
AND SEGUNDAS ARCHIPELAGO RESERVE
L. Teixeira a,*, M. Nilsson b,*,J. Hedley c,d, A. Shapiro e
a
Lund University, Department of Physical Geography and Ecosystems Science, Sölvegatan 12, 223 62, Lund, Sweden – [email protected]
b
Lund University, Department of Physical Geography and Ecosystems Science, Sölvegatan 12, 223 62 Lund, Sweden – [email protected]
c
Argans Ltd., UK d
Environmental Computer Science Ltd.,UK e
World Wide Fund for Nature (WWF) Germany, Berlin
KEY WORDS: Very high resolution remote sensing, Object-based image classification, Benthic habitats, Coral reef, Marine ecosystems, Fish biodiversity, Landscape metrics
ABSTRACT:
The Primeiras and Segundas Archipelago Reserve is a recently established marine protected area, the largest in Africa, located in the waters of Northern Mozambique. This protected area is of significant local economic importance and global ecological relevance, containing the southernmost coral reefs in Eastern Africa. However, information related to the marine ecosystem, notably benthic habitat is very scarce. Twelve atolls were mapped in the region using object-based image classification of very-high resolution satellite imagery (IKONOS, Quickbird, and WorldView-2). Geographically referenced data on benthic cover and depth were gathered in the course of three fieldwork expeditions covering a total of four atolls and two shallow reef structures in the Segundas Archipelago. The resulting map allows the estimation of three distinct types of coral cover (field, patches, spurs and grooves); the differentiation of sand, rubble and rock substrate; and the detection of seagrass and brown macroalgae, identifying up to 24 benthic habitats. Average overall accuracy was above 50%. The high variability of the optical properties on the reef systems, in large due to the connectivity with the mainland via plumes, while interesting from an ecological perspective increases the challenges for remote sensing of bottom cover. New information indicates the presence of deep benthic cover extending from the atolls, suggesting the need for further research on Coastal Eastern African corals, namely on their resilience and connectivity, and supporting current knowledge of the existence of an almost continuous coral reef from Kenya to Mozambique. Coral and fish biodiversity data have been analysed together with the satellite-derived maps. Results support the local perception that ecosystems are in decline and uncover new information about biodiversity’s spatial patterns. Our work provides a detailed depiction of marine habitats that may aid the management of the protected area, namely in the definition of fishing zones and coral cover monitoring.
1. INTRODUCTION
The Primeiras and Segundas Archipelagos, Mozambique, together with part of the coastline, were declared Environmental Protected Area in November 2012. Work has been developed in the region by WWF in the past 10 years regarding biodiversity conservation, overfishing and illegal tourism, the main problems identified in the region (WWF 2012).
In the 2012 UNEP report of the Southern Indian Ocean Regional Workshop to Facilitate the Description of Ecologically or Biologically Significant Marine Areas, the Primeiras and Segundas are said to belong to “the largest and [to be] among the most productive fisheries areas in Mozambique, attaining close to 50% of the entire industrial catches”, “with probably the most pristine coral reefs in Mozambique”, being “important for connectivity between northern and southern reefs” (CBD 2013).
However, previous research in the region (Whittington and Heasman 1997, Schleyer 1999, Celliers and Schleyer 2000, Services 2000, Pereira and Videira 2007, Delacy, Bennett et al. 2014) gathered coral and fish biodiversity data and although referring to impressive coral diversity, expressed concern about decreasing fish numbers.
The project to create benthic habitat maps for the region, initiated by WWF-Germany and supported by ESA’s G -ECO-MON initiative, aimed to increase knowledge of the spatial distribution of reef ecosystems, and support improved management and planning. By integrating existing biodiversity data with the newly created maps, further knowledge can be acquired, and unknown spatial patterns uncovered, contributing to a more complete and comprehensive portrait of local ecosystem.
2. STUDY AREA
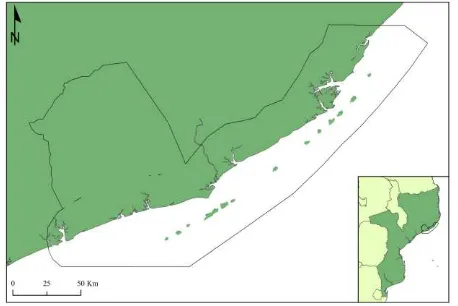
The Primeiras and Segundas Environmental Protected Area (PSEPA) is defined around the two Archipelagos of the same names (Figure 1). It extends for more than 1 000 000 hectares, over 205 km of coastline, spreading over Pebane, Moma and Angoche districts (WWF 2012).
Figure 1. PSEPA’s location, in Mozambican coastline, between 16° 12’S and 17° 17’S. The Archipelagos are located parallel to the coastline.
Each archipelago includes five islands, although Segundas, further north, also includes two banks. These archipelagos are believed to be the most Southern of a nearly continuous series of reefs that extends for 700 km to the Rovuma river mouth, and further on to Tanzania and Kenya (Hoguane 2007, Pereira and Videira 2007).
The local economy relies on fisheries, and the PSEPA harbours artisanal, semi-industrial, and industrial fishing activities. The islands are used as seasonal fishing centers (de Abreu, Costa et al. 2008). The coastal populations are almost highly dependent on fishing, mainly for subsistence but also for financial purposes (de Abreu, Costa et al. 2008). There is general understanding that decreasing fish stocks are due to increasing numbers of fishermen (de Abreu, Costa et al. 2008). Industrial fishing has been growing, increasing the pressure on marine resources. The overfishing problem is estimated to affect about 750 000 people (de Abreu, Costa et al. 2008).
3. METHODS
Fieldwork comprised two surveys for data gathering in the Segundas Archipelago in April and May 2014. Data points were taken along routes at 80 – 150 meter intervals, with focus on benthic cover changes. Due to tidal and geomorphologic characteristics of the islands, one route was defined as the circumnavigation of the island and lagoon system, while a second one was restricted to the lagoon. The lagoon routes were adjusted so as to cover previously defined zones of interest. A total of 666 data points were collected. Each point comprises geographic coordinates, depth and benthic cover. Location was captured with a Garmin Montana 650t GPS, while depth was measured with a HawkEye H22PX handheld sonar system. Benthic cover was observed from the boat using a clear bottom bucket and recorded using simple descriptive categories. Additional comments, including more details of the cover were recorded, and underwater photographs were taken at selected locations to illustrate different benthic cover types. Each point collection was made from a slowly moving boat, due to the difficulty and time consumption associated with attaining “stillness”.
Pixel size of the satellite imagery was considered in the sampling. The assessment of benthic cover was performed over at least four meters radius, preferably within features and where
changes of benthic cover were observed. This resulted in a flexible sampling frequency.
Interviews were conducted with members of the main groups of interest in the region, spanning Government, Industry and NGO. The interviews aimed at acquiring further information to support the contextualization of the physical data within a wider sustainability scope and to assist in future field surveys.
Benthic habitat mapping was performed using an object based approach using Trimble eCognition Developer software and WorldView-02, Quickbird 2 and GeoEye-1 imagery acquired between 2009 and 2013. Processing steps included radiometric correction, PCA, dark object subtraction, sun glint correction (Hedley, Harborne et al. 2005) and water column correction (Lyzenga 1978, Lyzenga 1981).
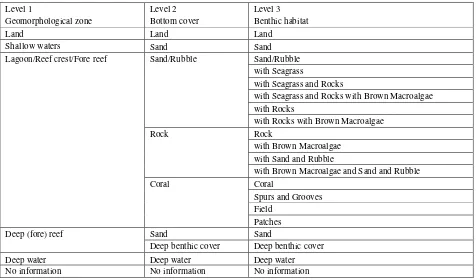
A benthic habitat classification scheme, including geomorphological, bottom cover and benthic habitat levels, was developed based on previous schemes (Mumby and Harborne 1999, Rohmann 2008, Andréfouët 2012). The classification scheme was adapted to the field data and imagery so as to maximize the variety of benthic habitats included, provided an adequate level of confidence in the recognition of features (Table 1).
Due to limited amount, field data points were not used as Ground Control Points, but reserved for Accuracy Assessment. Classification was conducted based on empirical knowledge of the local coral reef systems, supported by collected field data.
Biodiversity data was available from two main sources: rapid assessments of the coral reef status (Pereira and Videira 2007, Pereira and Rodrigues 2014) and East African Marine Transect expedition (Delacy, Bennett et al. 2014). While EAMT only covers fish data – species diversity, density and biomass –, the rapid assessments also include live coral cover percentages as well as number of genera.
The correlation between coral and fish metrics was assessed for the three mapping levels by applying Spearman’s rank correlation test to the 2006 rapid assessment data, the only year that features both data types. Following the same reasoning, the relationship between map derived landscape metrics and the most recent fish dataset, i.e. EAMT, was analysed. Selected landscape metrics included patch density, edge density, number of classes and Shannon Diversity Index (SHDI), further complemented by distance to the main fishing harbour, Angoche. Landscape metrics were calculated for increasing buffer sizes (7, 12 and 25 meters) around each fish sampling point.
4. RESULTS
4.1 Benthic habitat mapping
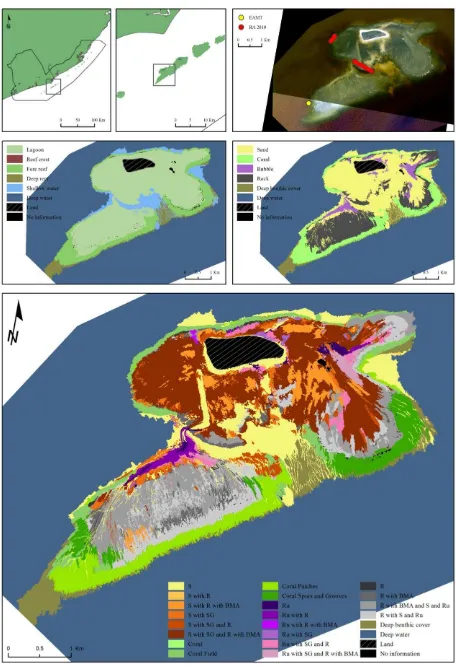
information. Sand, followed by coral, was the predominant L2 class (Error! Reference source not found.).
At the benthic habitat level (L3) it was possible to determine 13 to 24 classes, including the detailing of coral into coral field, patches and spurs and grooves. This last structure covered the largest extension, followed by coral field and then coral patches. Rock, rubble and sand are distributed at the benthic habitat level with no clear class predominance.
Figure 2. Bottom cover (L2) classes distribution. Locations are listed according to their N-S distribution.
L2 overall accuracy was between 40% and 90%, while approximately 30% to 70% for L3 (Figure 3). The exclusion of Sao Miguel, the least surveyed island, would improve the lower limits of the accuracy ranges in about 20%.
For the remaining six islands, although mapped, it was not possible to assess their accuracy due to the lack of ground control points. Nonetheless, considering the similarities among the coral reef systems and the applied methodology, accuracy is expected to fall within the above mentioned ranges, although probably tending to lower values.
Figure 3. Overall accuracy (OA) results at bottom cover (L2) and benthic habitat (L3) levels.
4.2 Biodiversity analysis
Between 2006 and 2010, there was a decrease of both average live coral cover (60% to 40%) and number of coral genera (22 to 17). While live coral cover shows a decreasing trend towards South, the opposite occurs for coral genera, indicating increasing diversity despite the lower coverage.
Level 1 Level 2 Level 3
Geomorphological zone Bottom cover Benthic habitat
Land Land Land
Shallow waters Sand Sand
Lagoon/Reef crest/Fore reef Sand/Rubble Sand/Rubble with Seagrass
with Seagrass and Rocks
with Seagrass and Rocks with Brown Macroalgae with Rocks
with Rocks with Brown Macroalgae
Rock Rock
with Brown Macroalgae with Sand and Rubble
with Brown Macroalgae and Sand and Rubble
Coral Coral
Spurs and Grooves Field
Patches
Deep (fore) reef Sand Sand
Deep benthic cover Deep benthic cover
Deep water Deep water Deep water
No information No information No information
Fish density and diversity show a similar behaviour, decreasing between 2006 and 2013 and, for both years, in the North-South direction. It was not possible to assess the variation of fish biomass between 2006 and 2013 due to contradictory values, likely due to differences between the sampling methodologies. Nonetheless, both datasets show an approximately constant profile of biomass across the region.
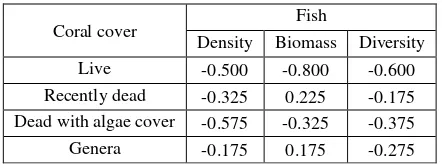
The Spearman correlation coefficients values between 2006 coral cover and fish variables indicate mostly weak relationships, although there were moderate relationships (0,5 < r < 0,59) between both live and dead coral cover and fish density, strong (0,6 < r < 0,79) between live coral cover and fish diversity and very strong (0,8 < r < 1,0) between live coral cover and fish biomass (Table 2). These trends are all unexpectedly negative, indicating a decrease of fish indices with increasing coral variable values.
Table 2. Spearman rank correlation test results (r) for coral cover and fish variables from the 2006 dataset
The Spearman rank correlation test further indicates weak relationship between fish variables (2014 dataset) and selected landscape metrics. Based on the values of Spearman’s correlation coefficient, moderate positive relationships were found at the geomorphological level for
• Relative fore reef area and fish density (7 m buffer), •Patch density and fish biomass (7 and 12 m buffer) and •Edge density and fish biomass (12 m buffer);
at the bottom cover level for
•Patch density and fish density (12 meter buffer); and at the benthic habitat level for
•Coral field and fish biomass (7 and 25 m buffer).
The relationship between fish variables and distance to the main local fishing harbour, Angoche, is according to Spearman’s correlation test, very weak to weak (r < 0,20).
5. DISCUSSION
5.1 Benthic habitat mapping
Throughout the PSEPA, there is a very consistent geomorphological pattern. The islands show similar characteristics, particularly a spurs and grooves zone in the South and East, with well-developed coral building up towards the reef crest. The spurs and grooves follow a South-Southeast direction due to the prevailing currents and wind. Progressing from the seaward side around the reef crest towards the landward side the coral becomes less developed and flatter, and the grooves become broader and filled with more sand.
The shallow lagoon (about 2 meters deep during high tide) tends to have rubble, usually made of weather-broken coral, along with rock, seagrass and algae in sand substrate. Northwest of the atolls there are boulders, identified in the fieldwork as coral patches. On the Northeastern and Eastern sides, towards
mainland, there are sand and seagrass and/or algae extensions. Both lagoon and reef crest are likely to be exposed during low spring tides. of coral cover shows a slight increase towards South, although each type’s contribution remains quite constant.
The remaining class types, based on sand, rubble and rock, show no class predominance or particular trend across the archipelagos, except for the high occurrence of mixed classes (e.g. Rock with Brown Macroalgae and Sand and Rubble, Rubble with Seagrass and Rocks with Brown Macroalgae, Sand with Seagrass and Rocks with Brown Macroalgae), although there is no clearly predominant one.
The large variety of benthic covers and its subtle variations poses significant challenges to the clear delineation of the scenes into classes. With few exceptions, the fundamental constituents identified during the field campaigns – sand, rock, rubble, seagrass, brown macroalgae and coral – are quite intermixed. Additionally, aquatic vegetation, algae and coral come in a myriad of species with different spectral signatures, densities, growing patterns and conditions, creating a wide range of textures and colours not easily separated. Both in the field and in the mapping exercise, visual assessment and class assignment remained challenging, introducing bias and being subject to interpretation error.
The deep benthic cover class was difficult to delineate due to a weak discernible signal, and remained unknown regarding its actual composition. However, it is reasonable to make two broad assumptions that support the possibility of its identification as coral. The first is that the western side of the islands show less suitable conditions for coral, with harder to colonize sand substrate and worse light conditions on account of sediment discharge from the mainland (Whittington and Heasman 1997). The second is that the strong currents on the exposed sides of the reef system make the presence of seagrass less likely than of coral structures. These assumptions, together with the features’ proximity to identified coral structures and their alignment with the archipelagos’ islands, indicate the possibility of the existence of unmapped deeper reef structures between the islands. If the presently mapped deep benthic cover would prove to be coral, that would result in an approximate threefold increase of its extent in PSEPA, and a strong incentive for further research of these, and other deep areas known in the region.
that the remaining maps, although not having an estimate of their level of confidence, would be adequate for the same uses.
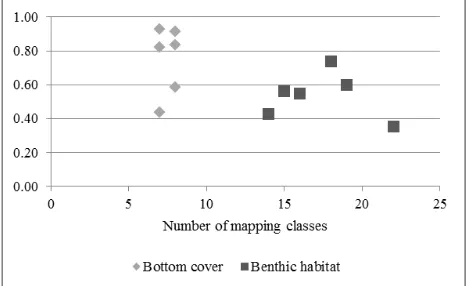
As expected, accuracy decreases with increased mapping complexity, resulting in lower overall accuracy values for benthic habitat mapping. This was observed by Andréfouët (2008), who assessed results of mapping efforts using IKONOS, suggesting that “high accuracy (>70%) is limited to a low number of ~10 classes”, and later confirmed by Roelfsema, Phinn et al. (2013). In this later study it was observed that the variation of mapping categories “did not influence the overall accuracy of the [VHR, OBIA] maps, with overall accuracy for each map type falling within the same range: ‘geomorphic zone’ map with 70–90% overall accuracy and ‘benthic community’ map with 52–80% overall accuracy”. Our results are consistent with this, and show a similar behavior as the above mentioned ranges, with accuracy falling 20% to 30% when the number of classes increases by 10 to 15 (Figure 5). Finally, overall accuracy values are concordant with current research results (Capolsini, Payri et al. 2003, Andréfouët 2008, Knudby, LeDrew et al. 2010, Roelfsema, Phinn et al. 2013).
Figure 5. Overall accuracy variation with number of bottom cover and benthic habitat mapping classes
Obtained accuracy values are probably due to challenges such as geolocation accuracy, temporal discrepancy/precision, tidal variations influence and benthic cover identification. In particular time discrepancy and geolocation error have implications both in the classification process – as the field data was used to guide the feature identification – and the accuracy assessment.
Additionally, as imagery and field data differ in up to 5 years, it is likely that changes in the benthos have occurred. This is primarily an issue concerning aquatic vegetation, more susceptible to change, although deposition and erosion processes may also incur rapid change, particularly on sand and rubble substrate.
Furthermore, visibility was an issue during fieldwork, being responsible for the exclusion of 128 out of 666 points. This resulted in the avoidance of their direct application as training points, in an attempt to assure adequate accuracy assessment. It is recommended to have around 80 training and 30 to 50 accuracy assessment sites per class for coarse four habitat classes maps covering areas of several square kilometres (Green, Mumby et al. 2000). The recommended collection of data in heterogeneous areas and along transects across different zonations recommended in Andréfouët (2008) was to a great extent impossible for safety reasons. The reef crest, inaccessible
due to strong currents and low depth, acted as a divide between the lagoon and the outer fore reef, preventing data collection in many zones of interest. Collected field data was clearly insufficient for the assessment of all benthic level classes, and in some cases too poorly distributed for adequate evaluation at the bottom cover level. As expected, bad accuracy scores were associated with mixed, thematically close classes such as Sand/Rubble/Rock with Macroalgae and Seagrass/Seaweed.
The level of data collected during the surveys was perceived as quite helpful for the PSEPA management, and as a good starting point for further, more detailed, research work. It was mentioned that future studies can be designed based on better and more detailed information of the area, for which the current maps are expected to contribute. Data on depth and benthic cover was mentioned as useful for defining where each fishing technique can be used, which has not been possible before – with this new information it will be possible to support which type of fishing technique can be used and where, and to justify those choices. The definition of recreational and sporting fishing areas is a possible use of the information, as well as line vs. seine fishing zones.
In general, it is considered that for this particular study, the primary value of the coral reef maps is the overview they offer, which contrasts with the small scale and spatial fragmentation of the results offered by previous surveys.
5.2 Biodiversity analysis
Coral cover decreased by approximately 20% between 2006 and 2013, although the proportion live coral remained the same. So although the coral cover shows a decreasing trend, its health seems stable. Both surveys denoted a North-South negative trend of live coral cover.
This spatial negative trend is further noticeable on the fish dataset. Fish density, diversity and biomass all have lower values towards the South of the PSEPA archipelagos. Additionally, fish density shows a decrease between 2006 and 2013. Diversity and biomass are more difficult to compare from a temporal perspective, as their values show great discrepancies. This is an inherent difficulty of using dataset originating from field surveys based on distinct methodologies. It is possible, nonetheless, to refer to their spatial North-South decrease. This is a valuable point as it contradicts general PSEPA management impressions. In the interviews, the belief that Southern islands, further away from fishermen reach, should present higher number of fish was consensually expressed.
variety of genera, which is not supported by the present analysis.
No statistically significant relationships or trends were found for the landscape metrics and fish variables of the 2014 dataset. However, obtained results seem reasonable and in agreement with current common knowledge of reef systems ecology. Also, the majority of Spearman correlation coefficients indicate positive relationships between variables, which was the expected behavior for the chosen metrics.
Although not based on very strong statistical relationships, results in geomorphological and bottom cover maps indicate that in complex, heterogeneous zones (i.e. with higher patch and edge density) at finer spatial scales (≤ 12m) larger fish can be found. Similarly, areas with more relative coral field cover are expected to foster larger fish for both finer and coarser scales (≤ 25 m) in benthic habitat maps. Additionally, higher fish numbers are to be expected in areas with more fore reef, but only at fine scales. This type of information could assist in, for example, the design of fish surveys or the delineation of non-fishing zones.
The conducted interviews revealed the general impression that detailed and verified data is lacking, and that more field surveys are needed. This acknowledgement coexists, however, with the expectation of better maintained and richer ecosystems towards South, namely on the Primeiras islands, which coincides with the area where research has been less consistently performed.
All the interviewees referred that marine fauna is declining with increasing speed and most attribute it to increased fishing pressure, as artisanal fishermen numbers have been escalating. This is mentioned to be most significant on coastal areas, while no significant changes are mentioned for open waters within the artisanal fishing zone. The islands North of Njovo, closer the main population centers, are under heavier fishing pressure. However, distance to the main fishing port, Angoche, correlates weakly with fish density, fish biomass and species diversity.
6. CONCLUSIONS
Through the G-ECO-MON effort it was possible to gather knowledge on the previously unmapped coral reefs in the Primeiras and Segundas Environmental Protected Area (Mozambique). Twelve atolls were mapped at the geomorphologic, sea cover and benthic habitat level to a maximum of 24 classes with average overall accuracy above 50%. Among the identified components there was sand, rubble, rock, seagrass and brown macroalgae, and coral.
Results support the local consensus of local ecosystem decline. Both coral and fish data indicate a reduction from 2006 to 2013, although no relevant strong statistically significant correlations were found.
The analysis of the presently available datasets, together with the benthic habitat maps, could not verify or support the interviewees’ assumptions of better fish biodiversity in the Southern islands. Despite the increasing coral cover trend towards South, which could provide larger ecosystem availability, fish numbers shows a decreasing trend in that direction. Moreover, distance to the main fishing harbor doesn’t correlate with fish biodiversity indicators.
The mismatch between local perception and the collected data supports the value of spatial analysis for conservation purposes. Management efforts, currently guided by the above mentioned perceptions and conditioned by escalating costs, focus both mitigation measures and further research mostly on the northern, closer islands. This is likely to perpetuate the current lack of information about a significant portion of the PSEPA, and with it the possibility to uncover causes of decreasing biodiversity in the region. For example, the effects of the maritime mining activity close to Caldeira, likely to have significant impacts on the coral reef system, are still unknown.
Monitoring, planning and mitigation measures concerning local biodiversity loss would greatly benefit from an integrated approach, namely by the inclusion of remote sensing techniques and products. With their inclusion, future field efforts could be leveraged into better, more efficient, outcomes, and lead to the production of higher quality supporting documentation for PSEPA’s planning and management work
ACKNOWLEDGEMENTS
The authors wish to acknowledge ESA’s G-ECO-MON project for technical support and data; WWF-Germany for development of the research project; Lund University for the funding; WWF-Mozambique for field support; and the interview participants in PSEPA.
REFERENCES
Andréfouët, S. (2008). "Coral reef habitat mapping using remote sensing: A user vs producer perspective. implications for research, management and capacity building." Journal of Spatial Science 53(1): 113-129.
Andréfouët, S. (2012). Mozambique Channel Coral Reef Habitat Mapping - Report to Collecte Localisation Satellites, IRD.
Capolsini, P., et al. (2003). "A comparison of Landsat ETM+, SPOT HRV, Ikonos, ASTER, and airborne MASTER data for coral reef habitat mapping in South Pacific islands." Canadian Journal of Remote Sensing 29(2): 187-200.
CBD (2013). Report of the Southern Indian Ocean Regional Workshop to Facilitate the Description of Ecologically or Biologically Significant Marine Areas, UNEP.
Celliers, L. and M. H. Schleyer (2000). A survey of the coral reefs at Caldeira Island in the Segundas Archipelago, Mozambique, and an assessment of the marine environmental impacts of a proposed heavy minerals mine. Durban, SAAMBR: 1 - 18.
de Abreu, D. C., et al. (2008). Levantamento Rápido no Arquipélago das Primeiras e Segundas, Contribuição para o Estabelecimento de um Programa de Monitoria. Maputo, WWF-Mozambique: 137-162.
Delacy, C., et al. (2014). Moving Sushi - East African Marine Transect Expedition 2012/2013, www.movingsushi.com.
Hedley, J., et al. (2005). "Simple and robust removal of sun glint for mapping shallow-water benthos." International Journal of Remote Sensing 26: 2107-2112.
Hoguane, A. M. (2007). "Perfil Diagnóstico da Zona Costeira de Moçambique." Revista de Gestão Costeira Integrada 7(1): 69-82.
Knudby, A., et al. (2010). "Predictive mapping of reef fish species richness, diversity and biomass in Zanzibar using IKONOS imagery and machine-learning techniques." Remote Sensing of Environment 114(6): 1230-1241.
Lyzenga, D. R. (1978). "Passive remote sensing techniques for mapping water depth and bottom features." Applied Optics 17: 379–383.
Lyzenga, D. R. (1981). "Remote sensing of bottom reflectance and water attenuation parameters in shallow water using aircraft and Landsat data." International Journal of Remote Sensing 2: 71-82.
Mumby, P. J. and A. R. Harborne (1999). "Development of a systematic classification scheme of marine habitats to facilitate regional management and mapping of Caribbean coral reefs." Biological Conservation 88: 155-163.
Pereira, M. A. M. and M. J. Rodrigues (2014). The Coral Reefs of Primeiras and Segundas Islands: 2010 Rapid Assessment of the Ecological Status and Resilience - Draft Version, WWF.
Pereira, M. A. M. and E. J. S. Videira (2007). Rapid assessment of the coralline and ichthyological communities of the coral reefs of the Primeiras and Segundas Archipelago (Nampula and Zambezia provinces). Maputo.
Roelfsema, C., et al. (2013). "Mapping coral reefs at reef to reef-system scales, 10s–1000s km2, using object-based image analysis." International Journal of Remote Sensing 34(18): 6367-6388.
Rohmann, S. O. (2008). A Classification Scheme for Mapping the Shallow-water Coral Ecosystems of Southern Florida - Version 3.2. Coral Reef Conservation Program, NOAA.
Schleyer, M. H. (1999). A preliminary survey of the coral reefs at selected islands in the Primeiras archipelago, Mozambique. Durban, SAAMBR: 1 - 10.
Services, C. E. (2000). Environmental Impact Assessment of the Kenmare Moma Titanium Minerals Projects in Mozambique - Volume 2: Specialists Reports. Grahamstown, Coastal&Environmental Services: 402-465.
Whittington, M. W. and M. S. Heasman (1997). A rapid assessment of the subtidal habitats and associated commercial fish populations of the Segundas Islands: Santo Antonio and Mafamede Islands. A technical report for the the Institute for the Development of Small-scale Fisheries (IDPPE), Mozambique. . F. Mozambique. Maputo, Society for Environmental Exploration, UK and Ministry for the Co-ordination of Environmental Affairs, Mozambique.