GLOBIL: WWF'S GLOBAL OBSERVATION AND BIODIVERSITY INFORMATION
PORTAL
A. C. Shapiro a, 1*, L. Nijsten b,S. Schmittc, P. Tibaldeschid a
World Wide Fund for Nature (WWF) Germany, Reinhardtstr. 18, 10117 Berlin, Germany - [email protected] b
World Natur Fonds (WWF) Netherlands, Driebergsweg 10, 3708 JB Zeist, Netherlands – [email protected] c
World Wide Fund for Nature (WWF) United Kingdom, Brewery Road, Woking, Surrey GU21 4LL, UK [email protected]
d World Wide Fund for Nature (WWF) Norway, Kristian Augusts gate 7A, 0164 Oslo, Norway - [email protected]
KEY WORDS: GIS, Remote Sensing, Monitoring, Evaluation, Impact, Wildlife, Habitat, Conservation
ABSTRACT:
Despite ever increasing availability of satellite imagery and spatial data, conservation managers, decision makers and planners are often unable to analyze data without special knowledge or software. WWF is bridging this gap by putting extensive spatial data into an easy to use online mapping environment, to allow visualization, manipulation and analysis of large data sets by any user. Consistent, reliable and repeatable ecosystem monitoring information for priority eco-regions is needed to increase transparency in WWF’s global conservation work, to measure conservation impact, and to provide communications with the general public and organization members. Currently, much of this monitoring and evaluation data is isolated, incompatible, or inaccessible and not readily usable or available for those without specialized software or knowledge.
Launched in 2013 by WWF Netherlands and WWF Germany, the Global Observation and Biodiversity Information Portal (GLOBIL) is WWF’s new platform to unite, centralize, standardize and visualize geo-spatial data and information from more than 150 active GIS users worldwide via cloud-based ArcGIS Online. GLOBIL is increasing transparency, providing baseline data for monitoring and evaluation while communicating impacts and conservation successes to the public.
GLOBIL is currently being used in the worldwide marine campaign as an advocacy tool for establishing more marine protected areas, and a monitoring interface to track the progress towards ocean protection goals. In the Kavango-Zambezi (KAZA) Transfrontier Conservation area, local partners are using the platform to monitor land cover changes, barriers to species migrations, potential human-wildlife conflict and local conservation impacts in vast wildlife corridor. In East Africa, an early warning system is providing conservation practitioners with real-time alerts of threats particularly to protected areas and World Heritage Sites by industrial extractive activities. And for globally consistent baseline ecosystem monitoring, MODIS-derived data are being combined with local information to provide visible advocacy for conservation. As GLOBIL is built up through the WWF network, the worldwide organization is able to provide open access to its data on biodiversity and remote sensing, spatial analysis and projects to support goal setting, monitoring and evaluation, and fundraising activities.
1
* Corresponding author.
1. INTRODUCTION
1.1 Conservation on a global scale
The World Wide Fund for Nature (WWF) is one of the largest international conservation organizations, comprised of a global network with more than 5,000 employees located in more than 100 countries across the world. WWF is united by a single mission: to stop the degradation of the planet's natural environment and build a future in which humans live in harmony with nature. Two major pillars underlie WWF’s strategy: namely conservation of biodiversity in critical places, and reduction of the human footprint, or negative impacts of human activity.
As WWF’s activities are largely supported by private and public donors, it is important that this conservation work be transparent and adequately monitored and evaluated. WWF has been criticized in recent years over its conservation impacts, and new efforts are underway to showcase activities and
outcomes of investments and projects. As WWF is truly a network, the Global Observation and Biodiversity Information Portal, (GLOBIL - http://globil.panda.org) was launched in 2013 to centralize and mobilize geo-spatial data from around the organization for monitoring and evaluation, assessment of ecosystem status and provide an outlet for public communications and marketing.
WWF hosts a wide range of spatial data, and putting this data in a useable form on the internet increases not only visibility but uptake and integration of valuable conservation related datasets, which encourages other organizations to acknowledge rapidyle declining biodiversity and vulnerable ecosystems. Additionally, this portal plays a role in assessing global data sets to align with Convention on Biological Diversity (CBD) indicators and targets which are also relevant to WWF’s work (Leadley et al. 2014). Monitoring biodiversity and the impacts and outcomes of conservation projects at national, trans-boundary and global levels is an essential challenge for all conservation organizations supporting government efforts and the NGO and The International Archives of the Photogrammetry, Remote Sensing and Spatial Information Sciences, Volume XL-7/W3, 2015
36th International Symposium on Remote Sensing of Environment, 11–15 May 2015, Berlin, Germany
This contribution has been peer-reviewed.
science community has been developing appropriate planning and monitoring methods (Kapos et al. 2008; Mascia et al. 2014).
Figure 1. the GLOBIL public web map gallery
The GLOBIL platform is a major effort to expose WWF’s data holdings and increase transparency in conservation planning and execution of projects. GLOBIL lets the public know where WWF is working, why, and what are the outcomes.
1.2 Marine Protected Areas Action Network
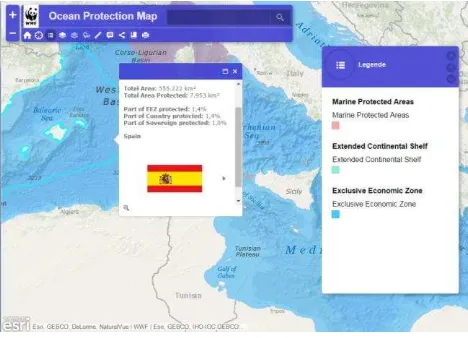
The establishment of marine protected areas (MPAs) has a significant spatial component. Protection of Marine habitat is currently far below the set policy targets and still in its early days compared to terrestrial protection. A combination of economic use of the marine environment and to be protected habitats is a challenging geo-spatial puzzle. GLOBIL helps by mapping existing MPAs and supporting work within the complex legal framework in the marine realm. GLOBIL generates real-time scorecards that show how jurisdictions are advancing on the achievement of policy targets.
Figure 2. Ocean Protection Map allows users to query how much of any country’s marine territory is protected
With regard to marine spatial planning, GLOBIL contains layers and tools on economic use, habitat and species richness. These tools help determine which areas are most important for conservation and MPA establishment. This data is accessible to anyone, allowing the easy manipulation and querying of a large,
complicated dataset which normally requires long download time and processing and technical knowledge and software.
1.3 Kavango-Zambezi Impact Monitoring
The Kavango-Zambezi trans-frontier conservation area (KAZA TFCA) is a vast ecosystem straddling the borders of Namibia, Angola, Zambia, Zimbabwe and Botswana which is the target for sustainable development programs. WWF has been supporting local partners in various conservation efforts in the region, notably by monitoring species populations and their movements over international boundaries. A complex monitoring system for managing and evaluating efforts and conservation impacts in all five countries has been established by the donor agencies and includes data collection on wildlife populations, eco-tourism operations and socio-economic indicators is underway.
In 2014, WWF supported the development of the first KAZA-wide land cover map, derived from Landsat imagery at 30m resolution. This land cover and land use map comprises more than 10 categories relevant for important wildlife habitat and helps KAZA assess a majority of the required indicators for project evaluation. This map also provides the basis for conservation planning and wildlife corridor conservation and will be updated over time.
Figure 3. the KAZA web map summarized land cover and other data in a series of monitoring landscapes.
Previously, the access and manipulation of a land cover map would require specialized software and training. GLOBIL is being used to centralize all data collected from specific monitoring landscapes online, and enable managers and decision makers to visualize, manipulate and interact with monitoring data for project reporting and planning. The KAZA monitoring system in GLOBIL links to live data shared from partner organizations through web services, and combines them with remotely sensed land cover data, local data collections and more, also reducing the effort often required to download data and share it in areas with limited bandwidth. The KAZA monitoring system brings various datasets directly into the hands of project managers. Finally, data collection apps are actively being developed to allow data upload from the field with a mobile device, allowing conservation activities to be coordinated seamlessly across borders, without loss of data. The International Archives of the Photogrammetry, Remote Sensing and Spatial Information Sciences, Volume XL-7/W3, 2015
36th International Symposium on Remote Sensing of Environment, 11–15 May 2015, Berlin, Germany
This contribution has been peer-reviewed.
1.4 Africa Land Use Planning and Early Warning System – ALES
Increasing demand for commodities has made Africa a hot prospect for industrial expansion. Activities in the extractive industries such as mining, oil and gas is occurring at an increasing pace. This boom is driving unprecedented expansion of infrastructure into sparsely populated regions that will require heavy infrastructure and large settled workforces (Weng et al. 2013). All these developments will have a direct or indirect impact on WWF priority areas and other ecologically important regions.
A major gap in conservation intervention is the lack of easily available and early intelligence on major developments, their associated environmental and social risks, as well as long-term development scenarios. The Africa Land use Planning and Early Warning System (ALES) aims at filling this gap by integrating into GLOBIL real-time environmental and development data. This allows a user to visualize the extent of developments over ecological areas of interest, understand their environmental and social risk and find the companies behind it. In addition, ALES also integrates long-term development scenarios, as well climate change data in order to visualize the extent of future development and Climate change impacts in WWF priority areas. ALES is a new platform hosting up to date spatially explicit data, and for some layers near-real time data on conservation interests, sensitive areas, developments and the associated risks from new development projects in Africa. The risk of all new development projects is evaluated for WWF offices and partners in order to help engagement in the development sector.
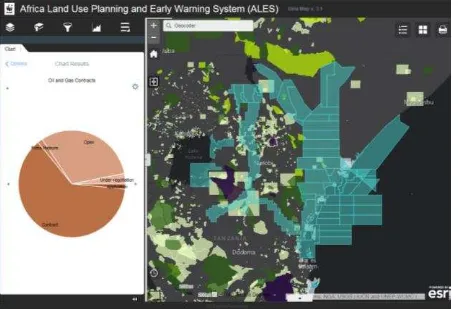
Figure 4. ALES provides many interactive features to help determine overlaps of extractive industrry concessions and
conservation areas
ALES focuses on four major development sectors including extractive industries (oil and gas and mining), forestry, agro-industry and infrastructure. This platform helps WWF and partners in three ways; (i) real time data allow to monitor developments in order to engage at an early stage at the level of the government and the company (ii) by overlaying development scenarios and their associated risks over key biodiversity areas, WWF can propose integrated land use plans and related policies and (iii) the ability to find the company behind a specific development allows to engage at the investor’s level e.g. financial institutions outside the country of interest. Several key features include online analysis of overlapping areas, early warning of function on land use change, interactive
swiping and animation of time series enabled data, without the need for special software.
Using ALES, WWF and partners can engage at an early stage in the development process by reviewing the Environmental Impact Assessment (EIA). WWF will also be able to propose concrete policy recommendations such as Strategic Environmental Assessments (SEA) for the management of specific areas. Finally, WWF staff can easily produce map outputs, query, interact and evaluate risk in various landscapes and address conservation interventions, policy recommendations accordingly.
1.5 Global Program Framework Reporting
In order to effectively meet conservation goals, WWF actively monitors a series of indicators to measure progress and impacts of conservation projects towards biodiversity goals, which are similar to Aichi targets defined by the Secretariat of the Convention on Biological Diversity (Leadley et al. 2014). This work includes compiling information available from global data-sets along with satellite-derived information, combined with data collected locally by WWF. For several global-scale indicators, WWF has acquired annual best-pixel MODIS composites from SarVision LLC for baseline mapping and monitoring. These are 250m resolution cloud-free images of all WWF priority ecoregions, allowing consistent measurement of natural forest cover and fragmentation consistently over time.
Figure 5. Deforestation assessment in Amazon (forest: green; deforestation: red) from MODIS composite
Combining these satellite-derived data with other indicators, such as protected areas coverage, management effectiveness or wildlife counts, GLOBIL will provide a comprehensive view of projects, and conservation impacts and will facilitate reporting at the global level. Additionally this data will be published alongside species information from local monitoring and other sources such as the Living Planet Index (Loh et al., 2005). The interactive online system will support all manners of reports and analysis, allowing monitoring and evaluation programs to perform their own data analysis without specialized software or knowledge.
The International Archives of the Photogrammetry, Remote Sensing and Spatial Information Sciences, Volume XL-7/W3, 2015 36th International Symposium on Remote Sensing of Environment, 11–15 May 2015, Berlin, Germany
This contribution has been peer-reviewed.
2. CONCLUSIONS
2.1 Conservation in the cloud
As ecosystems worldwide degrade due to human impacts, climate change and other large scale threats, it is more crucial than ever for conservation organizations such as WWF to increase transparency and showcase efforts and both positive and negative impacts. First, for donors and members who need to see where investments are going and under what context; and second, for effective monitoring and evaluation, and project reporting. More often, project impacts are falsely correlated with causes which are not spatially correlated, due to misaligned scale or extent. The reach of projects and their investments need to be openly communicated and spatially correlated to correlate potential outcomes and impacts. This also supports more focused conservation intervention and improved project planning.
The GLOBIL platform has allowed WWF to open its spatial databases and information to staff, members and the public, allowing for an improved communications, reporting and strategic planning. This spatial context translates to greater conservation impacts, though refined project planning and efficient targeting through a more informed context through spatial data. GLOBIL allows anyone with an internet connection to work with spatial data from any source, which ultimately supports knowledgeable and transparent conservation activities. Conservation activities can now be planned and monitored in the cloud, in real-time.
This public sharing of spatial data in an interactive manner should encourage other organizations, research institutions to follow suit. At the rate of current biodiversity loss, technological barriers and inaccessible data should no longer limit conservation activities. The growth of web services allows improved data sharing, allowing data holders to protect and manage how their data is being used. A platform such as GLOBIL can facilitate access to what are soon to be overwhelming data streams. This spatial information is an essential tool to inform and target conservation resources to ensure that global ecosystem thrive with natural biodiversity and resources for human livelihoods.
ACKNOWLEDGEMENTS
WWF would like to acknowledge ESRI’s continued support for GIS through their conservation grant program.
REFERENCES
Kapos, V. et al., 2008. Calibrating conservation: new tools for measuring success. Conservation Letters, 1, pp.155–164. Available at: http://doi.wiley.com/10.1111/j.1755-263X.2008.00025.x.
Leadley, P., Krug, C. & Alkemade, R., 2014. Progress towards the Aichi Biodiversity Targets: an assessment of biodiversity trends, policy scenarios and key actions. , 4(78). Available at:
http://espace.library.uq.edu.au/view/UQ:344577 [Accessed March 23, 2015].
Mascia, M.B. et al., 2014. Commonalities and
complementarities among approaches to conservation monitoring and evaluation. Biological Conservation, 169, pp.258–267.
Weng, L. et al., 2013. Mineral industries, growth corridors and agricultural development in Africa. Global Food Security, 2(3), pp.195–202. Available at:
http://linkinghub.elsevier.com/retrieve/pii/S22119124130 00357 [Accessed March 23, 2015].
The International Archives of the Photogrammetry, Remote Sensing and Spatial Information Sciences, Volume XL-7/W3, 2015 36th International Symposium on Remote Sensing of Environment, 11–15 May 2015, Berlin, Germany
This contribution has been peer-reviewed.