HIGH TEMPORAL RESOLUTION PERMAFROST MONITORING USING A MULTIPLE
STACK INSAR TECHNIQUE
J. Eppler a,* , M. Kubanski a, J. Sharma a, J. Busler a
a
MDA Systems Ltd., 13800 Commerce Parkway, Richmond, British Columbia, Canada – [email protected]
KEY WORDS: InSAR, Permafrost, Infrastructure Monitoring, Deformation Monitoring
ABSTRACT:
The combined effect of climate change and accelerated economic development in Northern regions increases the threat of permafrost related surface deformation to buildings and transportation infrastructure. Satellite based InSAR provides a means for monitoring infrastructure that may be both remote and spatially extensive. However, permafrost poses challenges for InSAR monitoring due to the complex temporal deformation patterns caused by both seasonal active layer fluctuations and long-term changes in permafrost thickness. These dynamics suggest a need for increasing the temporal resolution of multi-temporal InSAR methods. To address this issue we have developed a method that combines and jointly processes two or more same side geometry InSAR stacks to provide a high-temporal resolution estimate of surface deformation. The method allows for combining stacks from more than a single SAR sensor and for a combination of frequency bands.
Data for this work have been collected and analysed for an area near the community of Umiujaq, Quebec in Northern Canada and include scenes from RADARSAT-2, TerraSAR-X and COSMO-SkyMed. Multiple stack based surface deformation estimates are compared for several cases including results from the three sensors individually and for all sensors combined. The test cases show substantially similar surface deformation results which correlate well with surficial geology. The best spatial coverage of coherent targets was achieved when data from all sensors were combined.
The proposed multiple stack method is demonstrated to improve the estimation of surface deformation in permafrost affected areas and shows potential for deriving InSAR based permafrost classification maps to aid in the monitoring of Northern infrastructure.
1. INTRODUCTION
Permafrost areas are potentially prone to both seasonal and long term surface deformation due to local changes in the ground ice profile. Sustained surface deformation of sufficient magnitude may lead to damage to infrastructure such as roads and buildings.
SAR Interferometry (InSAR) is a method that can measure surface deformation at regular intervals and high spatial resolution on an ongoing basis over extended areas of 10’s to 1000’s of km2 (Massonnet et al., 1993) InSAR is therefore potentially well suited for monitoring permafrost affected areas including direct monitoring of affected infrastructure.
Permafrost areas can have complex spatio-temporal deformation patterns due to the combined effects of seasonal active layer motion and long term changes in the permafrost state. InSAR based surface deformation monitoring requires sufficient temporal sampling to unambiguously characterize such patterns. This requirement is made more difficult by the fact that permafrost affected areas experience significant seasonal decorrelation due to winter snow cover and subsequent melt related surface erosion.
We have recently developed a method, termed Multi-Track Homogenous Distributed Scatterer (HDS)-InSAR for jointly processing multiple InSAR data stacks in order to significantly increase the temporal resolution and robustness of deformation estimates.
Recent years have seen an increase in the number of satellite based SAR sensors which include C-, L- and X-band systems. While these systems may be used individually to monitor surface deformation, the potential exists to use their data in combination to provide a multi-sensor monitoring solution.
The goal of this paper is to compare the utility of Multi-Track HDS-InSAR permafrost surface deformation monitoring using C- and X-band SAR data both individually (multiple stacks from the same sensor) and in combination (multiple stacks combining C- and X-band data).
Section 2 introduces the Multi-Track HDS-InSAR method used to derive surface deformations estimates from multiple data stacks and also describes a linear model for temporally parameterizing deformation in permafrost areas. Section 3 provides details of the data sources used for this study. Section 4 describes the study results derived from C- and X-band data sources. Conclusions drawn from the results are provided in Section 5.
2. METHOD 2.1 Multiple Stack InSAR Technique
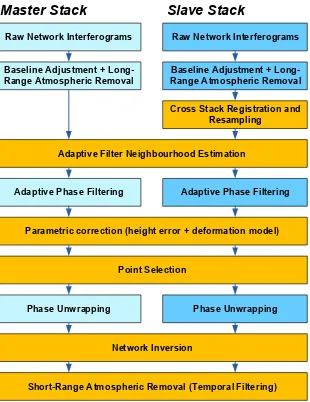
and 2) even if each stack can be successfully processed alone, the intermediate processing steps will not benefit from all available joint information. There are several steps in the HDS-InSAR (Rabus, et al, 2012) processing sequence that benefit from having higher temporal sampling. By processing the stacks jointly, these benefits may be realized throughout the processing sequence and not just in the final result. Figure 1 shows the Multi-Track HDS-InSAR processing chain and highlights the steps that benefit from joint processing.
Of particular note is the adaptive multi-looking neighbourhood estimation step. HDS-InSAR uses comparisons of per target temporal amplitude statistics in order to form local adaptive filtering neighbourhoods used for multi-looking (Parizzi & Brcic, 2011). These represent the estimated boundaries of distributed scatterers with homogenous amplitude statistics. Multi-Track HDS-InSAR requires that the neighbourhoods computed per stack be spatially correlated with each other to ensure boundaries are preserved during spatial filtering.
Figure 1. Multi-Track HDS-InSAR processing flowchart. Joint processing steps are shown in orange.
2.2 Seasonal Component Modelling
A linear temporal component model was implemented in order to separate seasonal deformation from long term deformation trends. Seasonal deformation due to the annual freeze/thaw cycle of the active layer can be modelled using the Stefan’s equation and available temperature history data as shown in (Liu et al, 2012). The implemented linear deformation model incorporates both a seasonal deformation template derived from the ambient mean daily air temperature history and a long term linear component. However, the monitoring period for this study corresponds to a single thaw season over which there is significant correlation between the linear and seasonal components. For this reason, the model was limited solely to the seasonal component. Figure 2 shows an example of multi-season air temperature history and the derived multi-seasonal deformation template.
Figure 2. Example of a mean temperature history and derived active layer deformation template.
3. STUDY DATA
This study analyses multiple InSAR data stacks acquired over the coastal community of Umiujaq, Quebec which is situated in Northern Canada in a region of sporadic permafrost. The Umiujaq site was selected and same side C- and X-band stacks were obtained using three satellite systems: RADARSAT-2, TerraSAR-X and COSMO-SkyMed courtesy of science and application development programs within the Canadian Space Agency (CSA), the German Aerospace Centre (DLR) and the Italian Space Agency (ASI). Also, a surficial geology map of the area and other in-situ and site information were made available courtesy of our collaboration with University of Laval Centre de Études Nordiques (CEN). Table 1 provides a summary of the data stacks used. For the purposes of this study the data stacks were selected such that they all span for COSMO-SkyMed. The average temporal sampling combining the three RADARSAT-2 stacks is 8.1 days, 6.0 days for the TerraSAR-X stacks, 5.1 days for COSMO-SkyMed, and 2.4 days combining all stacks and sensors.
4. RESULTS 4.1 Adaptive Multi-looking Neighbourhoods
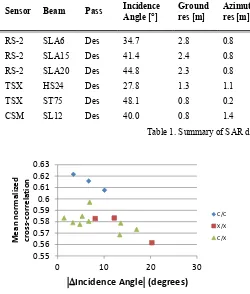
All Umiujaq area data stacks were registered and resampled to the same geometry as the RADARSAT-2 SLA15 stack. Adaptive multi-looking neighbourhoods were computed for each spatial sample within each stack with a maximum extent set to 7x7 samples in range-azimuth. The normalized cross-correlation coefficient was computed for each neighbourhood for each of the 15 possible pairwise combinations of the six data stacks. The mean cross-correlation value on the [0, 1] interval was computed for each pairwise combination. These are shown in Figure 3 plotted against the incidence angle difference for each stack pair. C/C-, C/X- and X/X-band pairs are plotted with different symbols. The plot shows a linear relationship between normalized cross correlation and incidence angle difference for same band stack pairs. Pairs with more similar incidence angles have higher neighbourhood correlations which is expected since stacks with similar incidence angles view distributed scatterers from similar geometries. It also shows that the cross-band (C/X) stack pairs have correlations below this trend for low incidence angle differences. The difference corresponds to the same correlation decrease as observed for ~10 degree incidence angle difference in same-band stack combinations.
Raw Network Interferograms
Baseline Adjustment + Long-Range Atmospheric Removal
Adaptive Filter Neighbourhood Estimation
Adaptive Phase Filtering
Parametric correction (height error + deformation model)
Sensor Beam Pass Incidence
[km] Scenes Start/End dates
RS-2 SLA6 Des 34.7 2.8 0.8 18x8 5 2014/07 – 2014/10
Table 1. Summary of SAR data stacks used in study.
Figure 3. Stack-to-stack cross correlation of adaptive multi-looking neighbourhoods vs incidence difference.
4.2 Temporal Decorrelation
The temporal decorrelation of the RADARSAT-2, TerraSAR-X and COSMO-SkyMed data were examined to determine the relative differences between C-band and X-band for the Umiujaq area of interest which consists of sparsely vegetated tundra. Potential ice bearing areas corresponding to the absence of surficial rock are of particular interest for permafrost monitoring. Therefore a mask corresponding to known areas of surficial rock was generated based on the available surficial geology map and remapped to the geometry of each data stack to exclude areas of surficial rock. Spatial coherence was then estimated over a rectangular window. In order to minimize coherence estimation bias (Touzi et al, 1999), a relatively large window of 21x21 was used for the lowest resolution stack and the windows for all other stacks were matched to have the same ground projected footprint. The resulting mean coherence values per processed interferogram are shown in Figure 4 plotted against temporal baseline for the three sensors. Per sensor trend curves were computed using the three parameter coherence model described in (Morishita & Hanssen, 2015) and are superimposed on the figure. The trends show similar decorrelation behaviour for both TerraSAR-X and COSMO-SkyMed and that the coherence values for RADARSAT-2 are consistently higher than for the X-band sensors over a range of temporal baselines. The X-band models diverge for short temporal baselines since the minimum repeat period of TerraSAR-X is 11 days, and therefore there is no data to constrain the model for temporal baselines below this value.
Figure 4. Sensor comparison of temporal decorrelation curves for non-rock areas. Solid curves correspond to coherence model
fit to the estimates. corresponds to a demonstration of the mixed-band concept and includes all data from all three sensors.
Test Case Stacks
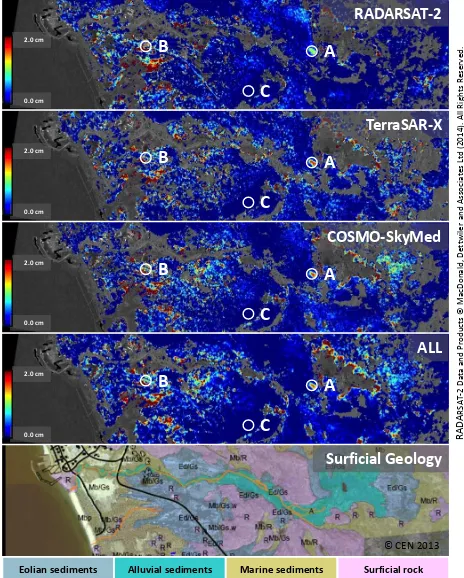
Figure 5. Multi-Track HDS-InSAR derived vertical seasonal deformation magnitude maps overlaid on mean RADARSAT-2 amplitude image for the four test cases (top four frames); corresponding surficial geology map courtesy, University of Laval Centre
The studied time period of June to October represents a typical snow free season in Umiujaq and corresponds primarily to the active layer thaw phase. Deformation due to active layer thaw is expected to be approximately linear during this period and therefore not unambiguously separable from long-term deformation. For this reason only a single component (seasonal motion) model was fit to the deformation estimates. Figure 5 shows the vertically projected seasonal deformation magnitude maps geocoded to north-up for the four test cases along with a surficial geology map of the same area.
The seasonal deformation maps shown only render the set of coherent targets. All four seasonal deformation maps show substantially similar spatial coverage of coherent targets with the ALL test case having better coverage than the three single sensor test cases. Increased coverage is visible e.g. south of point (B) where point density is higher for ALL in the less coherent areas. All four maps also show substantially similar spatial deformation patterns with similar magnitudes although some difference can be observed between the four test cases.
Comparison with the surficial geology map shows a good degree of correlation between areas of low seasonal deformation magnitude and areas of surficial rock. Incoherent areas correlate well with areas of marine and alluvial sediments. In the area immediately west of the airport road (west of point (B) in Figure 5) there is reasonable correlation between marine sediments and higher seasonal deformation magnitudes
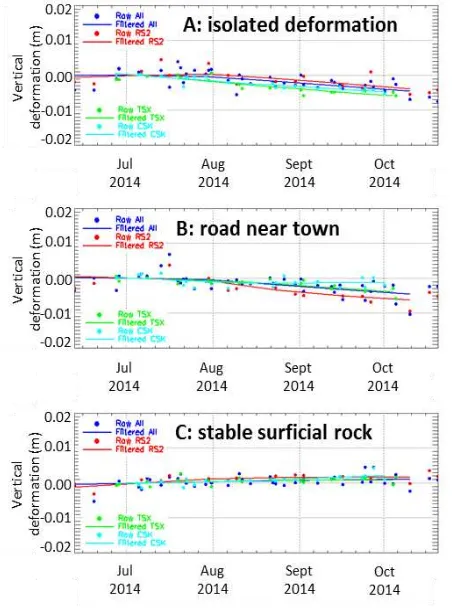
Figure 6 shows sample time series plots for the three points of interest highlighted in Figure 5. Each plot includes traces for all four studied cases.
Figure 6. Example deformation time series for the four test cases. Spatial locations of A, B and C are shown on Figure 5.
For points (A) and (C) the four cases show substantially similar trends. However for point (B) corresponding to the airport road, the rate of estimated subsidence varies somewhat between the four cases.
5. CONCLUSIONS
Multi-Track HDS-InSAR was introduced as a method to jointly process two or more same-side interferometric stacks to generate multi-temporal surface deformation estimates even if each individual stack contains too few scenes for conventional single-stack multi-temporal methods.
A total of six data stacks from RADARSAT-2, TerraSAR-X, and COSMO-SkyMed over the community of Umiujaq, Quebec, Canada were studied to compare the utility of Multi-Track HDS-InSAR based permafrost monitoring with these sensors.
The stack-to-stack correlation of adaptive multi-looking neighbourhoods was examined with respect to stack-wise incidence angle difference and whether combined stacks are from the same radar band. The correlation magnitude was found to decrease linearly with increasing incidence angle separation. The observed decrease in correlation for cross-band stacks was found to be similar in magnitude to the decrease occurring with 10 degrees of incidence angle separation.
Temporal decorrelation for the three sensors was examined for areas without surficial rock. RADARSAT-2 (C-band) with its longer wavelength was found to have consistently higher coherence over the studied 100 day range of temporal baselines compared to TerraSAR-X and COSMO-SkyMed (both X-band) which were found to have similar coherences levels to each other.
Multi-Track HDS-InSAR was run once for each of the three sensors, including all stacks for each sensor in these cases and was also run once for all six stacks combined. These data spanned a five month period corresponding to a single thaw season. Substantially similar results were shown for all four test cases indicating that Multi-Track HDS-InSAR can be used effectively for permafrost deformation monitoring using either C- or X- band sensors. Some localized differences between the four test cases were observed. These may be due to some combination of incidence angle variation combined with horizontal deformation, uncompensated atmospheric phase and local phase unwrapping errors. The Multi-Track method could be used to provide a higher temporal resolution over longer time spans than the one used in this study to allow for more accurate characterization of seasonal and/or nonlinear deformation patterns.
The all-stacks test case composed of C- and X-band data provided the best spatial coverage of coherent targets with increased point densities in several regions of the seasonal deformation magnitude map. This demonstrates the utility of combining stacks from differing radar bands for Multi-Track HDS InSAR deformation monitoring.
ACKNOWLEDGEMENTS
TerraSAR-X data has been provided by the DLR (proposals LAN2045 and LAN2358). COSMO-SkyMed data has been provided by the ASI (project 2867).
We gratefully acknowledge our project partner Dr. Michel Allard and his team at the University of Laval Centre de Études Nordiques for their permafrost expertise and Umiujaq site knowledge including the referenced surficial geology map.
REFERENCES
Liu, L., Schaefer, K., Zhang, T., & Wahr, J., 2012. Estimating 1992–2000 average active layer thickness on the Alaskan North Slope from remotely sensed surface subsidence. Journal of Geophysical Research: Earth Surface (2003–2012), 117(F1).
Massonnet, D., Rossi. M., Carmona. C., Adragna, F., Peltzer, G., Feigl, K., & Rabaute, T., 1993. The displacement field of the Landers earthquake mapped by radar interferometry, Nature, 364(6433), 138-142.
Morishita, Y., & Hanssen, R., 2015. Temporal Decorrelation in L-, C-, and X-band Satellite Radar Interferometry for Pasture on Drained Peat Soils. IEEE Transactions on Geoscience and Remote Sensing, 53(2), 1096-1104.
Parizzi, A. & Brcic, R., 2011. Adaptive InSAR Stack Multilooking Exploiting Amplitude Statistics: A Comparison Between Different Techniques and Practical Results, IEEE Geoscience and Remote Sensing Letters, 8(3), 441-445.
Rabus, B., Eppler, J., Sharma, J., & Busler, J., 2012. Tunnel monitoring with an advanced InSAR technique. Proceedings of SPIE, 8361, 83611F–83611F–10.