THE APPLICATION OF MODIFIED NORMALIZED DIFFERENCE WATER INDEX BY
LEAF AREA INDEX IN THE RETRIEVAL OF REGIONAL DROUGHT MONITORING
Hong-wei Zhanga,b*, Huai-liang Chena,b
a CMA·Henan Key Laboratory of Agro-meteorological Safeguard and Applied Technique, Zhengzhou 450003, China.
bHenan Meteorological Administration, Zhengzhou 450003, China. –[email protected]
Commission AGRI-3
KEY WORDS: Vegetation Coverage, Relative Leaf Area Index (RLAI), Normalized Difference Water Index (NDWI), Retrieval
ABSTRACT:
The vegetation coverage is one of the important factors that restrict the accuracy of remote sensing retrieval of soil moisture. In order
to effectively improve the accuracy of the remote sensing retrieval of soil moisture and to reduce the impact of vegetation coverage
variation on the retrieval accuracy, the Leaf Area Index (LAI) is introduced to the Normalized Difference Water Index (NDWI) to
greatly improve the accuracy of the soil moisture retrieval. In its application on the regional drought monitoring, the paper uses the
relative LAI from two places which locate in the north and south of Henan Province respectively (Xin Xiang and Zhu Ma Dian) as
indicators. It uses the days after turned-green stage to conduct difference value correction on the Relative Leaf Area Index (RLAL)
of the entire province, so as to acquire the distribution of RLAI of the province’s wheat producing area. After this, the local remote
sensing NDWI will be Modified
MNDWI
=
NDWI
×
RLAI
to acquire the soil moisture distribution status of the entireprovince’s wheat producing area. The result shows that, the Modified Normalized Difference Water Index of LAI which based on
the days after turned-green stage can improve the real time retrieval accuracy of soil moisture under different vegetation coverage.
1. INTRODUCTION
Drought is caused by long-term lack of soil water content
which would affect agriculture, ecology and socio-economy;
it is particularly harmful to food production. Therefore,
scientific research institutes have studied for years on droughts
which affects food production and devoted a great deal of
manpower and material resources on drought monitoring,
forecasting, early warning and assessment; the government
departments have also attached great importance to the
relevant decision.
The studies show that the Normalized Difference Vegetation
Index (NDVI) is widely accepted because it is easy to observe
and use among other remote sensing retrieval indexes of soil
Author: Huai-liang Chen (1967- ), male, from Huixian, Henan, China. His research interests are remote sensing and applied meteorology.Email:[email protected]
* Corresponding author: Hong-Wei Zhang (1966-), male, from Wenxian, Henan, China, whose research interests are remote sensing and applied meteorology. Email:[email protected]
moisture based on the reflectance spectrum. Meanwhile,
NDVI can reflect the variation condition of soil moisture at a
certain depth via the spectrum data variation of the vegetation
index. Therefore, many NDVI-based soil moisture retrieval
indexes are derived from it. Since these indexes can reflect soil
moisture variation via vegetation moisture spectrum variation,
it has theoretical and realistic significance to the development
and variation of droughts.
The previous research results have shown that NDVI is both
conservative and saturated, it cannot reflect the variation status
of soil moisture in real time without any delay (Di, L., et al.,
1994; Kogan, F.N., et al., 1990; Liu, W., et al., 1991). With the
increase of coverage, the saturation of the normalized
which effect on soil moisture retrieval is also increasing
(Peters, A.J., et al., 2002; Unganai, F.N., et al., 1998; Yang, L.,
et al., 1998).
Based on the known knowledge of NDVI, Wang Lei and other
researchers acquired the negative exponential relationship
equation between NDVI and MDPI by comparing their sample
data, which can be used to calculate the MPDI domain value
of 3 kinds of vegetation coverage conditions, namely, dense
vegetation, moderate vegetation, sparse vegetation and bare
ground, thereby improving the soil moisture retrieval accuracy
(Wang Lei, et al., 2006). Liu Wei and other researchers has
combined the polar metric decomposition techniques and
scattering model of vegetation coverage area methods to
estimate the soil moisture variation under the high vegetation
coverage surface(Liu Wei, 2005). Cheng Yu and other
researchers acquired new parameters by introducing the
normalized difference vegetation index to correct the thermal
inertia, which verified that the corrected parameter is
significantly associated with soil moisture content under
different vegetation coverage (Cheng Yu, et al., 2006). Zhou
Peng and other researchers adopted the "water-cloud model",
removing the vegetation influence from the back scattering
radar data and establish the relation between the back
scattering soil coefficient and the soil moisture content. When
conducting surface soil moisture retrieval of cotton, corn and
other crops producing areas on the semi-arid and semi-drought
area, removing the vegetation influence under the moderate
vegetation can achieve a good result (ZHOU Peng, et al.,
2010).
In the study of spectral response of the moisture variation, it is
found out that short wave is more sensitive to moisture than
other spectrum; therefore, the short infrared wave can be used
for soil moisture retrieval. Meanwhile, the study shows that the
vegetation coverage has much impact on the short infrared
wave reflective frequencies (Nemani, R., et al., 1993; Ceccato
P, et al., 2002; Du Xiao, et al., 2004). Based on the
near-infrared and short-near-infrared moisture spectrum variation, Gao
and other researchers constructed the normalized difference
moisture index (NDWI) in real-time retrieval of soil moisture,
which has high retrieval accuracy (Bo-CaiGao, et al., 1996).
The study shows that the normalized difference moisture index
(NDWI) is also under the influence of vegetation coverage
Therefore, it is necessary to investigate the impact of
vegetation index in NDWI retrieval of soil moisture. Besides,
currently there are not many studies on this aspect, especially
studies on the impact of vegetation coverage on retrieval
accuracy in terms of regional soil moisture retrieval. This
paper uses the variation features of leaf area index from two
monitoring points of winter wheat in Henan province during
its turned-green to mature periods and obtains the leaf area
distribution of the main production areas of winter wheat in
Henan province by interpolation method. Finally, it acquires
the modified water index of leaf area index (MNDWI) by
using the remote sensing spectral data to correct the
normalized difference moisture index (NDWI), which will
hopefully increase the retrieval accuracy of soil moisture.
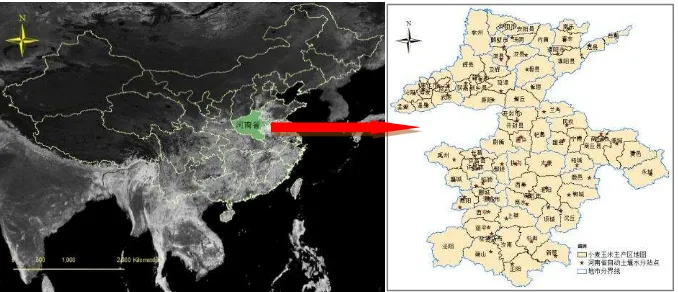
2. RESEARCH AREA AND RESEARCH DATA
This paper selects the main growing areas of winter wheat &
summer maize in Henan province as study areas, including 76
counties (cities) in 11 cities. Henan Province is located in the
mid-east China, down in the middle and lower reaches of the
Yellow River, spanned from 31 ° 23 ′ ~36 ° 22 ' N,110 ° 21 ' ~116 ° 39 ' E. It is situated in the warm temperate and northern
subtropical region with mild climate and clear transitivity. Its
main cultivation methods are wheat-maize rotation.
The average annual precipitation in Henan Province over years
is decreasing from above 1000mm in the rainy area in the
South of Henan to 500~600mm in the semi-arid area in the
northwest, showing an uneven temporal and spatial
distribution of rainfall. The precipitation in wet years is 2.5 to
3.5 times to that in the dry year.
The soil moisture data used in this paper collected from soil
moisture data monitored by the automatic soil moisture station
when the winter wheat had turned green with high coverage,
growing fast and sound from 2012 to 2013. The study has
adopted the average soil moisture value of soil depth of 0 to
30 cm.
The remote sensing data uses the 2012-2013 MODIS
spectroscopic data collected by the satellite station of the
Meteorological Sciences Institute of Henan Province and the
Fig.1 The Sketch Map of Soil Moisture Auto-monitoring Sites Distribution
3. RESEARCH METHOD
3.1 Normalized Moisture Difference Index (NDWI)
The Normalized Difference Vegetation Moisture Index is
promoted by Gao in 1996(Bo-CaiGao, et al., 1996), It takes the
near-infrared RNIR as reference wave band, using the
short-infrared wave band RSWIR for the retrieval of water content
information. The relevant studies show that the normalized
difference water index (NDWI) can more effectively reflect the
water content variation than the normalized difference
vegetation index (NDVI)(Ceccato P, 2002), Formula is as
follows:
SWIR NIR
SWIR NIR
+ R R
-R R
NDWI= (1)
In this formula, RNIR is the reflectance spectrum value of the ground target in the near-infrared band (780-890 nm,
corresponding to the second band of MODIS), RSWIR is the reflectance spectrum value of the ground target in the shorter
infrared (1580-1750nm, corresponding to the seventh band of
MODIS).
3.2 The Normalized Leaf Area Index (The Relative Leaf
Area Index RLAI)
In the study, in order to reduce the impact of different factors on
winter wheat, the leaf area index (LAI) of the winter wheat has
been normalized (Relative Leaf Area Index RLAI) which can be
expressed as:
MAX i
i LAI
LAI =
RLAI (2)
In the formula, RLAIi (Relative Leaf Area Index) is the normalized leaf area index (also called Relative Leaf Area Index)
and i stands for the number of times that the leaf area index has
been observed; LAIMAX stands for the maximum leaf area index. 3.3 The Construction of Modified Normalized Moisture
Difference Index (MNDWI)
After the modified with the relative leaf area index (RLAI), the
normalized difference moisture index (NDWI) is represented as:
i
× +
= RLAI
R R
R R MNDWI
SWIR NIR
SWIR
NIR- (3)
The meaning of the related parameters is the same as (1), (2).
3.4 Determination the RLAI criteria in the South and North
3.4.1 The Calculation and Analysis of Xin Xiang RLAI
To calculate the average number of the leaf area indexes from
the past two years based on the leaf area data collected by Xin
Xiang Monitoring Station from 2012-2013, it uses formula (2)
to calculating RLAI and analyzing them, the results are as follow:
Table 1 The Relative Leaf Area Index (RLAI) in 2012-2013a
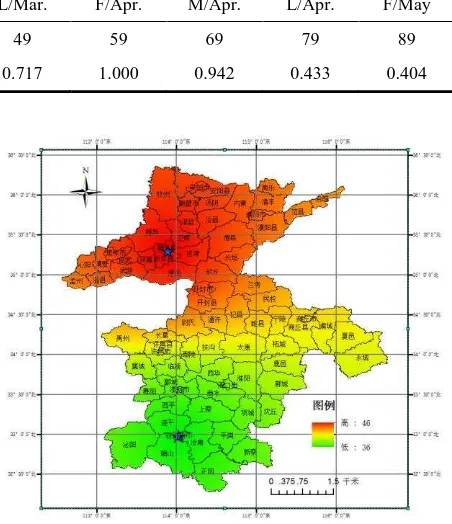
Time M/Feb. L*/Feb. F*/Mar. M/Mar. L/Mar. F/Apr. M/Apr. L/Apr. F/May
days after turn-green 0 8 18 28 39 49 59 69 79
the average RLAI 0.180 0.210 0.345 0.480 0.620 0.880 1.000 0.980 0.795
The leaf area index of the winter wheat is a continuous process
changes according to the period of duration, but with distinct
phases and turning points. In its early stage of growth
(emergence-overwintering), the leave area index increases
slowly, basically showing a linear growth; during the
overwintering, the winter wheat almost stops growing. During
this period, some green leaves withered, the field measurement
became difficult because of the uncertainty of conversion of leaf
area. After the winter wheat has turned green and entered the
parallel stage of nutrition growth and reproductive growth, the
speed of leave area index growth fits the typical Logistic curve
until the winter wheat matures. After turning green, the variation
of the normalized leaf area index RLAI of the winter wheat can
be expressed as:
Where, the RLAI stands for the normalized leaf area index, t for
the days after the stage of turned green, a, b, c, d, e for the
undetermined coefficients.
Using the SAS statistical methods to match the data from
2012-2013, the Logistic formula of days the normalized leaf area index
(RLAI) changing after leaves turning green (t) is:
)
3.4.2 Zhu Ma Dian RLAI Calculation and Analysis
To calculate the average number of the leaf area indexes from
the past two years based on the leaf area data collected by Zhu
Ma Dian Monitoring Station from 2012-2013, it uses formula
(2) to calculating RLAI and analyzing them, the results are as
follow:
Table 2 The Relative Leaf Area Index(RLAI) in 2012-2013a
Time M/Feb. L/Feb. F/Mar. M/Mar. L/Mar. F/Apr. M/Apr. L/Apr. F/May
As can be seen, the maximum value of RLAI in Xin Xiang, Zhu
Ma Dian appeared 55 to 60 days after the winter wheat turned
green (normally, the winter wheat in Xin Xiang turns green
around 20th February and 10th, February in Zhu Ma Dian),
which is the vigorous growth period when the winter wheat
jointing and booting, completely reflects the growing period
features of winter wheat in north and south. Therefore, it is
feasible to using the days after the winter wheat has turned green
as a parameter to conduct RLAI retrieval.
3.4.3 RLAI Distribution and Calculation of the Major
Wheat-Producing Areas in Henan Province
By studying the RLAI of Xin Xiang (north of Henan province)
and Zhu Ma Dian (south of Henan province) monitoring stations,
it can be concluded that the maximum value of LAI in Xin Xiang
appeared around 15th, April and 5th, April in Zhu Ma Dian. The
date of maximum value of south and north has 10 days gap.
Therefore, the regional distribution map of the number of days
after leaves turning green where the maximum value of LAI of
the major winter wheat producing area in Henan Province can be
calculated by the interpolation method.
Figure 2 The distribution map of the number of days of leaves
turning green where the maximum leaf area index appeared
From the distribution map, it can be observed that there is a
difference between the south and the north in terms of the
number of days of leaves turning green where the maximum
value of winter wheat LAI appeared. For the sake of calculation,
34 ° 30' northern latitude is taken as the borderline, the southern
MNDWI calculation and northern Henan uses the RLAI of Xin
Xiang to conduct MNDWI calculation. Meanwhile, its
correlation with the soil moisture content is also studied.
4. VERIFICATION OF THE EFFECT
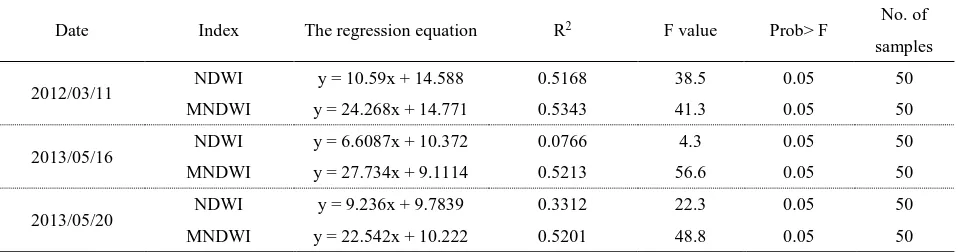
Selecting three days with no clouds & frog infecting in the time
of winter wheat growing from 2012-2013a, namely, March 11,
2012, May 16, 2013 and May 20, 2013 where wheat was in its
vigorous growing period, using the MODIS 1-7 channel
spectroscopic data acquired by ENVI 5.0 from 3 times and
combining the average soil moisture monitoring data collected
from the automatic soil moisture station 10-30 cm, the relevant
analysis is as follows (see table 3).
The analysis shows that, the effect of the modified normalized
difference water index (MNDWI) which has been corrected by
the Leaf Area Index was enhanced under different vegetation
coverage. This is more obviously seen in May when the
vegetation coverage is high.
Table 3 The Comparison Between the Regression Results of NDWI & MNDWI
Date Index The regression equation R2 F value Prob> F No. of
samples
2012/03/11 NDWI y = 10.59x + 14.588 0.5168 38.5 0.05 50
MNDWI y = 24.268x + 14.771 0.5343 41.3 0.05 50
2013/05/16 NDWI y = 6.6087x + 10.372 0.0766 4.3 0.05 50
MNDWI y = 27.734x + 9.1114 0.5213 56.6 0.05 50
2013/05/20 NDWI y = 9.236x + 9.7839 0.3312 22.3 0.05 50
MNDWI y = 22.542x + 10.222 0.5201 48.8 0.05 50
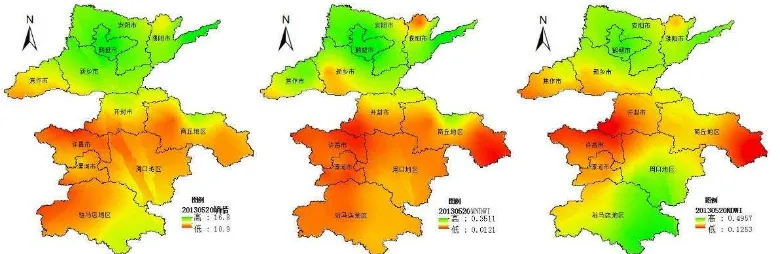
Using ArcGIS10 to make the soil moisture observation in situ,
MNDWI and NDWI into a distribution map, the results are as
Figure 3 The distribution map of soil moisture, MNDWI, NDWI on March 11, 2012, May 16, 2013 and May 20, 2013
The distribution maps shows that, in March 2012, there is less
soil moisture content in northern Henan province, the
distribution of NDWI and MNDWI is consistent with the soil
moisture content, but MNDWI has better effect; in May 2013,
there is less soil moisture content in southern of Henan, the
distribution effect of MNDWI is clearly better than that of
NDWI.
5. CONCLUSIONS AND DISCUSSION
The results show that, NDWI and MNDWI can better reflect the
distribution of soil moisture conditions. But the MNDWI with
correction can effectively reduce the delay of response with the
increase of vegetation coverage, because it has taken the impact
of vegetation coverage on spectrum variation. It can also reduce
the impact of plant saturation on soil moisture retrieval accuracy.
This index can be used for real-time retrieval of soil moisture,
which is important to the monitoring, warning of drought.
However, because the paper only takes two sites of RLAI in
north and south of Henan province to calculate, the
representativeness is not typical enough. This problem can be
solved by increasing the number of monitoring stations on Leaf
Area Index and establishing different regional models to further
improve the retrieval accuracy of the soil moisture of MNDWI.
The accumulated temperature from different sites can also be
used to establish statistical model with Leaf Area Index (LAI) to
acquire the Relative Leaf Area Index (RLAI) from different
regions. In this way, the retrieval accuracy of the regional soil
moisture under different coverage can be effectively improved.
ACKNOWLEDGEMENTS
It is jointly funded by the Twelfth-Five science and technology
support project of the Ministry of Science and Technology
"Study on Key Technologies of Important Agro-meteorological
Disaster Prediction" (2011BAD32B02) and major science and
technology projects of Henan province (121100110900).
REFERENCES
Bo-CaiGao。NDWI—A Normalized Difference Water Index for Remote Sensing of Vegetation Liquid Water From Space[ J ].
Remote Sensing of Environment, 1996, 58:257-266.
Ceccato P ,Flasse S ,Gregoire J M. Designing a Spectral
Index to Estimate Vegetation Water Content from Remote
Sensing Data : Part 2. Validation and applications [ J ] . Remote
Sensing of Environment, 2002 ,82 (2/ 3) :198-207
Ceccato P ,Gobron N ,Flasse S , et al. Designing a
spectral Index to Estimate Vegetation Water Content from
Remote Sensing Data: Part 1, Theoretical approach [ J ] .
Remote Sensing of Environment, 2002, 82 (2/ 3):1882197
Cheng Yu, Chen Fu, Liu Qin Huo. The feasibility study of soil
moisture monitoring based on MODIS data under different
vegetation coverage [j]. Journal of Remote Sensing, 2006, 10 (5):
783-788.
Di, L.,Rundquist, D.C., Han, L., 1994.Modeling
relationships between NDVI and precipitation during growth
cycle. International Journal of Remote Sensing 15 (10):2121– 2136.
Du Xiao , Zhou Yi , Wang Shi-xin, et al. Monitoring
and Spatio-Temporal Evolution Researching on Vegetation Leaf
Water in China [ C] . International Geoscience and Remote
Sensing Symposium (IGARSS) , Anchorage , Alaska ,
Kogan, F.N., 1990. Remote sensing of weather impacts on
vegetation in non-homogeneous areas. International Journal of
Remote Sensing 11 (8):1405–1419.
Liu Wei, Shi Jian Cheng, Wang Jian Ming. The application of
polarimetric decomposition technology in the estimation of soil
moisture variation in the vegetated terrain [j]. Application of
Theories, 2005, (4): 3-6.
Liu, W., Ferreira, A., 1991. Monitoring crop
production regions in the Sao Paulo State of Brazil using
normalized difference vegetation index. Proc. 24th.
International Symposium on Remote Sensing of Environment,
Rio de Janeiro, Brazil, vol. 2, pp. 447–455. 27–31 May.
Nemani, R., Price, L., Running, S.,Goward, S.,
1993. Developing satellite derived estimates of surface moisture
status. Journal of Applied Meteorology 32 (3):548–557.
Peters, A.J., Walter-Shea, E.A., Lei, J.,Vina,
A., Hayes, M., Svoboda, M.R., 2002. Drought
monitoring with NDVI-based standardized vegetation index.
Photogrammetric Engineering and Remote Sensing 65 (1):71– 75.
Unganai, L.S.,Kogan, F.N., 1998. Drought monitoring
and corn yield estimation in Southern Africa from AVHRR data.
Remote Sensing of Environment 63 (3):219–232.
Wang Lei, Li Zhen, and Chen Quan. The application of MPDI
of soil moisture retrieval in the microwave radiometer vegetation
coverage area [j]. Journal of Remote Sensing, 2006, 10 (1):
34-38.
Yang, L.,Wylie, B.K.,Tieszen, L.L., Reed, B.C.,
1998. An analysis of relationships among climate forcing and
time-integrated NDVI of grasslands over the U.S. northern and
central Great Plains. Remote Sensing of Environment 65 (1): 25– 37.
ZHOU Peng, DING Jianli, WANG Fei et al. Retrieval methods
of soil water content in vegetation covering areas based on
multi-source remote sensing data [J], Journal of Remote Sensing, 2010,