DEM EXTRACTION FROM WORLDVIEW-3 STEREO-IMAGES
AND ACCURACY EVALUATION
F. Hu a *, X.M.Gao a, G.Y.Li a, M.Li b
a
Satellite Surveying and Mapping Application Center, National Administration of Surveying, Mapping and Geoinformation, Beijing 100048, China - (huf, gaoxm, lgy)@sasmac.cn
b
National Geomatics Center of China, Beijing 100830, China - [email protected]
Commission I, WG I/4
KEY WORDS: Worldview-3, Stereo-images, DEM Extraction, Accuracy Evaluation, LiDAR Point Cloud
ABSTRACT:
This paper validates the potentials of Worldview-3 satellite images in large scale topographic mapping, by choosing Worldview-3 along-track stereo-images of Yi Mountain area in Shandong province China for DEM extraction and accuracy evaluation. Firstly, eighteen accurate and evenly-distributed GPS points are collected in field and used as GCPs/check points, the image points of which are accurately measured, and also tie points are extracted from image matching; then, the RFM-based block adjustment to compensate the systematic error in image orientation is carried out and the geo-positioning accuracy is calculated and analysed; next, for the two stereo-pairs of the block, DSMs are separately constructed and mosaicked as an entirety, and also the corresponding DEM is subsequently generated; finally, compared with the selected check points from high-precision airborne LiDAR point cloud covering the same test area, the accuracy of the generated DEM with 2-meter grid spacing is evaluated by the maximum (max.), minimum (min.), mean and standard deviation (std.) values of elevation biases. It is demonstrated that, for Worldview-3 stereo-images used in our research, the planimetric accuracy without GCPs is about 2.16 m (mean error) and 0.55 (std. error), which is superior to the nominal value, while the vertical accuracy is about -1.61 m (mean error) and 0.49 m (std. error); with a small amount of GCPs located in the center and four corners of the test area, the systematic error can be well compensated. The std. value of elevation biases between the generated DEM and the 7256 LiDAR check points are about 0.62 m. If considering the potential uncertainties in the image point measurement, stereo matching and also elevation editing, the accuracy of generating DEM from Worldview-3 stereo-images should be more desirable. Judging from the results, Worldview-3 has the potential for 1:5000 or even larger scale mapping application.
* Corresponding author
1. INTRODUCTION
In recent years, the commercial optical satellites with sub-meter high resolution have been developing fast. The performance indexes such as geo-referencing accuracy, mapping capability etc. of high-resolution commercial satellites have a qualitative leap. On August 13th, 2014, DigitalGlobe has launched Worldview-3 (WV-3) which is the inheritance and development of Worldview-2 into orbit. Operating at an altitude of 617 km with an inclination of 97.2° for a maximum orbital period of 97 minutes, WV-3 provides 0.31 m panchromatic resolution, 1.24 m multispectral resolution, 3.7 m short-wave infrared resolution, and 30 m CAVIS resolution. It is the industry’s first multi -payload, super-spectral, high-resolution commercial satellite, and provides significant improvements in image resolution and geo-positioning accuracy. The nominal geo-positioning accuracy without ground control is better than 3.5 m (CE90). The images provided by WV-3 can be used for applications such as mapping, land planning, disaster preparedness/response, exploration, defence and intelligence, visualization and simulation of environments, classification, feature extraction, change detections, soil/vegetative analysis, environmental monitoring, and identification of man-made materials, etc. In virtue of flexible attitude maneuvers, WV-3 has an average revisit time of less than one day, and is able to relocate very
rapidly and to scan the earth in any direction. The agility of the satellite offers the ability to acquire multiple-view images of the same targets along the orbit. This capacity opens the way to various acquisition scenarios matching different applications, e.g. automatically extracting 3-D information over significant land areas from the multiple-view (at least triple) stereo-images, collecting the multiple-strip image of a wide coverage in a single pass, and also acquiring stereo-images for 3-D extraction purposes of a wide coverage by stitched stereo imaging in a single pass.
In recent years, there is an increasing demand for using very high resolution (VHR) commercial satellite images for large scale topographic mapping and digital terrain products generation, and new methodologies have been implemented to improve the quality and accuracy of automatic 3-D processing. One of the predominant features making Worldview series so popular is that they offer the potential to extract high quality DSM/DEM (Digital Surface Model /Digital Elevation Model) products from their stereo-images. Many research works have been done on extracting DSM/DEM from panchromatic stereo-images captured by WV-1, WV-2 and WV-3. To achieve high accuracy elevation extraction results, the previous research works mainly focus on two aspects, one is regarding the geo-positioning accuracy improvement of different mathematic
sensor models such as deterministic models (Capaldo et al., 2012), rational function models (RFMs) (Madani, 1999; Dowman and Dolloff, 2000;Tao and Hu, 2002; Toutin, 2006; Teo ,2011; Poli and Toutin,2012; Toutin et al., 2012), etc.; while the other is on effects of different image matching algorithms, including geometrically-constraint area-based matching, multi-scale area-based applied matching, multiple primitive image matching, semi-global matching (SGM) (Zhang and Grün, 2006; Cheng and Chaapel ,2008; Hirschmüller, 2008; Poli et al., 2009; d’Angelo and Reinartz, 2011) and so on. Generally speaking, the achieved elevation accuracy is relatively at the same level but will to a certain extent vary depending on the base-to-height (B/H) ratio of stereo-images, land cover types and many other factors. More recently in 2015, it is reported that PhotoSat Company Ltd. has generated 0.5 m grid spacing DEM of Southeast California from WV-3 stereo-images, and evaluated the accuracy by comparing with high precision LiDAR elevation grid; it is showed that the derived DEM accuracy of WV-3 is excellent and within 15 cm RMSE, which will be qualified for engineering design, flat terrain monitoring and many other domains.
This study aims at exploring the characteristics of the WV-3 in acquiring wide-coverage stereo-images, and also validating the potentials of WV-3 in high accuracy elevation extraction for large scale topographic mapping, by using WV-3 along-track stereo-images of a mountainous area in Shandong province China, where the airborne LiDAR point cloud is used to verify the quality of the DEM generated. The remainder of the paper is organized as follows. Section 2 depicts the characteristics of WV-3 stereo-images and reference data including ground control points (GCPs), LiDAR point cloud of the test area. Section 3 then reminds the methodology, workflow deployed for DSM/DEM extraction and accuracy evaluation. Section 4 reports the performance results and accuracy analysis. Section 5 goes to the conclusions.
2. DATASET DESCRIPTION 2.1 Test Area
To assess WV-3 accuracy in elevation extraction, a test area is chosen where reliable ground truth is available. It is a mountainous area located around Yi Mountain, South of Linqu County, Weifang City, Shandong Province and spans different environments: residential, semi-rural and forested. The elevation ranges almost from about 150 m to around 1052 m. The area belongs to the temperate monsoon climate and has a high rate of forest coverage with a wide variety of plants. As shown in Figure 1, it covers a size larger than 18 km by 18 km, with the longitude range E118.5001°~E118.6895°, and latitude range N36.1172°~N36.2888°.
Figure 1. Coverage the test area and images
2.2 Image Data
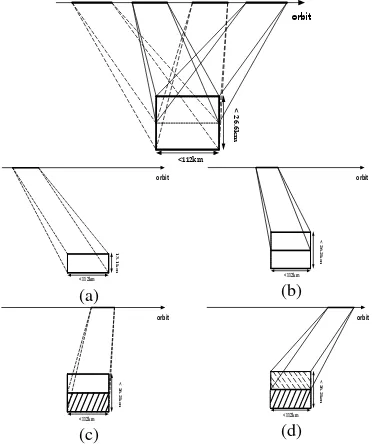
The agility of the Worldview series satellites not only makes the revisit period shortened but also enriches the satellite working mode to a large extent. The agility provided by the CMG devices makes the stereo imaging process flexible. There are primarily two situations for the along-track stereo area collection, i.e. multiple-view stereo and stitched stereo. Both of them utilize the attitude maneuver ability of satellite, the former acquires stereo-images of the same target area from at least triple view angles, while the latter aims at achieving a wide ground coverage by acquisition of several stitched stereo-pairs, alleviating the restriction in swath width of sensor due to the enhancement of spatial resolution. Taking the situation of dual stereo-pairs for instance, the stereo area covering a size of 26.6 km by 112 km at maximum is available. As shown in the figure, there are mainly four imaging periods. After completing a period forward push-broom scanning to attain an image strip (Figure 2 (a)), the satellite moves forward with reverse attitude maneuvers immediately in the pitch direction and meanwhile changes the satellite pointing direction through side swaying, in this way capturing the second image strip (Figure 2(b)) which is adjacent and overlapped with the first one with a translational distance smaller than swath width of sensor; then, with continuous reverse maneuver long the orbit and also a certain angle of side swaying, the satellite carries out a period forward push-broom scanning again over the first strip to form as a stereo-pair (Figure 2(c)); next, the satellite carries out forward push-broom scanning again over the second strip to form as another stereo-pair (Figure 2 (d)); finally, the two stereo-pairs with a certain overlapping area cross the orbit are obtained.
orbit
Figure 2. Demonstration of the stitched stereo imaging mode (the situation of dual stereo-pairs)
Accordingly, the image data of the test area is collected on Nov. 4, 2014, including four images to form as two stereo-pairs. Each stereo-pair consists of a forward-looking image and a backward-looking image. Besides, for the convenience of data storage and management, each image is again divided into several sub-images which can be associated and stitched into integrity by the provided index file in “TIL” format. As listed in table 1, images with ID 23853 and 23956 form a stereo-pair, while
images with ID 23910 and 24008 form another stereo-pair. The two stereo-pairs constitute the image dataset of test area. Each stereo-pair is with asymmetrical mean off-nadir view angles, generating base-to-height (B/H) ratios of about 1.09 and 1.13
Usually, WV-3 image data is distributed at five different levels, i.e. Basic 1B, Basic Stereo Pairs, Standard 2A, Ortho-Ready orthorectification. Also, auxiliary data including ephemeris, attitude, 3rd-order RFM coefficients and etc. of each image is provided as separate files.
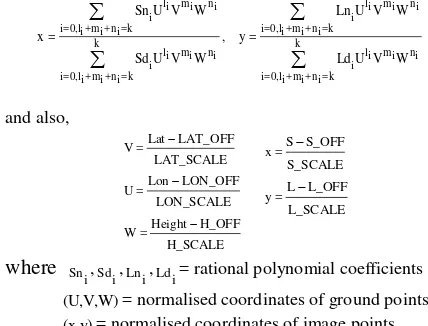
It is well known that the essence of the RFM is to associate the geographic coordinates of a ground point with the pixel coordinates of its corresponding image point, where coordinates of both ground point and image point are normalized between -1 and +-1 so as to ensure the reliability of the parameter resolving process. The RFM has the following fundamental form:
(U,V,W)= normalised coordinates of ground points (x,y)= normalised coordinates of image points
(Lat,Lon,Height)= coordinates of ground points
(S,L)= coordinates of image points
LAT_OFF,LAT_SCALE,LON_OFF,LON_SCALE,H_OFF,H_SCALE
= normalised parameters of the ground point coordinates
S_OFF,S_SCALE,L_OFF,L_SCALE = normalised parameters of an abundant overlapping area in cross-track direction.
2.3 Reference data
GCPs are the basis of high-accuracy image geo-positioning. In test area, eighteen GCPs mainly located around road features and at the house corners are collected by a differential Global Positioning System (dGPS) survey; the 3-D ground accuracy is better than 10 cm. The collected points are also used as independent check points to validate the image orientation accuracy. In addition, elevation reference data is obtained from an airborne LiDAR survey of the test area on September 2015. The elevation accuracy of the LiDAR point cloud checked versus the previous dGPS survey is better than 15 cm RMSE. The coverage of the LiDAR point cloud is over the extent of WV-3 stereo-images, with point interval superior to 2 m (with a mean value of 1.37 m). The reference DEM with grid size of 2 m (as shown in Figure 3) is derived from LiDAR point cloud by data noise filtering, automatic classification and manual editing. The coordinates system is in Gauss-Krüger projection 3 degree zone, Datum WGS84. Aerial images over the same period of this area are also available.
Figure 3. Distribution of GCPs (left) and overview of the reference DEM with color-coded elevations (right)
3. SOLUTION
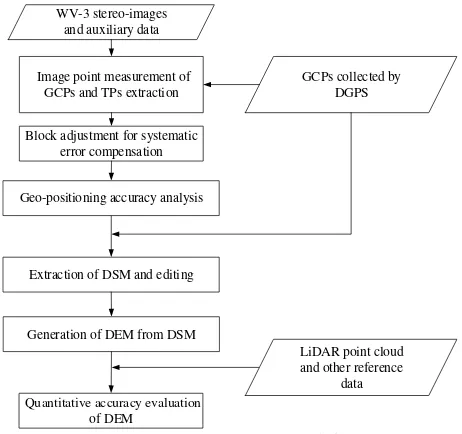
The workflow for DEM extraction from WV-3 stereo-images and accuracy evaluation is demonstrated in Figure 4. The main steps are addressed as follows:
(1) Image point measurement of GCPs and tie points (TPs) extraction. To generate high-accuracy DSM/DEM, GCPs are very essential to systematic error compensation of RFMs to achieve a desirable geo-positioning accuracy. Image point measurement of GCPs is performed semi-automatically, and also, TPs are extracted automatically by image matching of all stereo-pairs, considering the geometric constraints and geometric invariant features.
(2) Block adjustment for systematic error compensation. After GCPs (partially will be used as check points) and TPs are measured and extracted, all images are consolidated into a single group and the systematic error of RFMs is compensated to achieve a better geo-positioning accuracy, based on the image-space two-dimensional (2-D) affine transformation parameters and iterative least-squares adjustment (Tao and Hu, 2002; Grodecki and Dial, 2003; Fraser and Hanley, 2005).
(3) Geo-positioning accuracy analysis. The accuracy is evaluated and the mean error, std. error are calculated by check points.
(4) Extraction of DSM and editing. Firstly, create quasi epipolar images from each stereo-pair after RFM error compensation, and carry out density image matching, parallax and then elevation computing. Next, perform elevation re-projecting and interpolation: to calculate the elevation of each DSM grid point, define a rectangular area that takes the grid point as the center and the gird size as the side length, and then select all the 3-D points derived from image matching and computing within such rectangular area, and next fit out a quadratic surface equation from these 3-D points, so based on such equation the elevation value of DSM grid point can be calculated. Finally, elevation editing regarding blunder removal, mask over water bodies, clouds and shadows, etc. is necessary. Finally, DSMs generated separately from each stereo-pair will be merged into a single DSM according to their image matching scores, i.e. the reliability of the computed elevation.
(5) Generation of DEM from DSM. Since the 3-D points automatically extracted by density image matching are all located on surface of the ground and targets, DSM instead of DEM is generated actually. To transform the DSM to DEM, particular manual editing and post-processing are needed for some regions, such as removing forest, residential and other special features, assuring all the points on vegetation and roofs relocate on the ground surface, etc. To improve the efficiency of terrain editing, some feature points or feature lines will be extracted beforehand, to affiliate the reconstruction of DEM.
(6) Quantitative accuracy evaluation of DEM. Compare the WV-3 stereo-images derived DEM with the LiDAR point cloud data. Depending of the stereo-pairs and the land surfaces, about thousands of LiDAR check points will be used in the statistical computation of elevation biases. automatically extracted. In the situation without GCPs, carry out block adjustment with all the TPs, and then all the GCPs are
used as check points to evaluate the geo-positioning accuracy. Similarly, when only some of the GCPs are used, the rest GCPs will be used as check points to evaluate the geo-positioning accuracy after block adjustment performed. Judging from the results listed in Table 2, the planimetric accuracy without GCPs is about 2.16 m (mean error) and 0.55 m (std. error), which is for the WV-3 image data of this paper, with a small amount of GCPs located in the center or four corners of the test area, the systematic error of RFMs can be well compensated.
Geo-positioning
Table 2. Results of geo-positioning accuracy (in meters)
4.2 DEM Accuracy Evaluation
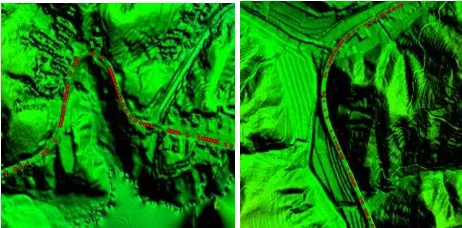
After generating the DEM of the test area with grid size configured as 2 m, registration is made between the generated DEM and LiDAR point cloud derived reference DEM. Aerial images acquired over the same period as the acquisition of LiDAR data are used to find unchanged features in comparison with WV-3 stereo-images and also to a certain degree estimate the planimetric bias of the compared DEMs. The roads can be
Figure 5. The road centre lines on reference DEM (left) and distribution of check points on DEM generated from WV-3
stereo-images (right).
Then, quantitative accuracy evaluation of generated DEM is performed based on an overall bias calculation method: get the planimetric coordinates and elevation value of check points from the LiDAR point cloud data; and then, according to the planimetric coordinates, find the elevation values of corresponding points on generated DEM; and next, make subtraction calculation to get elevation biases of all check points one by one, after which the max., min., mean and std. values of biases can be thus derived. Std. error is most often
used to reflect the bias degree of extracted elevations compared to their true values.
After statistics, the min. and max. elevation biases are respectively -3.6 m and 5.8 m, where mean and std. values are separately 0.38 m and 0.62 m. As illustrated in Table 3, among all the check points, there are 36 points with bias magnitude larger than 4 m, 92 points with bias magnitude larger than 2 m but smaller than 4 m, 213 points with bias magnitude larger than 1 m but smaller than 2 m, 914 points with bias magnitude larger than 0.5 m but smaller than 1 m, and 6001 points with bias magnitude smaller than 0.5 m. Here, the bias distribution map is also illustrated.
Bias magnitude
intervals
Number of check points
Percentage
(%) Bias distribution map
≤0.5m 6001 82.70 0.5m-1.0m 914 12.60
1.0m-2.0m 213 2.94
2.0m-4.0m 92 1.26 >4m 36 0.50
Table 3. Statistics of elevation biases between the extracted DEM and airborne LiDAR point cloud
Therefore, the distribution of bias magnitude is within the interval (0, 0.5m) in the majority. As illustrated in Figure 6, the check points with small elevation bias magnitude are located on road centrelines of DEM where image matching or manual editing are well performed with clear terrain textures.
Figure 6. Illustration of check points with bias magnitude interval (0.5m, -1m) (left) and (0, 0.5m) (right) on DEM
generated from WV-3 images
For the test area, the degree of terrain relief and fragmentation is a little high. The automatic matching result seems not very ideal in some local areas such as the valley line, ridge line, terrain change line and so on, and human-aided process is quite necessary for extraction of high-precision DEM. It can be found that large elevation biases are primarily located nearby residential place or hillsides where elevations extracted from stereo matching and also by manual editing are prone to have obvious outliers. Besides, the planimetric bias may also result in large elevation deviations. Moreover, interpolation of elevations may also bring in errors.
5. CONCLUSIONS
In this paper, it is demonstrated that the geo-positioning accuracy of WV-3 stereo-images in a mountainous test area is
desirable without or with only a few GCPs, which is superior to the nominal value. Compared with the high-accuracy airborne LiDAR point cloud, the elevation biases of DEM extracted from the WV-3 stereo-pairs are about 0.62 m (std. value). If considering the potential uncertainties in the image point measurement, image matching and also elevation editing, the accuracy of generating DEM from WV-3 stereo-images in mountainous areas should be more desirable. Therefore, WV-3 has the potential for 1:5000 or even larger scale mapping application.
6. ACKNOWLEDGEMENTS
Many thanks to Siwei Worldview Technology (Beijing) Co.,Ltd., Shandong Provincial Institute of Land Surveying and Mapping for their data and technical support during this research.
7. REFERENCES
Capaldo, P., Crespi, M., Fratarcangeli, F., Nascetti, A., Pieralice, F., 2012. DSM generation from high resolution imagery: applications with WorldView-1 and GeoEye-1. European
Journal of Remote Sensing, 44(1) , pp.41-53.
Cheng, Ph., Chaapel, C., 2008. Using WorldView-1 stereo data with or without ground control points. GEOinformatics, 11 (7), pp. 34-39.
d’Angelo, P., Reinartz, P., 2011. Semiglobal Matching Results on the ISPRS Stereo Matching Benchmark. International Archives of Photogrammetry and Remote Sensing and Spatial
Information Sciences, 38 (Part 4/W19), CD-ROM.
Dowman, I., Dolloff, J., 2000. An evaluation of rational function for photogrammetric restitution. International Archives
of Photogrammetry and Remote Sensing, 33 (Part B3),
pp.254-266.
Fraser, C.S., Hanley, H.T., 2005. Bias-compensated RPCs for sensor orientation of high-resolution satellite imagery.
Photogrammetric Engineering and Remote Sensing, 71 (8),
pp.909-915.
Grodecki, J., Dial, G., 2003. Block Adjustment of High-Resolution Satellite Images Described by Rational Polynomials.
Photogrammetric Engineering and Remote Sensing, 69(1):
pp.59–68.
Hirschmüller, H., 2008. Stereo processing by semi-global matching and mutual information. IEEE Transactions on
Pattern Analysis and Machine Intelligence, 30 (2), pp. 328-341.
Madani, M., 1999. Real-time sensor-independent positioning by rational functions. In: Proceedings of the ISPRS Workshop on “Direct versus indirect methods of sensor orientation”, Barcelona, Spain, pp. 64-75.
Poli, D., Toutin, T., 2012. Review of developments in geometric modelling for high resolution satellite pushbroom sensors. The Photogrammetric Record, 27 (137), pp. 58-73.
Poli, D., Wolff, K., Gruen, A., 2009. Evaluation of Worldview-1 stereo scenes. International Archives of the Photogrammetry,
Remote Sensing and Spatial Information Sciences, 38 (Part
1-4-7/W5), 6 (on CD-ROM).
Tao, V., Hu, Y., 2002. 3D reconstruction methods based on rational function model. Photogrammetric Engineering and
Remote Sensing, 68 (7), pp. 705-714.
Teo, T.A., 2011. Bias Compensation in a Rigorous Sensor Model and Rational Function Model for High-Resolution Satellite Images. Photogrammetric Engineering and Remote
Sensing, 77(12), pp. 1211–1220.
Toutin, T., 2006. Comparison of 3D physical or empirical models for generating DSMs from stereo HR Images.
Photogrammetric Engineering & Remote Sensing, 72 (5), pp.
597-604.
Toutin, T., Schmitt, C.V., Wang, H., 2012. Impact of no GCP on elevation extraction from WorldView stereo data. ISPRS
Journal of Photogrammetry and Remote Sensing, 72, pp.73–79.
Zhang, L., Grün, A., 2006. Multi-image matching for DSM generation from Ikonos imagery. ISPRS Journal of
Photogrammetry and Remote Sensing, 60 (3), pp. 195-211.