EVALUATING THE POTENTIAL OF IMAGING ROVER
FOR AUTOMATIC POINT CLOUD GENERATION
V. Cera a, *, M. Campi a,b
a Dept. of Architecture, Federico II University, 80134 Naples, Italy b Urban Eco Research Center, Federico II University, 80134 Naples, Italy
(valeria.cera, massimiliano.campi)@unina.it
Commission II
KEY WORDS: Multi-camera rover, close-range photogrammetry, UAV, architectural survey, accuracy analysis, Cultural Heritage
ABSTRACT:
The paper presents a phase of an on-going interdisciplinary research concerning the medieval site of Casertavecchia (Italy). The project aims to develop a multi-technique approach for the semantic - enriched 3D modeling starting from the automatic acquisition of several data.
In particular, the paper reports the results of the first stage about the Cathedral square of the medieval village. The work is focused on evaluating the potential of an imaging rover for automatic point cloud generation.
Each of survey techniques has its own advantages and disadvantages so the ideal approach is an integrated methodology in order to maximize single instrument performance.
The experimentation was conducted on the Cathedral square of the ancient site of Casertavecchia, in Campania, Italy.
* corresponding author
1. INTRODUCTION
Evaluation in contemporary methods and equipment for the acquisition of knowledge, immediately leads us to make assessments and considerations relating to the investigation procedures, which in their structural and methodological framework determine the results, influencing values. Potential values in every architecture come from an accurate analysis that is aided by mixed tools of investigation, coming sometimes from multidisciplinary knowledges. So, it is very hard to talk about “innovative” instruments and “traditional” instruments, but moreover we should talk about connections among different ways to investigate reality surrounding us and about how different methodological and scientific experiences can intersect each other, to reach for the best practice and to be adequate to the contemporary scenarios. The technological progress is continuously evolving and mutating, that it is too fast to catch a single conclusion.
Probably the best direction is the methodological cooperation, which allows to place various operations and experiences to take the best essence of each of them.
It so happens that the procedural horizon that emerges consists of different practical, instrumental and cognitive, methodological and functional goals, not always and not necessarily looking for the best accuracy of the data, but rather, verifying the adequacy of the knowledge objectives.
In this vision the innovative tools for survey find more reasons of their results when compared with those obtained by specifically selective procedures, which rely less on technology and much more on cognitive procedures, which have the experience and the capacity to reduce architecture schematically, with less instrumental impact.
All this passes through the cognition of reality formed, which retains traces of previous transformative paths, showing also how these may have given formal weaknesses and then where
can / should be modified, in order to proceed with the start of an improvement. The redevelopment, restoration and conservation go through the awareness of mistakes or good application of rules and procedures; such a state of the art must first be analysed and understood and only then can be modified for improvement. (M. C.)
2. RELATED WORKS AND WORK AIMS
In literature, several geomatics methods have been described in their application in historic and cultural heritage environments: 3D active sensors such as terrestrial laser scanning (TLS); 3D passive sensors such as photogrammetry distinguished in terrestrial and aerial (UAV); mapping mobile systems. As known, each of these techniques has its own advantages and disadvantages so the ideal approach is an integrated methodology in order to maximize single instrument performance (Boehler & Marbs, 2004; Skarlatos & Kiparissi, 2012; Fassi et al., 2013). In this way it is possible to obtain, starting from survey to 3D modeling, the best result in terms of single precision data, of overall accuracy as well as of the entire process optimization. In this regard, recent years have seen significant improvements in the performance of automatic metric and colorimetric feature extraction systems. Precision, accuracy, costs, acquisition and processing times are always essential requirements.
The first step towards the definition of this operating scenario of integrated methodologies was the trial on the use of unmanned aerial vehicles in architectural and archaeological survey. The authors of this essay had different experiences in this research field, in collaboration with international teams too. One of this was the survey they made in Theatres area of ancient town of Pompeii, using an UAV system that was particularly advanced at that time. Aerial surveying is, in the domain of archaeology and architecture, an exponential field of application The International Archives of the Photogrammetry, Remote Sensing and Spatial Information Sciences, Volume XLII-2/W3, 2017
and interest. Despite of all existing techniques, the required accuracy for modeling and representing wide areas suffers so far from a lack of convergent protocols taking advantage of existing hardware and software technologies.
A unique collaborative experiment among three french and one italian research teams was tested in 2013, on a major witness of mankind history, the city of Pompeii in Italy; it combined an automated image-based 3D modeling workflow designed for an accurate and detailed digitization of heritage artifacts developed by the MATIS laboratory, part of the french Institut Géographique National, SURVEY-COPTER, a french subsidiary company of EADS based in Pierrelatte, France, world leader in UAV's design and production both for military and civilian purposes, the CNRS-MAP research team, which experience with integrated interfaces and protocols development in the related domain, and URBAN/ECO, a research center of University of Naples Federico II expert in architectural and archaeological survey with advanced methodologies. All of these particular skills were put to the test in this very peculiar campaign (Saleri et al., 2013).
The main methodology workflow was based on a consideration: existing image-based open source tools are today widely available on the web, but frequently they are unable to derive precise and reliable 3D reconstructions within an accurate metric context; on the other hand, range sensors (mainly laser scanners) are able to quickly produce dense and precise 3D point clouds but often with a poor texture appearance and the need of a heavy 3D post-treatment to reconstruct surface geometry. The 3D reconstruction pipeline processes an automated tie point extraction, a bundle adjustment for camera parameters derivation, a dense image matching for surface reconstruction and a subsequent ortho-images generation. Many other studies have been carried on (Bäumker & Przybilla, 2011; Eisenbeiss & Sauerbier, 2011; Küng et al., 2011; Haala & Rothermel, 2012; Fiorillo et al., 2013; Nocerino et al., 2013) and have demonstrated the potential of the UAVs in the survey field, ensuring precision and accuracy in operations in which data acquisition is made difficult because of both the extension of the study area and reasons of inaccessibility. These systems allow the record of detailed information faster than other acquisition systems such as the range-based ones.
However, the vehicles used for the studies - such as multicopter or helicopter - require very prepared research teams and with quite financial resources. For this reason, other researchers have been interested to experience the use of commercial drones to quadcopters - have not professional high performance optics like the SLR (which can be equipped on multicopters). Nevertheless, studies show that these cameras provide both deviation (horizontal and vertical) and optical aberration values which are negligible and/or acceptable for the required use. Furthermore, the provided accuracy and detail degree is satisfactory regarding the obtained economic advantage coming from their use.
To optimize the acquisition step of metrics and colorimetric information, in recent years the potential advantages of an actual 3D surveying instrument recently introduced in the close-range photogrammetry field: the multi-camera rover Trimble V10 are being tested.
The idea of using multiple camera systems for the architectural and archaeological survey is not totally new. These systems
return panoramic images for the photogrammetric data processing.
The use of this type of images for survey purposes has been theorized in 2006 by Prof. Gabriele Fangi. Several his own studies (Fangi, 2006; Fangi, 2007; Fangi et al., 2008; E. D’Annibale & Fangi, 2009; Fangi, 2010) have confirmed the great benefits that both spherical and panoramic images produce in the cultural heritage survey especially during destruction and threat times. These benefits are supported by manipulation and extraction of image data techniques, carried out by rigorous scientific processes.
The spread of innovative multi-camera instruments in connected to this branch of research.
Today, the two most common multi-camera systems are the Trimble V10 and GoPro Odissey. However, while the GoPro systems seems to be only available in a small number, the Trimble V10 system seems to be in a continuous production. Thus, during the last two years, quite a number of research focused on the application of the V10, used in various projects: design of oil and gas pipelines, monitoring of forests, streams, icy areas affected by earthquakes, survey and 3d modeling of architectural monuments (Park & Um, 2015; Heppelmann et al., 2016; Meyer & Brunn, 2016). The results of a scientific study (Brunn & Meyer, 2016) conducted to evaluate the reliability of the V10 cameras for photogrammetric applications are very interesting: positioning and calibration tests have confirmed the potential.
Nevertheless, in literature there are also cases of discordant assessments (Evans, 2015), which show that the lack of accuracy of the data obtained by a V10 system when compared to those registered with other surveying systems.
On the basis of these references, this contribution establishes a practical objective, linked to a broader vision of future research perspective.
The first aim is to test the applicability of a V10 system to survey the area under study, because the V10 technical specifications were considered suitable for the peculiar environmental conditions. Performance check and results evaluation will provide its assessment on the new tool potential, adding a case study to the ongoing debate.
This survey is part of a larger experimentation project in the field of an innovative use for the Cultural Heritage, in connection with the need to reflect about its role in the society and contemporary cities.
The work aims depends on the long-standing opinion that cities are - and will increasingly be - the place where most of the world's population will live, this concept leads us to make careful considerations about how the urban landscape could evolve in the future and with what speed.
This change is strongly affected by technological development, which determines the digitization of information across platforms that allow to dematerialize some use of physical space.
So we must analyse this period of profound transformation of relational habits, which affects urban design, also suggesting new tools to fast interventions for the rehabilitation of the places where we live.
These issues and how they can be resolved at best, deal with the current debate tremendously focused around the new concept of smart city, that will do a great use of BIM and H-BIM systems.
3. AREA OF STUDY
The experimentation was conducted on the Cathedral square of the ancient site of Caserta Vecchia, in Campania, Italy. The site was chosen for its importance: it is a significant example of The International Archives of the Photogrammetry, Remote Sensing and Spatial Information Sciences, Volume XLII-2/W3, 2017
XXI century unchanged architecture recognized as Cultural Heritage. The village of Caserta Vecchia was an important Lombard center, then Norman one, where diocese settled after the destruction of the episcopal see of Calatia, in the current area of Maddaloni.
The cathedral is dedicated to Saint Michael Archangel and located on the top of a hill, where an ancient Lombard hamlet is, nowadays known as Caserta vecchia to distinguish it from the town of Caserta, placed at the ending of the slope.
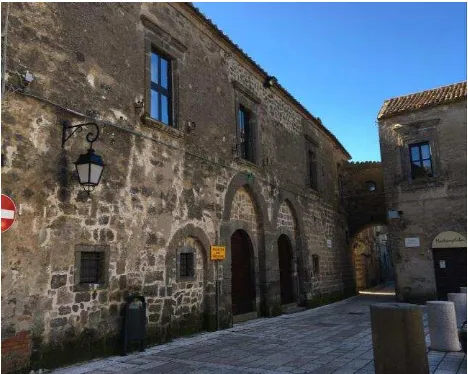
The village was built during the Middle Ages and preserves the historical style and urban layout. It is the first settlement of the most famous city of Caserta. Its main square is overlooked by the Saint Michael’s Cathedral which is placed, along with the bell tower, on its eastern front. The other three sides are occupied by the facades of the old convent and other few buildings. A road, passing under the arch of the bell tower, crosses the square next to the South front.
Figure 1. The medieval square of Casertavecchia. The Cathedral and the bell tower.
Figure 2. The medieval square of Caserta vecchia. The old convent.
During the Norman era the hamlet see its major grew, depending on the transfer of diocese on the hill, and since 1113 the cathedral construction started on the willing of Bishop Rainulfo.
The church is an extraordinary example of the Romanesque architecture in Campania for it simultaneously has influences from Sicily and, at the same time, evident influences from the Roman and early Christian tradition.
The influence from Sicilian Romanesque style is readable especially in the decorative particulars, which show the coexistence of Normans and Byzantines and Arabs elements, probably arrived in the region by the architecture developed in Amalfi. Instead, the composition scheme seems derived from the area surrounding Montecassino, that was at its maximum in role as spiritual and cultural centre, spreading in the south of Rome an architectural typology corresponding to that of the early Christian basilica tradition.
The facades of the building are built in grey tuff, a light, porous rock formed by consolidation of volcanic ash composed in a smooth stone with physical consistencies that allow to work it easily, it is the variety used in Caserta vecchia with prevailing grey colour used, between the twelfth and sixteenth centuries, even in Capua and Salerno.
Main facade is west oriented with a geometry that reflects the height of the internal naves of the church. Three marble portals (probably marble Luni) have clear colour that is posed in contrast with the grey colour of the surfaces and they represent vegetable ornaments, as it was typical in the traditional iconography. The main decorative elements are present in zoomorphic sculptures supporting the lintels and emerge, cantilever, from the masonry. The eardrum is characterized by a series of interlacing arches resting on six marble columns. A frame with arches runs on all over the fronts. The southern facade is decorated with lozenges marble, while elliptical shapes characterize the opposite side.
Looking towards the main facade on the right, it is possible to see the high tower bell, concluded at the time of Frederick II in 1234, as stated by an inscription located in the upper part. The tower has similarities with the bell tower of the Cathedral of Aversa and it shows evident Gothic influences, found in the large ogival arch, crossed by a passing road. The upper levels present with mullioned windows, surmounted by a final level that changes the regular geometry of the building, ending in the corners with cylindrical towers placed to emphasize the structure of the top.
4. SURVEY METHODOLOGY
To realize a 3D control surveying network of the whole area of interest, an integrated methodology was selected among reality-based techniques: (i) terrestrial photogrammetric survey to acquire a detailed point cloud; (ii) aerial photogrammetric survey to fill any voids and obtain a complete environmental point cloud; (iii) classical topographic survey with total station to acquire Ground Control Point (GCP) for scaling and merging purposes; (iv) static positioning GNSS survey to geo-reference the data.
4.1 The topographic network
Before starting the surveying, the high resolution and accuracy desired for the research needed a careful planning of the acquisition and the processing stages. The reliability of the entire workflow was guaranteed by ground control measurements evenly distributed over the square’s area. Along the square’s facades, fifteen high contrast and well-distinguishable targets were placed every 7 m on the walls at a variable height between 1.759 m and 2.278 m. The objective was to use them as GCPs and CPs (Check Points) for the topographic network as well as for the aerial and The International Archives of the Photogrammetry, Remote Sensing and Spatial Information Sciences, Volume XLII-2/W3, 2017
photogrammetric surveys. So the targets were designed for the purpose to be recognisable by both the total station and the photogrammetric imaging rover. The 3D surveying network was performed with a Trimble S7 Total Station.
Trimble S7 Automatic level compensator Dual-axis Automatic level compensator range ±5.4’
Angle measurement accuracy 1’’
Distance measurement accuracy (prism) 1 mm + 2 ppm Distance measurement accuracy (DR) 2 mm + 2 ppm Measurement range (prism) 2500 m
Measurement range (DR) 1300 m
Measurement range (DR extended) 2200 m
Scanning range 1 m to 250 m
Scanning deviation 1 mm @ ≤50 m
Table 1. Main technical specification of the S7 total station.
Each marker was measured from just one survey station, located behind the North facade in a central position, due to of the environments obstacles. Furthermore, a double-frequency receiver has recorded four points. The Trimble R10 GNSS was used in RTK positioning in order to perform the data transformation and to geo-reference the final 3D model with precision. These points were located near the four corners of the rectangular shape of the square.
4.2 The photogrammetric survey
The photogrammetric survey was performed in the best possible way in order to ensure an efficient planning of sensor positioning. It was necessary to obtain complete object coverage - with sufficient overlap for partial data registration - by lower number of stations. At the same time, the acquisition was planned in accordance with the requirement of accuracy and the aim of guaranteeing a high level of automation in the successive phase of data elaboration.
The image acquisition was realized by two separate stages: aerial and terrestrial.
4.2.1 Terrestrial surveying: As specified, for the terrestrial one, it was decided to experiment with the use of an imaging rover. The survey was performed by a Trimble V10 Imaging Rover: it’s an integrated camera system that captures 360 -degree digital panoramic images for visual documentation and measurement of the surrounding environment. V10 consists of a total 12 calibrated cameras located on two levels: 7 horizontal cameras have a landscape orientation with a field of view of 57.5° (horizontal) x 43° (vertical); 5 downward facing cameras have a portrait orientation with a field of view of 43° (horizontal) x 57.5° (vertical).
In this way, we have a field of view angle captured by panorama cameras of 360° x 43°, a field of view angle captured by down looking cameras of 210° x 57.5° and a vertical field of view of 93.1°. Each camera acquires a frame with a 5 MP resolution in jpeg format, so the total panorama resolution is 60 MP. The V10 allows capturing images with a maximum angle of inclination of 15 °. It is possible to store information relating to elements placed at a higher-level respect to the observation
Table 2. Main technical specification of the V10 imaging rover.
The V10 survey involved a total number of 34 stations: 30 stations keeping the instrument in a standing position and 4 ones in a tilted position. The stations had a distribution as uniform as possible in the area, with a mean distance between the stations of ca 2.5 m and with a mean distance to the object of about 6 m. This distance was chosen according to the square’s shape, the point cloud accuracy and resolution. Therefore, it isn’t the recommended spatial relationship but it’s necessary in order to the presence of occlusions caused by parked cars.
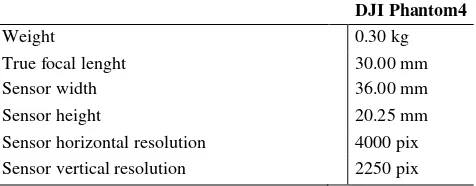
4.2.2 Aerial surveying: The complete image-based 3D point cloud of the square was obtained using a commercial UAV such as DJI Phantom 4. The UAV model is a quadcopter whose weight is 0.30 kg equipped with a 12Mpx integrated camera and it has a flying range of about 15 minutes.
DJI Phantom4
Weight 0.30 kg
True focal lenght 30.00 mm
Sensor width 36.00 mm
Sensor height 20.25 mm
Sensor horizontal resolution 4000 pix Sensor vertical resolution 2250 pix
Table 3. Main technical specification of the DJI Phantom4 camera.
The imaging network was carefully planned due to the height of both the Cathedral and the bell tower, to avoid possible deformations in the final 3D model.
In order to acquire data concerning the whole square, two flights were planned in relation to battery duration. The area was divided in two parts and for each part specific photogrammetric networks were designed. For the buildings facing the square, the Phantom flew in autonomous way, following a flight path defined by georeferenced way points. 37 vertical images were acquired at a distance from the object of about 10 m so an average Ground Sample Distance (GSD) of 3 mm was obtained. The flight height has been established at about 5 m above the ground in such a way as to set the camera as much as possible frontally to the dominant plane of the facades. The photos were acquired observing a sidelap of 65% - corresponding to an average distance of 3 m along the strip - between two adjacent positions. Some oblique images - with a mean angle from the horizontal of about 45° - were acquired in order to improve the data processing.
To survey the bell tower, the UAV flew in assisted way so that the pilot was able to adjust the position and orientation of the The International Archives of the Photogrammetry, Remote Sensing and Spatial Information Sciences, Volume XLII-2/W3, 2017
aircraft with regard to the environmental conditions. Shoots were taken using an intervalometer set at a 2-second interval. This allowed the pilot briefly to view the frame before each photo was acquired. The pilot could reposition the UAV between shots to acquire additional images of the architecture if needed. Both vertical and oblique images - with a mean angle from the vertical of about 30°- were acquired around the bell tower. A relative altitude from 40 m to 1 m was used, observing a distance from the object of ca 3 m. A mean GSD of less 1.5 mm was obtained and about 130 photos were acquired to guarantee a proper coverage. For the vertical strips, a forward overlap of 80% - corresponding to an average distance of 2 m along each strip - and a sidelap of 70% between two adjacent strips - corresponding to an average distance of 3.2 m across strip - were assured. (V. C.)
5. DATA PROCESSING AND PRODUCTS
5.1 Terrestrial photogrammetry
The surveying data were processed in a native Trimble network solution called Trimble Business Center TBC. The terrestrial photogrammetric survey was processed by a long and complicated method: every photo station must be displayed to identify all targets in the scene.
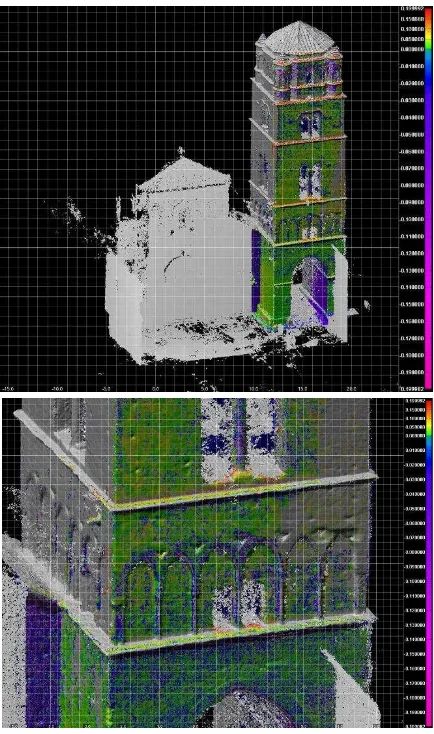
Figure 3. Terrestrial photogrammetric point cloud by imaging rover. In red, photo-station measurements.
In this workflow, the image adjustment was made creating manual tie points from each photogrammetry observations. After computing the project with the manual tie points, we used the automatic tie point finder to find additional tie points and perform the full adjustment. The report of the process of bundle adjustment showed some warning (yellow) flags which indicate the exceeding of the threshold value (0°02’00’’) of the angle residual tolerances (horizontal, vertical) that was set for the data process. In this case, the warning message was considered not influent to the accuracy of the computation.
Figure 4. Photographic observation in TBC. View of the panorama generated by V10 cameras.
The presence of the control points, visible in the panoramas and used in the photo point measurements, improved the orientation of the related photo stations both in horizontal and vertical direction and stabilized the whole bundle and result in even better horizontal and vertical accuracy. For each of the fifteen targets used as CPs, an average of 30 photographic observations was possible. So, a point cloud of about 10 million points with a spatial resolution of ca 2.4 mm was obtained.
5.2 3D surveying network and GNSS survey
The reference points measured with the total station - have been used to realize the definition of the data for the scale and the coordinate reference system.
The control points have been integrated with the GNSS data processing, which provided a sub-centimetre accuracy. In this way, the model was referred to the UTM/WGS84 reference system.
Figure 5. Total station survey.
5.3 UAV photogrammetry
The processing of the acquired aerial images followed the standard photogrammetric pipeline.
The data processing was the same for each of the two acquired images datasets.
Firstly, the UAV block was triangulated using state-of-art automated image orientation tools such as Structure from Motion. Then, the extracted tie points were used to produce a textured 3D polygonal model, carried out with dense image matching algorithms, which was afterwards optimized and decimated.
For the whole square, a point cloud of ca 11 millions of points and a model of 2.50 millions faces were obtained. For the bell The International Archives of the Photogrammetry, Remote Sensing and Spatial Information Sciences, Volume XLII-2/W3, 2017
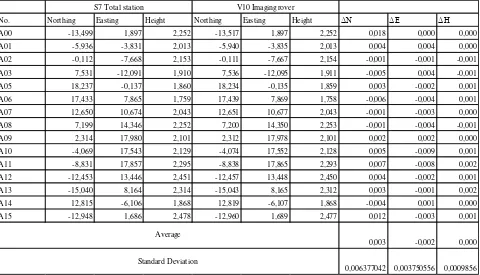
No. Northing Easting Height Northing Easting Height ΔN ΔE ΔH
A00 -13,499 1,897 2,252 -13,517 1,897 2,252 0,018 0,000 0,000
A01 -5,936 -3,831 2,013 -5,940 -3,835 2,013 0,004 0,004 0,000
A02 -0,112 -7,668 2,153 -0,111 -7,667 2,154 -0,001 -0,001 -0,001
A03 7,531 -12,091 1,910 7,536 -12,095 1,911 -0,005 0,004 -0,001
A05 18,237 -0,137 1,860 18,234 -0,135 1,859 0,003 -0,002 0,001
A06 17,433 7,865 1,759 17,439 7,869 1,758 -0,006 -0,004 0,001
A07 12,650 10,674 2,043 12,651 10,677 2,043 -0,001 -0,003 0,000
A08 7,199 14,346 2,252 7,200 14,350 2,253 -0,001 -0,004 -0,001
A09 2,314 17,980 2,101 2,312 17,978 2,101 0,002 0,002 0,000
A10 -4,069 17,543 2,129 -4,074 17,552 2,128 0,005 -0,009 0,001
A11 -8,831 17,857 2,295 -8,838 17,865 2,293 0,007 -0,008 0,002
A12 -12,453 13,446 2,451 -12,457 13,448 2,450 0,004 -0,002 0,001
A13 -15,040 8,164 2,314 -15,043 8,165 2,312 0,003 -0,001 0,002
A14 12,815 -6,106 1,868 12,819 -6,107 1,868 -0,004 0,001 0,000
A15 -12,948 1,686 2,478 -12,960 1,689 2,477 0,012 -0,003 0,001
0,0009856 S7 Total station V10 Imaging rover
Average
Standard Deviation
0,003
0,006377042
-0,002
0,003750556
0,000
Table 4. Results of Accuracy Evaluation tower, about 17 millions of points were computing to extract ca
4 millions of faces.
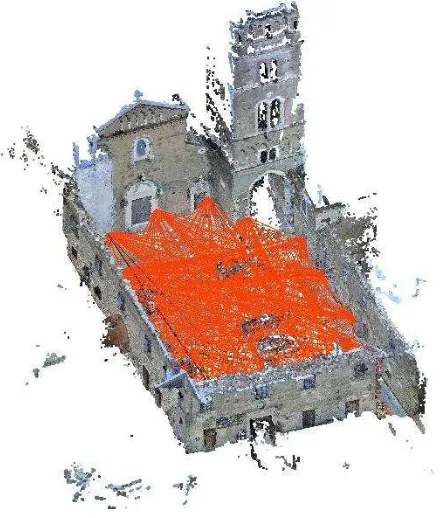
Figure 6. Aerial photogrammetric survey. Bell tower. Point cloud (left), polygonal model (right).
The definition of the datum - in relation to scale and coordinate reference system - was compared with the reference points measured by the total station and the GNSS receiver.
5.4 Evaluation of 3D resultsand outlook
As expected, the terrestrial photogrammetric point cloud was not completed, in fact the portion of the tower above the quota reachable by the maximum inclination of the V10 was not acquired as well as the parts obstructed by cars. The data integration was necessary in order to obtain a complete 3D model of the whole area. However, before proceeding with this step, an evaluation of the results is mandatory.
Accuracy analysis of the V10 results was performed by comparing them with the total station ones. For the accuracy evaluation, a total of 15 points which were clearly detected from the panoramic image were selected as check points and the coordinates of N, E, H directions were compared (Table 4). As a result of accuracy evaluation, the deviation of horizontal (Northing, Easting) direction was -0.009 m ~ 0.018 m and the average of deviation was ca. 0.003 m. The deviation of vertical direction was -0.001 m ~ 0.002 m and the average was null. This specific values of deviation obtained in horizontal and vertical direction let us conclude that the result using continuous panoramic images can be fully used in accurate terrestrial photogrammetric survey.
Then, the V10 results were compared with the aerial photogrammetric point cloud.
Assuming the point cloud obtained by the imaging rover as spatial reference, the deviation along the three Cartesian axes of the UAV point cloud was evaluated and its values vary between -0.01 m and 0.00 m along the z-axis. Instead, the deviations along the x- axis and y-axis were null. So, the two point clouds can be considered coincident. These results confirm our validation of the use of the imaging rover.
Figure 7. Comparison between aerial and terrestrial photogrammetric survey before the registration process. The
colours show the difference between the two point clouds.
In order to obtain a complete and detailed model of the whole area, the partial results achieved by the different techniques have been included. The obtained integrated 3D model will be the subject of detailed thematic studies, corresponding to the different stages of the research project. In particular, the future purposes are to extrapolate very useful information in diagnostics using spatial annotation of the point cloud by the use of algorithms already implemented in open-source software. In this way, degradation maps can be extrapolated and visualized directly on the 3D model. For this aim, the 3D model must be semantically segmented by a specific ontology structured for the type of the study architecture and annotated. So, much of the information related to an architecture can be annotated and directly linked to the architectural elements, making them more detailed and easier to study. (V.C.)
6. CONCLUSIONS
The results of the first phase, showed in this paper, coincide with our aim and they are satisfactory.
The experimentation on potential applications in the field of survey of an imaging rover, provided convincing elements of assessment. On the one hand, the system allows obtaining, in even more short time, a large number of information. The degree of precision and accuracy is even quite high in spite of a decrease in acquisition time. The use of the instrument at odds
with the guidelines recommended, because of the obstacles present on the site, has showed the ability to render a correct and accurate datum. On the other hand, the data processing turns out to be still too complex and slow unlike the frame recording stage.
In conclusion, the case study allowed to validate the profitable use of an imaging rover in the field of terrestrial photogrammetry for those records in which the acquisition time of the data in situ is extremely limited. Besides, the problem of still long processing times can be resolved using the instrument to acquire the environment of a site. In this way, the quantity and quality of data to process is reduced achieving a general framework. Then it must to be integrated with the other available techniques in order to obtain a complete and accurate documentation. Instead, the environmental difficulties appear to be manageable with precision without loss of information in terms of quality and accuracy.
ACKNOWLEDGMENTS
The authors are thankful to Michele Rubidio and Trimble for the support with the S7 Total Station and V10 Imaging rover. A special thanks also to Luis Antonio Garcia, researcher of the
Laboratorio de Fotogrametria Arquitectonica de la Universidad de Valladolid (Spain) for his support. A particular acknowledgement to Domenico Iovane who supported the survey operations, as part of the team in this and others operations.
This research is part of ongoing investigations leaded by a team specialized in advanced architectural survey methodologies, operating in Diarc, Department of Architecture, and in Research Center Urban/Eco of the University of Naples Federico II (Italy), who has a great tradition founded by Prof. Adriana Baculo Giusti and today coordinated by Prof. Antonella di Luggo.
REFERENCES
Argan, G.C., 1993. L'architettura protocristiana, preromanica e romanica.
Bäumker, M., Przybilla, H.-J., 2011. Investigations on the accuracy of the navigation data of unmanned Aerial Vehicles using the example of the system mikrokopter. In: Int. Arch. of Photogrammetry, Remote Sensing and Spatial Information Sciences, 38(1/C22).
Boehler, W., Marbs, A., 2004. 3D scanning and photogrammetry for heritage recording: a comparison. In: Proc. 12th Int. Conference on Geoinformatics, pp. 291-298.
Bolognesi, M., Furini, A., Russo, V., Pellegrinelli, A., Russo, P., 2015. Testing the low-cost rpas potential in 3d Cultural Heritage reconstruction. In: Int. Archives of Photogrammetry, Remote Sensing and Spatial Information Sciences, XL-5/W4, pp. 229-235.
Brenningmeyer, T., Kourelis, K., Katsaros, M., 2015. The Lidoriki Project: Low Altitude, Aerial Photography, GIS, and Traditional Survey in Rural Greece. In: Proc. of the 43rd Annual Conference on Computer Applications and Quantitative Methods in Archaeology, 1, pp. 979-988.
Brunn, A., Meyer, Th., 2016. Calibration of a multi-camera rover. In: Int. Archives of Photogrammetry, Remote Sensing and Spatial Information Sciences, XLI-B5, pp. 445-452. The International Archives of the Photogrammetry, Remote Sensing and Spatial Information Sciences, Volume XLII-2/W3, 2017
Cantoro, G., Tsigonaki, C., Armstrong, K., Sarris, A., 2015. Integrating Low Altitude with Satellite and Airborne Aerial Images: Photogrammetric Documentation of Early Byzantine Settlements in Crete. In: Proc. of the 43rd Annual Conference on Computer Applications and Quantitative Methods in Archaeology, 1, pp. 973-970.
D’Annibale, E., Fangi, G., 2009. Interactive modeling by projection of oriented spherical panorama. In: Int. Arch. of Photogrammetry, Remote Sensing and Spatial Information Sciences, XXXVIII-5/W1, pp. 1682-1777.
D’Annibale, Massa, S., E., Fangi, G., 2010. Photomodeling and point clouds from spherical panorama- Nabatean architecture in Petra, Jordan. Workshop Petra 4-8 November 2010.
D'Avino, V., 1848. Cenni storici sulle chiese arcivescovili, vescovili, e prelatizie (nullius) del regno delle due Sicilie.
Eisenbeiss, H., Sauerbier, M., 2011. Investigation of UAV systems and flight modes for photogrammetric applications. In:
The Photogrammetric Record, 26(136), pp. 400-421.
Evans, J. T., 2015. Evaluation of photogrammetric measurements obtained using imaging rovers and imaging theodolites. Graduation Thesis in Spatial Science. Available on: https://eprints.usq.edu.au/29203/.
Fangi, G., 2006. Investigation On The Suitability Of The Spherical Panoramas By Realviz Stitcher For Metric Purposes. In: Int. Arch. of Photogrammetry, Remote Sensing and Spatial Information Sciences, XXXVI/5.
Fangi, G., 2007. The Multi-image spherical Panoramas as a tool for Architectural Survey. In: Int. Arch. of Photogrammetry, Remote Sensing and Spatial Information Sciences, XXXVI-5/C53.
Fangi, G., Clini, P., Fiori, F., 2008. Simple and quick digital technique for the safeguard of Cultural Heritage. The Rustem Pasha mosque in Istanbul. In: DMARC 4 -Digital Media and its Applications in Cultural Heritage, pp. 209-217.
Fangi, G., 2010. Multiscale Multiresolution Spherical Photogrammetry With Long Focal Lens For Architectural Surveys. In: Int. Arch. of Photogrammetry, Remote Sensing and Spatial Information Sciences, mid-term symposium Newcastle.
Fassi, F., Fregonese, L., Ackermann, S., De Troia, V., 2013. Comparison between laser scanning and automated 3D modelling techniques to reconstruct complex and extensive cultural heritage areas. In: Int. Arch. of Photogrammetry, Remote Sensing and Spatial Information Sciences, 40(5/W1), pp. 73-80.
Fiorillo, F., Jimenez Fernàndes-Palacios, B., Remondino, F., Barba, S., 2013. 3d Surveying and modelling of the Archaeological Area of Paestum, Italy. In: VAR, 4(8), pp.55-60.
Heppelmann, J.B., Wittkopf, S., Seeling, U., Labelle, E.R., 2016. Evaluating the debarking efficiency of modified harvesting heads on European tree species. Available on: matching of highly overlapping UAV imagery. In: Int. Arch. of Photogrammetry, Remote Sensing and Spatial Information Sciences, 39(B1).
Jordan, T. R., Goetcheus, C. L., Madden, M., 2016. Point cloud mapping methods for documenting cultural landscape features at the wormsloe state historic site, Savannah, Georgia, USA. In:
Int. Archives of Photogrammetry, Remote Sensing and Spatial Information Sciences, XLI-B5, pp. 277-280.
Küng, O., Strecha, C., Beyeler, A., Zufferey, J. C., Floreano, D., Fua, P., Gervaix, F., 2011. The Accuracy of Automatic Photogrammetric Techniques on Ultra-Light UAV Imagery. In:
Int. Archives of Photogrammetry, Remote Sensing and Spatial Information Sciences, 38(1/C22), pp. 14-16.
Lang, M., Behrens, T., Schmidt, K., Svoboda, D., Schmidt, C., 2015. A fully integrated UAV system for semi-automated archaeological prospection. In: Proc. of the 43rd Annual Conference on Computer Applications and Quantitative Methods in Archaeology, 1, pp. 989-996.
Mascort-Albea, E.J., Ruiz-Jaramillo, J., Romero-Hernandez, R., 2014. Analyzing Cultural Heritage by unmanned flights: new strategies researching rural and urban spaces. In: VAR, 5(11), pp. 55-64.
Meyer, T., Brunn, A., 2016. Digitale Photogrammetrie und Bildverarbeitung für kleine und mittlere Unternehmen durch „Blended Learning“. In: DGPF, 25, pp. 436-448.
Nocerino, E., Menna, F., Remondino, F., Saleri, R., 2013. Accuracy and block deformation analysis in automatic UAV and terrestrial Photogrammetry - lesson learnt. In: Int. Archives of Photogrammetry, Remote Sensing and Spatial Information Sciences, II-5/W1, pp. 203-208.
Park, J-K., Um, D-Y., 2015. Accuracy Analysis of Structure Modeling using Continuous Panoramic Image. In: International Journal of Smart Home, 9(5), PP. 165-174.
Remondino, F., 2011. Heritage Recording and 3D Modelling with Photogrammetry and Laser Scanning. In: Remote Sensing, 3(6), pp.1104-1138.
Saleri, R., Cappellini, V., Nony, N., Pierrot-Deseilligny, M., Bardiere, E., De Luca, L., Campi, M., 2013. UAV Photogrammetry for archaeological survey: The Theaters area of Pompeii. In: Addison, A. C., De Luca, L., Guidi, G., Pescarin, S., Digital Heritage, Institute of Electrical and Electronics Engineers (IEEE), II, pp. 497-502.
Santano, D., Esmaeili, H., 2014. Aerial Videography in Built Heritage Documentation: The Case of Post-Independence Architecture of Malaysia. In: International Conference on Virtual System & Multimedia VSMM, Hong Kong.
Skarlatos, D., Kiparissi, S., 2012. Comparison of laser scanning, photogrammetry and SFM-MVS pipeline applied in structures and artificial surfaces. In: Int. Annals of Photogrammetry, Remote Sensing and Spatial Information Sciences, I-3, pp. 299-304.