SEMI-GLOBAL MATCHING WITH SELF-ADJUSTING PENALTIES
E. Karkalou*, C. Stentoumis, G. Karras
(ellikarkalou at gmail.com, cstent at mail.ntua.gr, gkarras at central.ntua.gr)
Laboratory of Photogrammetry, National Technical University of Athens, GR-15780 Athens, Greece
Commission II
KEY WORDS: Disparity, Stereo, Matching, Semi-global, Penalties, Adaptive, Aggregation, Optimization
ABSTRACT:
The demand for 3D models of various scales and precisions is strong for a wide range of applications, among which cultural heritage recording is particularly important and challenging. In this context, dense image matching is a fundamental task for processes which involve image-based reconstruction of 3D models. Despite the existence of commercial software, the need for complete and accurate results under different conditions, as well as for computational efficiency under a variety of hardware, has kept image-matching al-gorithms as one of the most active research topics. Semi-global matching (SGM) is among the most popular optimization alal-gorithms due to its accuracy, computational efficiency, and simplicity. A challenging aspect in SGM implementation is the determination of smoothness constraints, i.e. penalties P1, P2 for disparity changes and discontinuities. In fact, penalty adjustment is needed for every particular stereo-pair and cost computation. In this work, a novel formulation of self-adjusting penalties is proposed: SGM penalties
can be estimated solely from the statistical properties of the initial disparity space image. The proposed method of self-adjusting
pe-nalties (SGM-SAP) is evaluated using typical cost functions on stereo-pairs from the recent Middlebury dataset of interior scenes, as well as from the EPFL Herz-Jesu architectural scenes. Results are competitive against the original SGM estimates. The significant aspects of self-adjusting penalties are: (i) the time-consuming tuning process is avoided; (ii) SGM can be used in image collections with limited number of stereo-pairs; and (iii) no heuristic user intervention is needed.
* Corresponding author.
1. INTRODUCTION
The extraction of dense 3D information and the accurate visual recording from a set of images is a core part in various Cultural Heritage applications. Typically, accurate visual and geometric recording supports documentation, restoration and preservation activities ranging from large scale monuments to small artifacts. Lately, cultural heritage has benefited from new emerging tech-nologies, based on 3D information, and the impressive increase in available smart mobile devices. Gamification of guided tours and story-telling approaches for the public presentation of cul-tural heritage are based on augmented and virtual reality tools, which all share the extraction of 3D information as a key enabl-ing technology. As an active research topic, extraction of dense 3D information is bundled with many intermediate products and application fields in the areas of photogrammetry, computer vi-sion and image processing. 3D reconstruction, ortho-projection, pose estimation, simultaneous localization and mapping, image stitching, recognition and novel view synthesis are but a few of the topics of interest. In this context, dense image matching is a fundamental task for every application undertaking automated 3D reconstruction from images. 3D model generation concerns an ever-growing list of diverse applications, which includes cul-tural heritage recording, precision agriculture and farming, au-tomation in construction, large-scale city modeling, 3D GIS, automotive industry, industrial robotics, infrastructure inspec-tion, and security.
While several related software has been commercially introduc-ed, the varying application conditions, the demand for complete and accurate measuring products, as well as for computational
efficiency in a variety of hardware, keep image-matching algo-rithms as one of the most active research topics. Stereo-match-ing, or multiple view stereo-matchStereo-match-ing, is indeed a challenging task when compared to multi-view matching, as it addresses the question with limited number of observations. This said, it re-presents an indispensable tool for case scenarios where multiple views are limited, such as in the cases of historical images, ae-rial images, robot vision, autonomous vehicles, mobile devices.
Scene reconstruction usually falls under two distinct processes:
sparse matching for retrieving correspondences among images
for camera extrinsic and intrinsic calibration, and dense
match-ing for full 3D surface reconstruction. Dense stereo-matchmatch-ing,
i.e. the estimation of a homology in the matching (right) image for each pixel in the base (left) image, is typically performed on rectified (epipolar) stereo pairs, and it is an essential element in both multi-view stereo or stereo-view reconstruction processes. A well-established approach in analysing and classifying ste-reo-matching algorithms is to typically decompose them in four basic components: matching cost computation, support
aggre-gation, disparity optimization and disparity refinement
(Szeli-ski, 2011). An evaluation of stereo-matching methods based on their actual results and usefulness in real life applications is quite difficult and depends on several diverging criteria. This is particularly true if one considers the variety of both applications and arising issues, e.g. depth variability, lighting conditions, re-flecting surfaces, scene occlusions, image acquisition geometry, and illumination changes, just to name a few.
In the matching cost computation step a dissimilarity measure is given to each pixel for every value in the disparity range. The
matching measures may be simple (for instance, absolute pixel differences) but they could also involve image transformations such as the non-parametric Census transformation and its varia-tions to produce robust results based on binary relavaria-tionships of pixels with their vicinity. One of the most recent reviews evalu-ates an extensive collection of matching cost functions (Hu & Mordohai, 2012). Computed cost volumes need to be smoothed against noise, while usually exploiting the ‘fronto-parallel’ as-sumption, thus the pixel-wise cost is aggregated within a sup-port neighbourhood. A thorough review is presented in Tombari et al. (2008). A common distinction is between local and global methods; disparity selection in local methods is typically car-ried out in the winner-takes-all (WTA) mode, while global me-thods rely on energy minimization systems to optimize disparity over all image pixels against the need to keep continuous surfa-ces and satisfy pixel-wise matching criteria. Between local and global methods a class of algorithms for semi-global matching (SGM) has been presented by Hirschmüller (2005). In addition, the class of non-local methods attempt to extend the kernel of the local ones onto the whole image (Huang et al., 2016; Yang, 2012). Zhang et al. (2015) combine the information from diffe-rent scale spaces to efficiently exploit the image pyramid in ad-dressing issues in texture-less regions and restricting the dispa-rity search space. Li et al. (2016) reduce the ‘fronto-parallel’ ef-fect in disparity estimation over support aggregation neighbour-hoods by proposing the formation of slanted support windows which greatly improve the results for non-frontal surfaces. Fol-lowing the most recent trend in computer vision research and state-of-the-art applications, deep learning approaches, i.e. con-volutional neural network (CNNs) schemes, are constructed for the purposes of stereo-matching in the matching cost computa-tion step. Some of the top-ranking algorithms in the evaluacomputa-tion platforms are based on such formulations. Thus, Zbontar & Le Cun (2015) train a convolutional neural network on small image patches of known disparity, and the result is used as an initial cost volume. On the other hand, Luo et al. (2016) estimate a product layer from the inner product of the two representations of the typical Siamese network in order to simplify the process and exponentially speed up the process to real-time applica-tions. The promising idea of exploiting the strengths and avoid-ing the weaknesses of different matchavoid-ing functions is proposed in Spyropoulos & Mordohai (2015), where an ensemble classi-fier is trained to decide the appropriate cost functions on a cer-tain pixel. Lately, it has been discussed that the cost aggrega-tion process is the key process for most local methods and an important component for many global ones (Yang et al., 2009; Wang & Zheng, 2008). In Georgousis et al. (2016) such a hyb-rid method refining the global estimations by local support win-dows has been presented.
One of the most cited, publicly available databases of stereo images, which at the same time serves as an online evaluation platform, is that of Middlebury College*. The images used here have been taken from the Middlebury 2006 stereo-pairs and the newest Middlebury 3 high resolution dataset, which has sepa-rate training and testing stereo-pairs. Furthermore, stereo-pairs from the EPFL multi-view datasets of external architectural sce-nes† were chosen for evaluating the proposed approach. Finally, it is noted that the KITTI datasets‡ provide a series of images of urban driving scenes. On the evaluation sites new stereo-match-ing algorithms are bestereo-match-ing constantly reported.
*http://vision.middlebury.edu/stereo/data/
†http://cvlabwww.epfl.ch/data/multiview/denseMVS.html ‡http://www.cvlibs.net/datasets/kitti/eval_stereo.php
In this paper, an improved approach of the Semi-Global Match-ing (SGM) algorithm is presented, which eliminates the need for scenario-specific tuning of the SGM penalty parameters. Thus, its main contribution is that it introduces a method for au-tomatically estimating penalties P1 and P2 of SGM and methods derived from it. This is achieved after computing certain stati-stical properties of the Disparity Space Image (DSI), which is estimated during the matching cost computation. The presented method of self-adjusting penalties (SGM-SAP) was evaluated using internal stereo-images from the Middlebury online evalu-ation platform datasets, as well as images from external archi-tectural scenes selected from the EPFL multi-view datasets.
Next, Section 2 reviews the specifics of SGM and penalty defi-nitions; Section 3 analyses the process of self-adjusting of the penalty values; Section 4 evaluates the results of our tests; the paper is concluded with final remarks and possible future tasks.
2. SEMI-GLOBAL MATCHING AND PENALTIES
Semi-global matching (Hirschmüller, 2005, 2008) is among the top-ranking dense matching algorithms. Its main advantages are accuracy, computational efficiency and simplicity in implemen-tation when compared to high performance global and local me-thods. Consequently, it is used in stereo as well in multi-view stereo scenarios from real-time to large-scale satellite applica-tions. In this Section, the SGM algorithm is briefly reviewed for the purposes of completeness, and some variations relevant to this work are presented.
SGM is employed in the optimization step, as it defines a global 2D energy function E that depends on the disparity map D:
( )
The global function contains a data term C(p, D(p)) as well as a smoothness term for each pixel p. The latter adds a penalty P1 or P2 to each pixel q in the neighbourhood Np of p, if the dispa-rity of q differs by 1 or more pixels from the dispadispa-rity of p, re-spectively. SGM suggests approximating the global function by following 1D paths L in several directions r through the image:
(
)
(
)
pixel p(x,y) and every x-disparity d is estimated from the sum of three terms. The first two are the matching cost C(p,d) and the minimum path cost of the preceding pixel (p-r); the latter is computed after comparison of the path costs of the previous pi-xel in the same (d), the lower (d-1), the higher (d+1) or all the disparity range (i), while taking into consideration penalties P1 and P2. Finally, the minimum path cost of the preceding pixel is subtracted. P1 penalizes slightly slanted surfaces, P2 penalizes discontinuities. The costs from all paths Lr(p,d) are summed up to each pixel for all possible disparities, resulting in the aggre-gated cost S(p,d):(
)
r(
)
r
S p,d =
∑
L p,d (3)The optimal disparity for each pixel is chosen by the WTA stra-tegy on S, thus creating the final disparity map DL(p):
( )
(
(
)
)
L
d
D p =argmin S p,d (4)
Since the introduction of SGM several variations or extensions have emerged, aiming at improving its performance, computa-tional efficiency, or both. SGM is also implemented in real-time on a variety of platforms, i.e. FPGA or GPU. Moreover, thanks to its implementation in OpenCV, many algorithms use SGM as part of their stereo matching procedure. Recently, non-local me-thods (Huang et al., 2016) have also introduced cost-aggrega-tion approaches similar to that of SGM; two iteracost-aggrega-tions are need-ed for the image-guidneed-ed non-local matching cost computation, and afterwards the estimated cost is optimized via SGM.
Regarding the definition of cost penalties, a class of SGM varia-tions is dedicated to the development of funcvaria-tions for the ad-justment of penalty P2, which is imposed on disparity changes between neighbouring pixels larger than 1 pixel; they have been reviewed in detail by Stentoumis et al. (2015). These penalty functions are based on the fact that, if the intensity change be-tween pixel p and the preceding one in path L is high and the disparity change between them is larger than 1, the existence of actual edges or object boundaries is highly probable. Hirsch-müller (2005) has firstly introduced an adaptive penalty func-tion. The function was created by dividing P2 with the intensity gradient of neighbouring pixels in the reference image for each path, while checking that P2≥ P1. Besides, Banz et al. (2012) evaluated the performance of three more penalty functions for P2 and the case of constant penalty, which is fixed to an empiri-cally defined value. The proposed penalty functions were: ne-gatively (P2n) and inversely (P2i) proportional to the absolute in-tensity gradient of the currently processed pixels along the path; and negatively proportional (P2v) to the variance of intensity in a local window. A lower bound P2min was introduced to guaran-tee that P2≥ P1.
A challenging aspect of SGM implementation is obviously the selection of values for the penalties. If parameters have not been properly tuned, the performance of the algorithm may not be as efficient as expected. In fact, penalty adjustment is needed for every different pair of images or, if a different matching cost method is used, even for the same stereo-pair. In this paper, we introduce a method for automatically estimating penalties P1 and P2. This follows the computation of certain simple statisti-cal properties from the DSI volume which is created in the pre-vious step of cost calculation. Therefore, penalties are consider-ed as being self-adjustconsider-ed to the particular stereo-pair, in relation to the cost function used.
To our knowledge, no method for the automatic estimation of penalties of SGM has been proposed up to now – with the ex-ception of Chuang et al. (2016), where however a specific cost function was used, the penalties were extracted after the cre-ation of an initial disparity map from only two costs of each pi-xel (the lowest and the second lowest), and the evaluation was based on only four image pairs.
3. SELF-ADJUSTING PENALTY VALUES
The idea behind extracting the values for the SGM penalties from the DSI itself originates from the fact that penalties P1, P2 are actually costs that influence the pixel-wise matching cost C.
Cost penalties are added to each pixel’s initial cost C(p,d) de-pending on the disparity d, so their values should be related to this initial cost. In the proposed method penalties are derived
In the above equations, W and H are the width and height of the base image; Nd is the number of disparity labels; and N is the number of image pixels. The minimum matching cost Smin(x,y) of a pixel over all labels l is subtracted from all potential costs S(x,y,l) in order to normalize the DSI values per pixel. Finally, the mean value cost per all pixels corresponds to penalty P1, while the maximum value cost per all pixels corresponds to pe-nalty P2. Of course, in this way it is ensured that P2>P1. The
importance of such a definition for the penalties is that they are estimated, without user intervention, from the DSI itself; thus,
the self-adjusting penalties remove the need for the convention-al, time-consuming tuning step. Appropriate penalty values will be automatically derived, regardless of the stereo-pair, or the matching cost used. Furthermore, no training datasets of stereo-pairs will be needed for penalties estimated from them to be ap-plied to testing stereo-pairs under an assumed scenario of many similar images. Moreover, these self-adjusting penalties are not computationally expensive. In conclusion, for every stereo-pair the penalties for SGM, or every SGM-like method, can be esti-mated solely from the DSI, regardless of the matching cost em-ployed and the existence of a ground truth disparity map or of multiple data for training.
In the cost calculation step, common cost functions such as Ab-solute Difference (AD) of intensities, or Census transform with a 7x7 window were used. Next, SGM was used for cost optimi-zation. The WTA strategy is adopted during the disparity opti-mization step for acquiring the initial disparity map. Finally, disparity refinement is possible, e.g. with the use of photo-con-sistency, sub-pixel disparity interpolation, or median filtering.
4. RESULTS
The presented algorithm has been evaluated on the 15 training stereo image pairs of quarter-size resolution from Middlebury Stereo Evaluation – Version 3 (Scharstein et al., 2014), and also on the 21 quarter-size stereo image pairs of 2006 datasets from Middlebury College. The algorithm has also been tested using an EPFL multi-view dataset with external architectural scenes (Strecha et al., 2008). All processes have been implemented in the Matlab programming environment.
4.1 Middlebury 2014 datasets
The Hamming distance on Census transformed images was used as the initial matching cost. Next, penalties P1 and P2 for SGM were estimated via the suggested method and were employed to the SGM algorithm. In Table 1 the computed penalties for each stereo-pair are shown.
Stereo-pairs Penalties
P1 P2
Adirondack 15.2 47
ArtL 15.0 47
Jadeplant 15.2 47
Motorcycle 16.0 47
MotorcycleE 16.1 47
Piano 14.2 47
PianoL 14.2 47
Pipes 15.5 47
Playroom 15.8 47
Playtable 15.6 47
PlaytableP 16.0 47
Recycle 15.7 47
Shelves 13.2 47
Teddy 15.0 47
Vintage 15.7 47
Table 1. Penalties estimated by the SGM-SAP method for each stereo-pair of the Middlebury 2014 dataset.
The initial disparity map was derived by the WTA strategy. Fi-nally, sub-pixel disparities are estimated by a sequential dispa-rity interpolation and 7x7 median filtering for smoothing with outlier tolerance. The error percentage is computed by compar-ing each resultcompar-ing disparity value of non-occluded pixels with the corresponding ground truth value, while applying an error threshold of 0.5 pixel. This threshold value was chosen because the default value used in Middlebury online evaluation platform
is 2.0 pixels for full image resolution, which corresponds to a threshold of 0.5 pixel for quarter-size images.
In Fig. 1 some results of the method are seen for three represen-tative stereo pairs as far as the size of matching error is con-cerned. The strong impact of sub-pixel interpolation on the dis-parity map can be noted, which is mainly due to the fact that the raw algorithm estimates integer disparities, whereas a 0.5 pixel error threshold is used. A considerable effect is also achieved by denoising via a median filter with large kernel.
The estimated disparity maps of training images were submitted to the Middlebury benchmark evaluation page (Fig. 2), resulting in an error of 22.8% and the 34th position for non-occluded pi-xels and a 2.0 pixel error threshold (date of evaluation: January 22, 2017). The image pairs displaying the best performance we-re Playtable (28th position) and Vintage (32th position), whereas those of poorest performance were ArtL (43th position), Pipes and PlaytableP (42th position).
Compared to the original SGM algorithm (Hirschmüller, 2008) and its results submitted in the Middlebury platform, our me-thod presents an error higher only by 1.8%, and it is only 3 po-sitions lower in the evaluation list. Playtable and Vintage show lower errors (35% to 38.8% and 40.6% to 41.1%, respectively), whereas Jadeplant and ArtL show the highest errors compared to those of Hirschmüller (31.9% to 26.4% and 18.8% to 15%, respectively). The errors of stereo the pairs for both methods as well as their ranking are presented in Fig. 3.
Figure 1. Estimated disparity maps using SGM-SAP. Left: disparity maps without any refinement; centre: sub-pixel interpolation;
right: median filtering. Differences above 0.5 pixel from the ground truth are highlighted in green. Top to bottom: Motorcycle, PlaytableP and Jadeplant stereo-pairs.
Figure 2. Results from the Middlebury evaluation platform for the training images of the 2014 dataset. The results of the self-adjusting penalty method (SGM-SAP) are highlighted in red.
Figure 3. Errors for all stereo-pairs (left) and ranking in Middlebury benchmark (right) for SGM and our method (SGM-SAP).
Finally, it is noted that, compared to our method, in the original SGM algorithm additional refinements are being used, such as left-right consistency or removal of disparity segments smaller than 100 pixels, whereas median filtering is not applied.
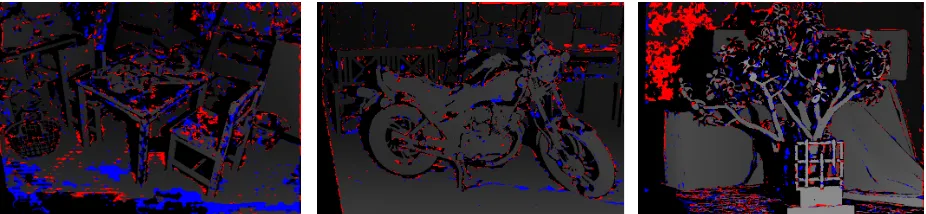
In Fig. 4 disparity maps are seen, in which differences in errors when compared to ground truth between the original SGM and our method are highlighted. Pixels whose disparity difference against ground truth is larger than 0.5 pixel if original SGM is applied but less than 0.5 if our method is used are highlighted in blue. Pixels whose disparity difference compared with ground truth is above 0.5 pixel if our method is applied but below 0.5 if the original SGM is used are highlighted in red. It is observed that, ignoring small artifacts produced by either method, our method outperforms SGM in slightly slanted surfaces (e.g. floor of Playtable or Motorcycle), but performs less well in areas of low texture (e.g. in the background of the Jadeplant
stereo-pair).
Finally, additional experiments regarding the suggested method were conducted and evaluated on the Middlebury 2014 datasets. In particular, the median instead of the mean value was used as far as the estimation of penalty P1 is concerned. The differences in the total error of 15 pairs regarding the initial method were negligible (0.01%). Furthermore, when a 9x7 window is used for Census transform (as in the original SGM algorithm) before the penalty adjustment, the error is the same regarding the ini-tial disparity maps and by 0.4% higher after refinements. Besides, after the automatic estimation of both penalties by our method, a penalty function proposed by Hirschmüller (2005) was tested for the adjustment of penalty P2 to the intensity gra-dient. The estimated disparity map appeared as noisier and ini-tially showed an error higher by 2%, which after disparity re-finement was reduced to 0.8%.
Figure 4. Disparity maps of the suggested method (from left to right: Playtable, Motorcycle and Jadeplant stereo pairs). Pixels in blue indicate errors of SGM algorithm which do not exist in our method; pixels in red depict errors of our method not present in
SGM.
4.2 Middlebury 2006 datasets
For this case, Absolute Differences of intensities and Hamming distance on Census-transformed images were used as cost me-trics. Subsequently, penalties P1 and P2 for SGM were compu-ted from the proposed method and were applied to the SGM al-gorithm. The initial disparity map has been created in the WTA mode.
The overall error for the 21 pairs was compared against the er-rors obtained from the same method without automatic penalty estimation, namely by using the optimal parameters of a tuning process (Stentoumis et al., 2015). The error percentage is calcu-lated after the comparison of each resulting disparity value in non-occluded areas with the corresponding ground truth value, while an error threshold of 1 pixel is applied. The error of our method was higher by only 0.87% (11.89% to 11.02%) when the Census metric served as cost function and by 2.27% higher (25.72% to 23.45%) when Absolute Differences were applied. Therefore, it is concluded that the proposed method is expected to work well for any matching cost function.
In Table 2 the estimated (SGM-SAP) penalty values for two matching costs are seen against the values derived by the tuning process for each individual stereo-pair. Optimal penalties [P1, P2] which lead to the minimum of the mean errors over all ste-reo-pairs are [10,100] from the tuning of AD-SGM method, while for Census-SGM method these are [25,100].
Stereo-pair
AD Census
SGM-SAP Tuning SGM-SAP Tuning P1 P2 P1 P2 P1 P2 P1 P2
Aloe 40 243 15 70 17 47 10 50
Baby1 21 203 10 100 15 47 10 50
Baby2 24 242 20 250 15 47 25 100
Baby3 20 203 20 130 15 47 10 50
Bowling1 32 250 20 70 14 47 25 100
Bowling2 31 224 10 250 15 47 10 100
Cloth1 32 220 15 100 18 47 25 250
Cloth2 32 251 15 70 17 47 10 50
Cloth3 37 246 15 70 17 47 10 50
Cloth4 43 246 20 100 17 47 10 50
Flowerpots 28 181 20 250 14 47 10 50
Lampshade1 25 236 10 70 13 47 40 150
Lampshade2 24 243 5 70 13 47 55 150
Midd1 28 234 15 70 12 47 70 150
Midd2 27 228 15 100 12 47 70 150
Monopoly 29 229 35 220 13 47 25 100
Plastic 21 207 15 220 11 47 25 150
Rocks1 26 189 15 100 16 47 10 50
Rocks2 31 227 25 160 17 47 10 50
Wood1 21 180 10 160 16 47 5 200
Wood2 19 219 30 70 14 47 10 50
Table 2. Penalty values extracted from the tuning process and the values estimated by the suggested SGM-SAP method for each stereo-pair of Middlebury 2006 (using two cost metrics).
Figure 5. Disparity maps derived from a tuning process (top row) and the suggested method (bottom row). From left to right: stereo-pairs Monopoly, Flowerpots, Lampshade1, Lampshade2. In the first two our method (with the use of AD and Census as matching
costs) has the best performance; in the other two the optimal parameters of tuning perform best concerning the estimated errors.
In Fig. 5 representative results are seen. In particular, the dispa-rity maps of pairs in which lower errors are obtained with the penalties of our method and the corresponding disparity maps which use the optimal parameters of tuning are shown. On the other hand, the disparity maps of pairs in which lower errors are achieved with the estimated parameters of tuning and the cor-responding disparity maps which use the penalties of the propo-sed method are displayed. Both methods employ Absolute Dif-ferences and Census as matching costs. As it may be observed, our method performs better in slanted surfaces with adequate texture (e.g. the Monopoly board or the surface of a flowerpot in the corresponding pair). However, its performance lags be-hind SGM when matching surfaces are of low texture (e.g. the
magazine box and the foreground object in the Lampshade1 and
Lampshade2 pairs).
4.3 Herz-Jesu-K7 dataset
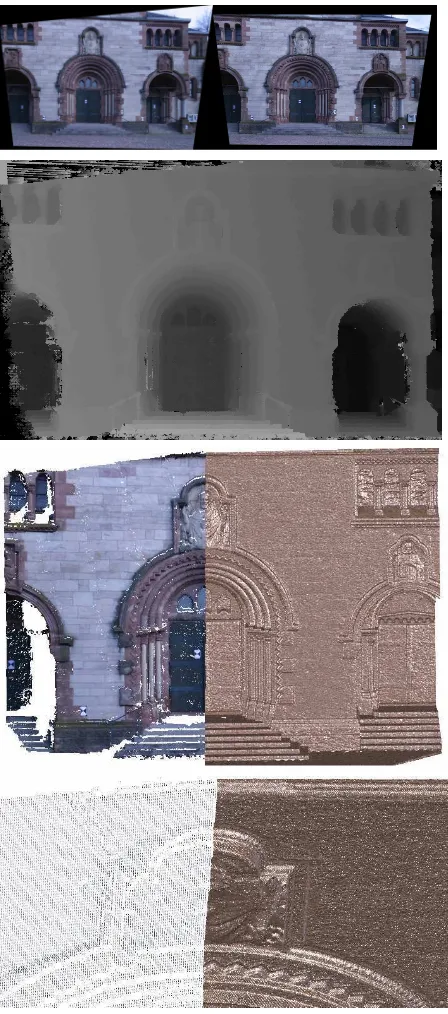
The Herz-Jesu-K7 pair (6 Mpixel images: 0006.png, 0007.png) in quarter-size resolution was used as a scenario of an architec-tural scene. In the cost calculation step the Hamming distance on Census-transformed images was computed. Penalties P1 and P2 for SGM were then estimated with the proposed method and were used for the SGM algorithm. In Table 3 the computed pe-nalties for each pair are seen. The initial disparity map was deri-ved by WTA strategy. Finally, erroneous disparities are
fied via the left-right consistency check. Fig. 6 shows the epipo-lar images of Herz-Jesu-K7 and the estimated disparity map.
Stereo-pair Penalties
P1 P2
Left-to-right 12.6 47
Right-to-left 13.1 47
Table 3. Penalty values for the stereo-pair of Herz-Jesu-K7 estimated by the suggested method.
Figure 6. Results of SGM-SAP on the Herz-Jesus stereo-pair.
Top: epipolar images of the stereo-pair; 2nd row: estimated
disparity map of the base image; 3rd row: registration of the
reconstructed point cloud onto the ground truth data; bottom: detail of the registration between the laser scanner point cloud
and the image-based reconstructed model.
The accuracy of reconstruction can be estimated after registra-tion of the generated point cloud onto the ground truth data (ob-tained by laser scanning) via the ICP algorithm. It is noted that first some minor pre-processing of the point cloud was conduc-ted (only the object of interest was kept). The overall mismatch is represented by an average distance of 25 mm and a standard deviation of 20 mm. If reduced to mean image scale, these va-lues correspond to ~1.1 and ~1.1 pixel, which are considered as satisfactory. In Fig. 6 an image of the result of the registration is shown, while a detail of the reconstruction is also illustrated.
5. CONCLUSIONS
This work has presented a novel approach (SGM-SAP) aiming at the self-adjustment of penalty values of Semi-Global Match-ing for any image pair for any matchMatch-ing cost method. This is achieved by the automatic estimation of the penalties through a simple process with low computational requirements, relying on the Disparity Space Image (DSI) volume, which has been al-ready computed in the previous step of the matching process. Therefore, no tuning of penalties is needed and no dataset of similar images with corresponding ground truth disparity maps has to be available. The proposed method has been evaluated on the challenging Middlebury-Version 3 stereo-pairs, as well as on Middlebury 2006 datasets. Results show that the percentages of errors of the estimated disparity maps from SGM-SAP are competitive to the results from the typical SGM approach (in essence they differ by only ~2%). The significance of the pro-posed method of self-adjusting penalties is that in existing ap-plications of SGM the values of these penalties are generally being estimated after a time-consuming tuning process.
Future work includes attempts for further improvements of the method and testing it with the use of other matching cost me-thods or SGM-like approaches. Furthermore, evaluation of the suggested method on more complex or outdoor scenes, e.g. on the KITTI dataset, will be conducted in the near future.
REFERENCES
Banz C., Pirsch P., Blume H., 2012. Evaluation of penalty func-tions for Semi-Global Matching cost aggregation. ISPRS Inter-national Archives of the Photogrammetry, Remote Sensing and Spatial Information Sciences, XXXIX-B3, pp. 1–6.
Chuang T.Y., Ting H.W., Jaw J.J., 2016. Hybrid-based dense stereo matching. ISPRS International Archives of the Photo-grammetry, Remote Sensing and Spatial Information Sciences, XLI-B3, pp. 495–501.
Georgousis S., Stentoumis C., Doulamis N., Voulodimos,A., 2016. A hybrid algorithm for dense stereo correspondences in challenging indoor scenes. IEEE International Conference on Imaging Systems and Techniques (IST). IEEE, pp. 460–465.
Hirschmüller H., 2005. Accurate and efficient stereo processing by semi-global matching and mutual information. Proc. Compu-ter Vision and PatCompu-tern Recognition, pp. 807–814.
Hirschmüller H., 2008. Stereo processing by semiglobal match-ing and mutual information. IEEE Transactions on Pattern Ana-lysis and Machine Intelligence, 30, pp. 328–341.
Hu X., Mordohai P., 2012. A quantitative evaluation of confi-dence measures for stereo vision. IEEE Transactions on Pattern Analysis and Machine Intelligence, 34, pp. 2121–2133.
Huang X., Zhang Y., Yue Z., 2016. Image-guided non-local dense matching with three-steps optimization. ISPRS Annals of Photogrammetry, Remote Sensing and Spatial Information Sci-ences, III-3, pp. 67–74.
Li X., Liu J., Chen G., Fu H., 2016. Efficient methods using slanted support windows for slanted surfaces. IET Computer Vision, 10(5), pp. 384–391.
Luo W., Schwing A.G., Urtasun R., 2016. Efficient deep learn-ing for stereo matchlearn-ing. IEEE Conference on Computer Vision and Pattern Recognition, pp. 5695–5703.
Scharstein D., Hirschmüller H., Kitajima Y., 2014. High-reso-lution stereo datasets with subpixel-accurate ground truth, Ger-man Conference on Pattern Recognition. Springer, pp. 31–42.
Spyropoulos A., Mordohai P., 2015. Ensemble classifier for combining stereo matching algorithms. IEEE International Con-ference on 3D Vision, Lyon, pp. 73–81.
Stentoumis C., Karkalou E., Karras G., 2015. A review and eva-luation of penalty functions for Semi-Global Matching. IEEE International Conference on Intelligent Computer Communica-tion and Processing, Cluj-Napoca, pp. 167–172.
Strecha C., von Hansen W., van Gool L., Fua P., Thoennessen U., 2008. On benchmarking camera calibration and multi-view stereo for high resolution imagery. IEEE Computer Vision and Pattern Recognition.
Szeliski R., 2011. Computer Vision, Texts in Computer Scien-ce. Springer, London.
Tombari F., Mattoccia S., di Stefano L., Addimanda E., 2008. Classification and evaluation of cost aggregation methods for stereo correspondence. IEEE Computer Vision and Pattern Recognition.
Wang Z.-F., Zheng Z.-G., 2008. A region based stereo match-ing algorithm usmatch-ing cooperative optimization. Computer Vision and Pattern Recognition.
Yang Q., 2012. A non-local cost aggregation method for stereo matching. IEEE Conference on Computer Vision and Pattern Recognition. pp. 1402–1409.
Yang Q., Wang L., Yang R., Stewénius H., Nistér D., 2009. Stereo matching with color-weighted correlation, hierarchical belief propagation, and occlusion handling. IEEE Transactions on Pattern Analysis and Machine Intelligence 31, pp. 492–504.
Zbontar J., LeCun Y., 2015. Computing the stereo matching cost with a convolutional neural network. IEEE Conference on Computer Vision and Pattern Recognition, pp. 1592–1599.
Zhang K., Fang Y., Min D., Sun L., Yang S., Yan S., Tian Q., 2014. Cross-scale cost aggregation for stereo matching. IEEE Conference on Computer Vision and Pattern Recognition, pp. 1590–1597.