GEOGRAPHY MATTERS IN ONLINE HOTEL REVIEWS
Mingshu Wang a, Xiaolu Zhou b
a University of Georgia, Athens, GA, USA, 30605 - [email protected] (corresponding author) b Georgia Southern University, Statesboro, GA, USA, 30460 - [email protected]
KEY WORDS: User-generated Contents, Volunteered Geographic Information, Customer Satisfaction, Spatial Model
Commission IV, WG IV/6
ABSTRACT:
In resonance with the popularity of user-generated contents (UGC) and the volunteered geographic information (VGI), this study crowdsourced 77,098 hotel reviews of 220 hotels provided by U.S. reviewers in the city of San Francisco, 2002 to 2015. In this exploratory analysis, we have revealed that there is spatial dependence of customer satisfaction at different locations (of hotels), which violates the assumption that ordinary least-square (OLS) is the best linear unbiased estimator (BLUE); therefore, spatial model might be required for analysing any antecedents and consequences of such phenomena. These results have implications in marketing and management strategies.
1. INTRODUCTION
In the deluge of social media, user-generated contents (UGC) created by customers and volunteered geographic information (VGI) produced by citizens has formulated a new mode of knowledge generation through crowdsourcing (Wang, 2015; Zhou et al., 2015; Zhou and Zhang, 2016). For instance, UGC provide new avenues to better understand travel behaviour at different spatiotemporal scales (Wang et al., 2016; Zhou et al., 2016). Meanwhile, customer satisfaction is one of the most widely known customer metrics studied by researchers and applied by firms. UGC also provides critical information about brand, products and firm stock performance (Nam and Kannan, 2014; Xiong and Bharadwaj, 2014).
During the past decades, the incorporation of spatial models has become a new research area in marketing. As stated by Bradlow et al. (2005), spatial models allow for correlations in response to variables across individuals, they represent an entirely new way to understand decision processes. In resonance with this wave, this exploratory study tested whether geography matters in customer satisfactions of hotel industry at intra-city level based on data derived from TripAdvisor.com in the City of San Francisco, CA, USA.
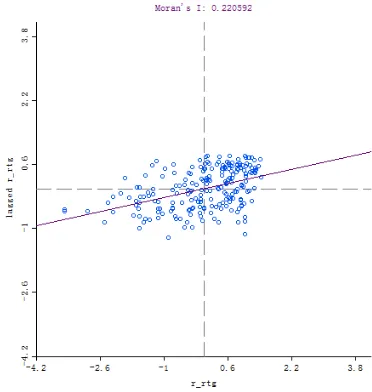
Through Moran’s I, we confirmed that there is spatial dependence among hotel customer satisfaction at intra-city level in the City of San Francisco, CA, USA. As customer satisfaction is usually treated as dependent variable in empirical modelling approaches, such finding informs the potential violation in regard to ordinary least-square (OLS) as the best linear unbiased estimator (BLUE). Therefore, spatial model might be required for analysing any antecedents and consequences of such phenomena.
The rest of this paper is organized as follows. The following section introduces our data and data cleaning strategies. Section 3 summarizes our measures and proposed methods. Section 4 combines empirical findings and discussions. Finally, the last section concludes with practical implications.
2. DATA
We have crowdsourced a total number of 172,050 hotel reviews from 223 hotel in the city of San Francisco, CA during 9/22/2002 to 9/30/2015 from TripAdvisor.com. TripAdvisor is not only an early adopter of UGC but also one of the largest travel site in the world, with more than 60 million members and over 170 million reviews and opinions of hotels, restaurants, attractions and other travel-related businesses around the world. TripAdvisor conducts quality check of each review. For example, TripAdvisor scrutinizes IP address and email address of the author, and tries to detect any suspicious patterns, obscene, or abusive language rather than post reviews to the website instantly. It also enables the community of users to report suspicious content, which is then assessed by a team of quality assurance specialists, and TripAdvisor alerts the owner or manager of a TripAdvisor-listed establishment whenever a review is posted on their listing. These features allow the relative high quality of review contents compared to other sources of UGC. To date, data from TripAdvisor have been used by a couple of marketing studies (Ghose et al., 2012; King et al., 2014; Zhang et al., 2015).
We then have cleaned and removed (1) hotels without any reviews; (2) incomplete review records (reviews without explicit
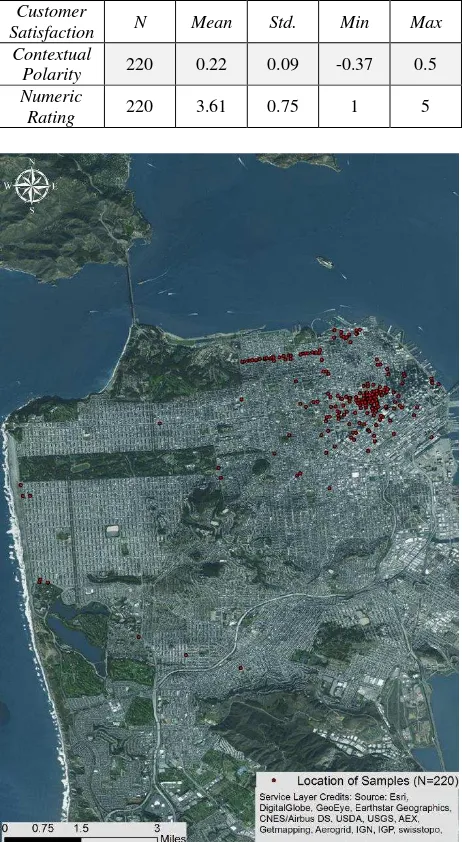
review rating, review context or reviewer’s address). Finally, to control differences in international cultural and political backgrounds, we remove reviews provided by self-identified international reviewers. The final dataset is composed of 77,098 reviews from by United States reviewers in 220 hotels (Figure 1). All data were collected at individual review level for each hotel. As the unit of analysis of this study is hotel, we aggregated all measures at hotel level.
3. MEASURES AND METHODS
3.1 Measures
We use sentiment analysis with natural language processing toolkit and define customer satisfaction as the contextual polarity of the review content. Polarity is defined as a continuous variable, ranging from -1 to 1, where 0 denotes neutral. While positive polarity shows positive sentiment, negative value denotes negative sentiment. Additionally, the numeric rating score of
The International Archives of the Photogrammetry, Remote Sensing and Spatial Information Sciences, Volume XLI-B2, 2016 XXIII ISPRS Congress, 12–19 July 2016, Prague, Czech Republic
This contribution has been peer-reviewed.
each review is obtained as a five-point Likert scale, where one indicates the least satisfactory and five indicates the most satisfactory review.
The descriptive statistics of our two measures (polarity and number hotel rating scores) from UGC in shown in Table 1. The contextual polarity ranges from -0.37 to 0.5, with an average number of 0.22; while the generic numeric score spans from 1 to 5, with a mean value of 3.61. There is a high degree of consistency between the contextual polarity and numeric rating score, measured by Pearson’s product-moment correlation coefficient (R = 0.86).
Table 1. Descriptive Statistics for the Average Scenario.
Customer
Figure 1. Geographical distribution of the 220 hotels in this study, San Francisco, CA, USA.
3.2 Methods
The prevalent method of OLS estimator is recognized as a Best Linear Unbiased Estimator (BLUE). In order to maintain property and make valid statistical inferences about the population form the beta coefficients, the following assumptions have to be held: (1) the error term has mean zero; (2) the error term are uncorrelated and have a constant variance (homoscedasticity); (3) the error term follows a normal
distribution. However, in many marketing situations, including abovementioned cases, the value in one location often depends on the values observed at neighbouring locations. First, data collection process may incur measurement error when associated with spatial units. For example, when the administrative boundaries for collecting information do not accurately reflect the nature of the underlying sample data generating process. Second, the spatial dimension of social and economic processes may be an important aspect of the models. For example, given that location and distance are important forces at work, regional science theory relied on notions of spatial interaction and diffusion effects, hierarchies of place and spatial spill-overs.
There are two primary types of spatial dependence. First, spatial error model (SEM), where error term across different spatial units are correlated. With spatial error in OLS estimator, the assumption of uncorrelated error terms is violated. As a result, the estimates are inefficient. Spatial error is indicative of omitted spatially corrected covariates that if left unattended would affect inference. SEM has been widely applied to econometrics, regional science and marketing research (Anselin, 2002; Bronnenberg, 2005; Cressie, 2015).
Second, spatial autoregressive (lag) model (SAM), where the dependent variable Y in place i is affected by the independent variables in both place i and j. With spatial lag in OLS estimator, the assumption of uncorrelated error terms is violated. Additionally, the assumption of independent observations is also violated. As a result, the estimated are both inefficient and biased. Spatial lag may suggest a diffusion process— events in one place predict an increased likelihood of similar events in neighbouring places. SAM is more likely to be applied to inform consumer behaviour studies (Manchanda et al., 1999; Wedel and Pieters, 2000; Bradlow et al., 2005).
Before deciding handling spatial dependence using SEM or SAM, it is required to confirm the existence of spatial dependence, which is the main goal for this exploratory analysis. Detecting spatial dependence through spatial autocorrelation can tell us whether clusters of similar values across geographic space (positive spatial autocorrelation) or dissimilar values occurring near one another (negative spatial autocorrelation). Typical spatial autocorrelation statistics include Moran’s I (Moran, 1950), Geary’s C (Geary, 1954), Getis’s G (Getis and Ord, 1992), etc. Amongst all of these statistics, Moran’s I has the longest history and has been the most widely used (Wang and Armstrong, 2009; Lloyd, 2010; Huang and Wei, 2014; Luo, 2014). Therefore,
Moran’ I is applied in this study to test the existence of spatial dependence in hotel customer satisfactions at intra-city level.
For n observations on a variable x at location (i, j), Moran’s I is
are the elements of the spatial weight matrix;
0
S
is the sum of the elements of the spatial weight matrix:
0 ij
i j
S
w
.
The International Archives of the Photogrammetry, Remote Sensing and Spatial Information Sciences, Volume XLI-B2, 2016 XXIII ISPRS Congress, 12–19 July 2016, Prague, Czech Republic
This contribution has been peer-reviewed.
Spatial weights matrix reflects the intensity of the geographic relationship between observations in a neighborhood.
4. RESULTS AND DISCUSSIONS
The results of Moran’s I from both measures are plotted in Figure 2. There exists moderate positive spatial autocorreltion of hotel customer satisfactions of study area.
Based on the Moran’s I, hotels with high customer satisfaction
are spatially clustered with other highly customer-satisfied hotels. Therefore, location strategy of hotel is critical. Similar to general firms, hotels will locate to maximize their net spill-overs
as a function of locations’ knowledge activity, their own capabilities, and competitors’ anticipated actions (Alcácer and Chung, 2007).
Importantly, these findings also inform when using customer satisfaction as dependent variable for empirical analysis of antecedents and consequences, the presence of spatial dependence is potential violate the BLUE assumption of OLS. Therefore, SAM and/or SEM might be required to any further substantive analysis.
5. CONCLUSION
Customer satisfaction has been widely studied by researchers and applied by firms. The prevalence of UGC and VGI helps customers and firms. This paper applied both sentiment analysis derived contextual polarity with natural language processing and numeric rating scores to confirm that spatial dependence exists and geography maters in online hotel reviews. Measured by
Moran’s I, we have confirmed that highly-rated hotels are clustered and location does matter. In the future, SAM and/or SEM can be used to unveil more insights of the antecedents and consequences related to customer satisfaction at both intra-city and inter-city scales.
Figure 2. Results of Moran’s I.r_plr denotes contextual polarity; r_rtg denotes numeric rating scores.
REFERENCES
Alcácer, J., Chung, W., 2007, Location Strategies and Knowledge Spillovers, Management Science
53(5):760-776.
Anselin, L., 2002, Under the hood: issues in the specification and interpretation of spatial regression models,
Agricultural economics27(3):247-267.
Bradlow, E. T., Bronnenberg, B., Russell, G. J., Arora, N., Bell, D. R., Duvvuri, S. D., Ter Hofstede, F., Sismeiro, C., Thomadsen, R., Yang, S., 2005, Spatial models in marketing, Marketing Letters16(3-4):267-278. Bronnenberg, B. J., 2005, Spatial models in marketing research
and practice, Applied Stochastic Models in Business
and Industry21(4-5):335-344.
Cressie, N., 2015, Statistics for spatial data, John Wiley & Sons. Geary, R. C., 1954, The contiguity ratio and statistical mapping,
The incorporated statistician:115-146.
Getis, A., Ord, J. K., 1992, The analysis of spatial association by use of distance statistics, Geographical analysis
24(3):189-206.
Ghose, A., Ipeirotis, P. G., Li, B. B., 2012, Designing Ranking Systems for Hotels on Travel Search Engines by Mining User-Generated and Crowdsourced Content,
Marketing Science31(3):493-520.
Huang, H., Wei, Y. D., 2014, Intra-metropolitan location of foreign direct investment in Wuhan, China: Institution, urban structure, and accessibility, Applied Geography
47:78-88.
King, R. A., Racherla, P., Bush, V. D., 2014, What We Know and Don't Know About Online Word-of-Mouth: A Review and Synthesis of the Literature, Journal of
Interactive Marketing28(3):167-183.
Lloyd, C. D., 2010, Exploring population spatial concentrations in Northern Ireland by community background and other characteristics: an application of geographically weighted spatial statistics, International Journal of
Geographical Information Science24(8):1193-1221.
Luo, J., 2014, Integrating the Huff Model and Floating Catchment Area Methods to Analyze Spatial Access to Healthcare Services, Transactions in GIS18(3): 436-448.
The International Archives of the Photogrammetry, Remote Sensing and Spatial Information Sciences, Volume XLI-B2, 2016 XXIII ISPRS Congress, 12–19 July 2016, Prague, Czech Republic
This contribution has been peer-reviewed.
Manchanda, P., Ansari, A., Gupta, S., 1999, The “shopping basket”: A model for multicategory purchase incidence decisions, Marketing Science18(2):95-114.
Moran, P. A., 1950, Notes on continuous stochastic phenomena,
Biometrika:17-23.
Nam, H., Kannan, P., 2014, The informational value of social tagging networks, Journal of Marketing78(4):21-40. Wang, M., 2015, Crowdsourcing the landscape of cannabis
(marijuana) of the contiguous United States,
Environment and Planning A
10.1177/0308518x15598541.
Wang, M., Zhou, J., Long, Y., Chen, F., 2016, Outside the ivory tower: visualizing university students’ top transit-trip destinations and popular corridors, Regional Studies,
Regional Science3(1):202-206.
Wang, S., Armstrong, M. P., 2009, A theoretical approach to the use of cyberinfrastructure in geographical analysis,
International Journal of Geographical Information
Science23(2):169-193.
Wedel, M., Pieters, R., 2000, Eye fixations on advertisements and memory for brands: A model and findings, Marketing
science19(4):297-312.
Xiong, G., Bharadwaj, S., 2014, Prerelease buzz evolution patterns and new product performance, Marketing
Science33(3):401-421.
Zhang, J., Liu, Y., Chen, Y., 2015, Social Learning in Networks of Friends versus Strangers, Marketing Science
34(4):573-589.
Zhou, X., Xu, C., Kimmons, B., 2015, Detecting tourism destinations using scalable geospatial analysis based on cloud computing platform, Computers,
Environment and Urban Systems54:144-153.
Zhou, X., Yu, W., Sullivan, W. C., 2016, Making pervasive sensing possible: Effective travel mode sensing based on smartphones, Computers, Environment and Urban
Systems58:52-59.
Zhou, X., Zhang, L., 2016, Crowdsourcing functions of the living city from Twitter and Foursquare data, Cartography
and Geographic Information Science
10.1080/15230406.2015.1128852:1-12.
The International Archives of the Photogrammetry, Remote Sensing and Spatial Information Sciences, Volume XLI-B2, 2016 XXIII ISPRS Congress, 12–19 July 2016, Prague, Czech Republic
This contribution has been peer-reviewed.