COMERCIAL BANKS PERIOD 2004-2010)
BACHELOR THESIS
Submitted as a requirement to complete Bachelor Degree (S1) at Bachelor Program of Economic Faculty
Diponegoro University
Written by:
MOH. ROMIZUL FIKRI NIM. C2A 008 101
ECONOMIC FACULTY
DIPONEGORO UNIVERSITY
ْ
ﺮ ﺎﻋ
ْوأ
ْﺮﻏ
ﻚ ﺄآ
ﺎ ْﺪ ا
ﻓ
.
لْﻮ
ﺎ ﻬْﻋ
ﷲا
ﺿر
ﺮ ﻋ
ْا
نﺎآو
:
ْ ْ أ
اذإ
ْ
ﻼﻓ
ﻚ ﺎ
ْ و
،ﻚﺿﺮ
ﻚ
ْ
ْﺬ و
،ءﺎ ْا
ﺮﻈ ْ
ﻼﻓ
ْ ْ أ
اذإو
،حﺎ ا
ﺮﻈ
ﻚ ْﻮ
.
]
يرﺎ ا
اور
[
Dari Ibnu Umar radhiallahuanhuma berkata : Rasulullah Shallallahu’alaihi wasallam memegang pundak kedua pundak saya seraya bersabda : Jadilah engkau di dunia seakan-akan
orang asing atau pengembara “, Ibnu Umar berkata : Jika kamu berada di sore hari jangan tunggu pagi hari, dan jika kamu berada di pagi hari jangan tunggu sore hari, gunakanlah
kesehatanmu untuk (persiapan saat) sakitmu dan kehidupanmu untuk kematianmu “
(Riwayat Bukhori)
“When life give you lemons, make lemonades – make the best of what we already have”
“Khairun Naasi Man Yanfau’hu Lin Naasi – The best people is who always giving benefit to the surrounding”.
This
thesis
is
granted
special
to
:
•
My
Family,
my
mom
and
dad.
I
love
you
so
much,
thanks
for
everything.
Tabak, et al. (2011), and Jokipii and Milne (2008). The model consists of 5 independent variables that are Return on Equity (ROEt-1), Non Performing Loan (NPL), Increment of Capital Buffer (IncrBUFF), Loans to Total Assets (VLOAN), and Bank’s Share Assets (BSA) and one dependent variable which is Capital Buffer (BUFF).
This study conducted for the period 2004-2010. The empirical result showed capital buffer is affected mainly by two variables: Non Performing Loand and Increment of Capital Buffer. NPL positive sign signaling that comercial banks adopt a conservative behavior and do not take risks. Return on Equity (ROEt-1) affected negaively to capital buffer, it is signaling that comercial banks in Indonesia may have unlimited acces to external capital and/or prefer their financing from equity. Loans to Total Assets (VLOAN) have negative and significant on influencing capital buffer, it also signaling that comercial banks in Indonesia use “bacward-looking” strategy by reducing their capital buffer during the boom of credit activities. Bank’s Share Assets (BSA) finding is supporting Too Big To Fail (TBTF) nature that suggest the large banks tend to maintain their capital buffer lower than small banks.
Penelitian ini bertujuan untuk menguji faktor-faktor yang mempengaruhi cadangan modal (BUFF) pada 16 bank komersial terbesar di Indonesia. Penelitian ini berdasarkan pada penelitian sebelumnya yaitu Ayuso, dkk. (2004), Tabak, dkk. (2011), dan Jokipii dan Milne (2008). Model ini terdiri dari 5 variabel independen yaitu Return on Equity (ROEt-1), Non Performing Loan (NPL) Increment of Capital Buffer (IncrBUFF), Loans to Total Assets (VLOAN), Banks' Share Assets (BSA) dan satu variabel dependen yaitu cadangan modal(BUFF).
Penelitian ini dilakukan untuk periode 2004-2010. Hasil empiris menunjukkan bahwa cadangan modal dipengaruhi terutama oleh dua variabel: Non Performing Loan dan Increment of capital Buffer. Pengaruh positif NPL menandakan bahwa bank di Indonesia mengadopsi perilaku konservatif dan cenderung tidak mengambil risiko. Return on Equity (ROEt-1) berpengaruh negatif dengan cadangan modal, hal ini menandakan bahwa bank-bank di Indonesia memiliki akses tak terbatas pada modal eksternal dan / atau lebih memilih pembiayaan dari ekuitas. VLOAN juga berpengaruh negatif dan tidak signifikan pada cadangan modal, hal ini menandakan bahwa bank di Indonesia menggunakan strategi "backward looking" dengan mengurangi cadangan modal selama periode booming dalam pendistribusian kredit. Penemuan terhadap Banks’ Share Assets setuju dengan teori “Too Big To Fail” (TBTF) yang menyatakan bahwa bank besar cenderung menjaga capital buffernya lebih rendah daripada pada bank kecil.
love. It’s only because of Allah’s grace that this final bachelor thesis titled The Determinants of Capital Buffers' Comercial Banks in Indonesia (Study on 16 Biggest Comercial Banks Period 2004-2010) can be finalized.
Writing this final assignment has given me a lot of learning. It was really challenging and fun, also seasoned with stressful experiences sometimes. It helps me to explore a wider horizon of behavioral science, which I enjoy the most. I am also indebted for the presence, support, advices, and love of many people. Therefore, I would like to thank:
1. Prof. Drs. H. Muhamad Nasir, M.Si, Akt, Ph.D as a Dean of Economic Faculty Diponegoro University Semarang, who has given a lot of support and hard work for the faculty development.
2. Erman Denny Arfianto, S.E., M.M., who helped me a lot with his thoughtful advices, ideas, and patient. I really appreciate the time and advices you have given to me, Sir.
University. Thank you for your support and spirit.
6. All lecturers who I cannot mention one by one. Thank you for the knowledge and wisdom.
7. My beloved parents Fatmawati and Drs. Abdul Ghofir, Mom and Dad thank you so much for every advices, support, sacrifice, warmth, prayer, learning and everything you have done for me.
8. My beloved brothers, M. Mirzam Salami and Yusril Arsyad. Thanks for everything, do the best for what you love and follow your passion.
9. My beloved second family in Semarang, Tante Emma Rusnawati, Om Timur Susilo Mirza, Leo Daroqutni (Mas Doni), Najad Ghazali (Mas Aga), and Naiza Rosalia (Mbak Nesha).
BACHELOR THESIS ORIGINALITY STATEMENT ... iii
MOTTO ... v
ABSTRACT ... vi
ABSTRAK ... vii
ACKNOWLEDGEMENT ... viii
LIST OF TABLE ... xiii
LIST OF FIGURE ... xiv
LIST OF APENCES ... xv
BAB I INTRODUCTION ... 1
1.1 Research Background ... 1
1.2 Problem Discussion and Research Question ... 12
1.3 Research Objectives ... 14
1.4 Research Benefit ... 14
1.5 Thesis Outline ... 15
BAB II LITERATURE REVIEW ... 17
2.1 Theoritical Backround ... 17
2.1.1 Bank’s Capital ... 17
2.1.2 Bank Regulation ... 18
2.1.3 The BASEL Agreement on International Capital Standar ... 20
2.1.7 The Other Determinants of Capital Buffer ... 34
2.1.7.1 Loans to Total Assets ... 34
2.1.7.2 Bank’s Share Assets ... 34
2.2 Previous Researchees ... 35
2.3 Research’s Model ... 47
2.3 Research’s Hyphoteshis ... 53
BAB III RESEARCH METHOD ... 55
3.1 Research Variables ... 55
3.1.1 Independent Variables ... 56
3.1.2 Dependent Variable ... 58
3.2 Population dan Sample ... 60
3.5.3 Goodness of Fit Test ... 67
BAB IV RESULT AND DATA ANALYSIS ... 68
4.1 Research Object Description ... 70
4.2 Descriptive Statistics ... 68
4.3 Data Analysis ... 72
4.2.1 Classical Assumptions Test ... 72
4.4 Regression Analysis ... 81
4.5 Interpretation and Result Discussions ... 84
BAB V CONCLUSSION ... 89
5.1 Conclussion ... 89
5.2 Theoretical Implications ... 90
5.3 Research Limitations ... 93
5.4 Suggestions ... 93
5.4.1 For Bankers ... 93
5.4.2 For Civitas Academica ... 95
5.4.2 For Future Research ... 95
REFERENCES ... 96
Table 1.1 Capital Buffer Ratios Banking in Indonesia (%) ... 6
Table 1.2 Financial Ratios (BUFF, CAR, and NPL) banks in Indonesia 7
Table 2.1 Summary of Previous Researches ... 41
Table 3.1 Operational Definition ... 59
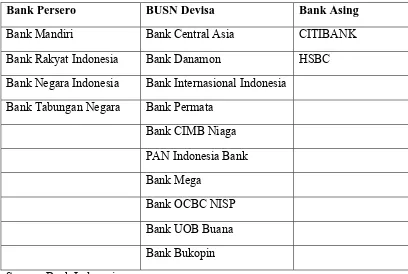
Table 3.2 List of Banks (Research Objects) ... 61
Table 4.1 Descriptive Statistic ... 70
Table 4.2 Normality Test Result ... 75
Table 4.3 Multicollinearity Test ... 76
Table 4.4 Durbin Watson Test ... 78
Table 4.5 Result of Durbin Watson Test ... 79
Table 4.6 Result of Heterocedaticity Test ... 81
Table 4.7 F Test Result ... 82
Table 4.8 Result of Linear Regression Analysis ... 83
Figure 1.1 Level of Capital Buffer Ratio Banking in Indonesia (%)... 54
Figure 4.1 Normality Test Result (Histogram) ... 73
Figure 4.2 Normality Test Result (P-Plot) ... 74
1.1 Research Background
A financial service is industry that experienced the most rapid change and growth in many countries. Indonesia, with total population of approximately 240 million people and an average population aged 28 years, becoming a potential land for market penetration of banking. Moreover, the level of market penetration is still low by the number of people who have bank accounts only 40 million to 50 million peoples. In the last 20 years, the banking sector is always growing and still dominated by 82% of the assets of all financial sector assets, such as insurance, multi finance, pension funds, and securities companies (Info Bank Outlook, 2011).
As a vital institution in the economy, it is necessary to control a healthy and stability by the banking regulator.
Commercial banks are the most heavily regulated financial institutions in Indonesia. This largely reflects the critically important role bank play in the payment system and in providing credit to individuals and business. The large number of failed banks during crisis in 1998 force Bank Indonesia as a reserve bank in Indonesia to redesign its regulatory framework encompassing and deposit insurance. Fundamentally, there are five reasons for bank regulation. First, to ensure the safety and soundness of bank and financial instrument. Second, to provide an efficient and competitive financial system. Third, to provide monetary stability. Fourth, to maintain the integrity of the nation’s payment system. Fifth, to protect consumers from abuses by credit granting institutions (Rose, 2002).
Precious lessons from the crisis of 1998 was indicated that the national banking industry still weak on regulation because it did not has a solid banking infrastructure, so it would be not easy to overcome internal and external shocks that come suddenly. The weakness of banking’s regulation becomes challenges that still must be resolved in order to encourage economic growth at the expected level and keep the soundness and stability (Rivai, Veithzal, et al., 2007).
the 1988 Basel Capital Accord and its subsequent amendments, the regulation requires that banks hold a minimum amount of capital equal to eight percent (8%) of risk weighted assets. This ratio is known as the capital adequacy ratio (CAR).
Indonesia adopted the rule was originally intended to overcome the effects of banking competition post financial deregulation in the 1990s. However, banks commercial at the time tends to break the rules minimum of capital requirement and respond to competitive pressures by extending credit to risky projects, where most of the bad debt can be found at non-tradable sectors such as real estate, property and construction. Although the capital reserves that continue to erode due to bad loans that are too large, the banks remain in operation until the end of the financial crisis can not be avoided (Creed, 1999).
The lattes version of capital accord called BASEL III will be implemented in Indonesia in 2018, The World Bank explains Basel III is the latest global standards for the regulation of capital adequacy and liquidity. Basel III regulations are made to respond to the global financial crisis, which revealed various shortcomings in the regulation of global finance. In the financial sector, Basel III is not only touches on prudential regulations (relating to the precautionary principle) micro scale, but also on macro scale, because it can maintain the stability of the financial system. Basel III will introduces additional capital buffers, a mandatory capital conservation buffer of 2.5% and a discretionary countercyclical buffer, which allows national regulators to require up to another 2.5% of capital during periods of high credit growth. The measures proposed Basel III also aims to reduce financial sector conditions are pro-cyclical (pro-cyclicality) and reduce systemic risks, including by addressing the problem of liquidity.
The excess of Capital Adequacy Ratio so called as Capital Buffer gets a great deal of attention in the economic literature considering that banks serve a pivotal role in the economy. However, the level of minimum CAR set by the regulator may not fully capture banks’ risks. There could also be risks that do not concern the regulator, but affect banks’ capital holding decisions, including financial distress caused by a loss of branches value. Such as, banks’ views on the appropriate level of capital may differ from the minimum level set by the regulator.
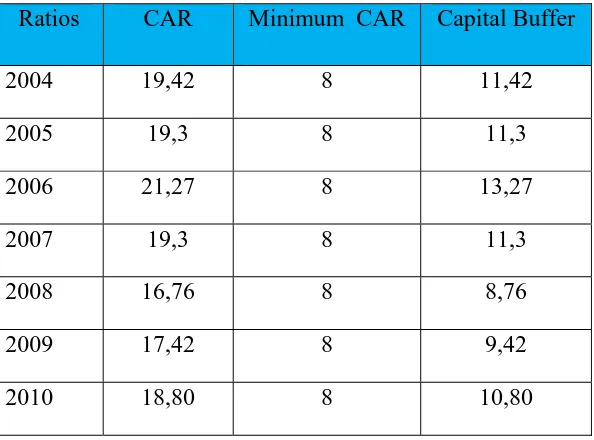
Table 1.1
Capital Buffer Ratios Banking in Indonesia (%) Ratios CAR Minimum CAR Capital Buffer
2004 19,42 8 11,42
2005 19,3 8 11,3
2006 21,27 8 13,27
2007 19,3 8 11,3
2008 16,76 8 8,76
2009 17,42 8 9,42
2010 18,80 8 10,80
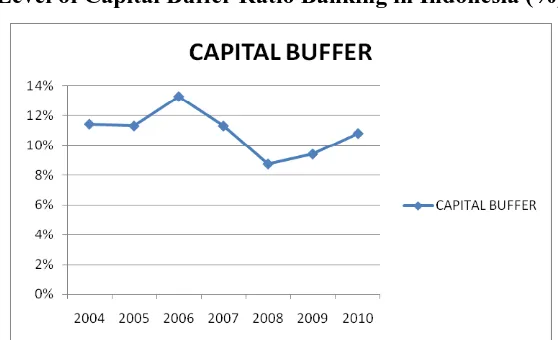
Figure 1.1
Level of Capital Buffer Ratio Banking in Indonesia (%)
Source: Bank Indonesia (compiled)
Function of capital buffer in the banking industry is strickly needed to anticipate an increase of future losses and to anticipate when capital is rare and expensive in downturn period. Mishkin (2007) argued that banks also hold excess capital or capital buffer are made based on three most common reasons. First, bank capital aids to prevent bank failure. A bank maintains it’s capital to reduce the chance of become insolvent. Banks will prefer to have a sufficient capital to act as cushion to absorb the losses. Second, the amount of capital affects returns for the equity holders of the bank. The higher the bank capital, the lower the return that the owners of the banks. There is a trade off between the safety and the returns to equity holders, so the bank managers had to set an optimal level of bank capital. Third, a minimum amount of bank capital is required by the regulators.
(more than 8%). The highest level of capital buffer happened in 2006, this discussion become more interesting because the lowest level of Capital buffer occured in 2008, but afterward, level of Capital Buffer was always increase. The average CAR from 2004-2010 touched 18,89% against BASEL III only required 13% of minimum CAR. Too much CAR value is not good for banking industry, since it’s excess capital can be used for runing the business of banking and maximizing of it’s profit.
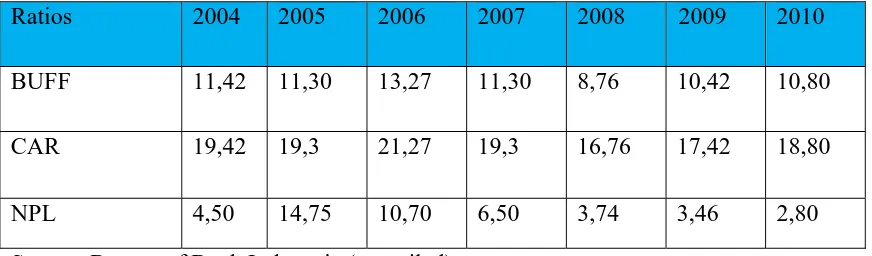
Table 1.2
Financial Ratios (BUFF, CAR, and NPL) Comercial banks in Indonesia 2004-2010 (%)
Ratios 2004 2005 2006 2007 2008 2009 2010
BUFF 11,42 11,30 13,27 11,30 8,76 10,42 10,80
CAR 19,42 19,3 21,27 19,3 16,76 17,42 18,80
NPL 4,50 14,75 10,70 6,50 3,74 3,46 2,80
Source: Bureau of Bank Indonesia (compiled)
capital showed increasing level during 2008 to 2010, because in those years global recession occured.
In term of NPL data, there are some data gap that is not relevant with theory, it was happened during year 2005 to 2010 except year of 2007. When Non performing loan (NPL) has showed the decline, but BUFF showed the uptrend. Furfine (2000) and Estrella (2004) found a significant positive coefficient would indicate that higher risk leads to higher capital buffers. The theory predicts this coefficient should be positive since higher risks increase the probability of meeting regulatory capital constraints and facing the related costs such as market discipline and supervisory intervention. Non-Performing Loans (NPL) from year to year has always experienced a trend decline during 2005-2010, beginning in 2005 was 14,75% to 10,7% in 2006, in the year 2007 NPL amounting to 6,5%, in 2008 decreased to 3,74%, during 2009 to 2010 NPL was decreasing too from 3,46%, to 2,8%. This indicates that the ratio of non performing loans getting less and be able to overcome.
Basically there are three different types of costs associated to bank capital to the model capital buffers, based on Ayuso et al. (2004), Lindquist (2004), Stolz and Wedow, (2009), Brown and Davis (2008), Fonseca and Gonzalez (2009), Nier and Baumman (2006), Jokipii and Milne (2008), and Tabak et al. (2011), wich there are including cost of holding capital, cost of financial bankcruptcy or financial distress, and adjustment costs.
Some researchees on the determinants of capital buffers have been conducted, including Ayuso et al. (2002), Jokipii and Milne (2008), and Prasetyantoko & Soedarmono (2008) uses ROE as a proxy of capital holding cost, the result was showing a negative influence between ROE and Capital Buffer. De Bont and Prast (1999) find That ROE is only negative in countries with large stock markets, suggesting that the argument of "opportunity cost of capital" hold only in countries were shareholder value is Important and access to external finance relatively cheap. It is contrary to the findings of Nier (2006), D'Avack & Levasseur (2007) found a positive correlation between ROE and capital buffer, it indicates that there is a role of shareholders in disciplining market. Shareholders tend to increase the capital buffer to keep the market value (Park and Peristiani, 2007).
correlation Between NPL and capital buffer, a negative coefficient would however indicate "moral hazard" behavior, where banks assume higher risks with lower buffers, it could also indicate more sophisticated risk management systems, allowing banks to hold lower buffers for the same amount of risk (Alfon et al., 2005).
Capital adjustment also has important effect on determining capital buffers, since banks may face adjustment costs in moving toward optimal their capital ratios. Ayuso et al. (2002) and Esterella (2004) using lag of capital buffer (BUFFt-1) to proxy this cost, the result was showing positive significant on influencing capital buffer. But this research try to change lag of capital buffer variable into increment of capital buffer variable, since this capital buffer decission not only determined by adjusting capital buffer at the previous period (t-1), but also determined by capital buffer at the current period (t). So we expect the delta of capital buffer will affect positevely, as same as lag of capital buffer.
banking with high share assets. It also will prove Too Big To Fail consensus that states large banks tend to decrease their capital buffer.
It is important to highlight that most of the comercial banks in Indonesia hold capital above the required minimum ratio. But unfortunately, study on capital buffer in Indonesia is still difficult to found. The discussion about capital buffer banks have not been touched yet in academic and policy level. This study wanted to analyze more about the determinants of capital buffer comercial banks in Indonesia, since that bank’s CAR in Indonesia has reached a level of average 18,89% during the period 2004-2010, when the minimum capital regulations only required banks to have CAR equal to 8% and a new BASEL III only required CAR to 13%.
Thus, based on research gap and theory gap as explained above, there is a need to asess “The Determinants of Capital Buffers’ Comercial Banks in Indonesia” (Study on 16 Biggest Comercial Banks in Indonesia). Built upon
1.2Problem Statement and Research Questions
The research question will be built based on research gap. We can see from previous research as mentioned above in research background that show the gap between one researcher to other researchers. Such the other previous research conducted by Jokipii and Milne (2008) analyze the cyclical behaviour of European bank capital buffer’s bank of Finland. The research uses ROE as one of determinants of capital buffer and the result for this variable is negative. As noted by Jokipii and Milne (2008), ROE may well exceed the remuneration demanded by shareholders and to this extent is a measure of revenue rather than cost. A high level of earnings substitutes for capital as a buffer against unexpected shocks. Thus, as raising capital through the capital markets is costly, retained earnings are frequently used to increase capital buffers. So the expected sign for ROE may be negative (Jokipii and Milne, 2008; Stolz and Wedow, 2005), but it also may be positive (Nier and Baumman, 2006).
The other research gap also found in Fonseca and Gonzalez (2009) research. They use the non-performing loan ratio to total loans (NPL) to proxy the bank risk, the results found a positive relationship between capital buffers and risk that proxy by non performing loan. But Alfon et al. (2005) and Miguel Boucinha (2008) found a negative correlation Between NPL and capital buffer.
and significant on influencing capital buffer. Study on incremental capital buffer try to add some other finding research on determining capital buffer, especially it still haven’t touch yet in Indonesia, so the author will include this variable also in this research.
The other variable also has important on determining capital buffer since Prasetyantoko and Soedarmono (2008) also analyze Bank's Share Assets (BSA) and Loans to Total Assets (VLOAN) on influencing capital buffer comercial banks in Indonesia. But the research only conducted in 4 years during the period of 2004 – 2007, so to prove the real of those two varibales in influencing capital buffer, this research will analyze those variables with longer period time during 2004-2010.
Built upon those problem, research questions which will be studied in this research are listed as follows:
1. Does Return on Equity (ROE t-1) influence Capital buffer banking in indonesia during 2004-2010?
2. Does Non Performing Loans (NPL) influence Capital Buffer banking in Indonesia during 2004-2010?
3. Does Increment of Capital Buffer (∆BUFF) influence Capital Buffer
banking in Indonesia during 2004-2010?
5. Does Bank’s Share Assets (BSA) influence Capital Buffer banking in Indonesia during 2004-2010?
1.3Objective and Research Benefit
1.3.1 Research Objective:
The objectives of this study are:
1. To analyze the influence of Equity (ROE t-1) on Capital buffer banking in indonesia from 2004-2010.
2. To analyze the influence of Non Performing Loans (NPL) on Capital Buffer banking in Indonesia from 2004-2010.
3. To analyze the influence of Increment of Capital Buffer (∆BUFF) on Capital Buffer banking in indonesia from 2004-2010.
4. To analyze the influence of Loans to Total Assets (VLOAN) on Capital Buffer banking in indonesia from 2004-2010.
5. To analyze the influence of Bank’s Share Assets (BSA) on Capital Buffer banking in Indonesia from 2004-2010.
1.3.2. Research Benefits
The benefits this research are:
1. Benefit for Civitas Academica
Result of this research also hopefully can add empirical research repository about science discipline of finance management management, especially concerning about capital buffer.
2. Benefit for Bankers
This research is expected to be able to analyze the future financial condition, so it could be a reference materials for banking industry to strategize about the future of banking regarding BASEL III will be implemented in 2018.
3. Benefit for Readers
For all readers, this study is expected to increase the knowledge and information who want to study about the problem of capital buffers comercial banking in Indonesia. As well as reference material to make a comparative study in the future regarding study on capital buffer still rare to find in Indonesia.
1.4Thesis Outline
Outline of the bachelor thesis is describe as follows:
CHAPTER I: INTRODUCTION
CHAPTER II: LITERATUR REVIEW
Chapter II contains underlying theories and reviews of the previous study that has a closer relationship to the subject of this study. It also contains theoritical framework of the study and hypothesis.
CHAPTER III: RESEARCH METODOLOGY
Chapter III explains the research method. This chapter also includes a definision and operational measurement of the variables, population and sampling frame, data type and data source. This chapter also describe analysis method used in the research.
CHAPTER IV: RESULT AND ANALYSIS
Chapter IV presents research object, data analysis, and discussion of the research hypothesis.
CHAPTER V: CONCLUSIONS
2.1 Theoretical Backround
2.1.1 Bank’s Capital
The capital accounts of a comercial bank play several vital role in
supporting its daily operations and ensuring its long run viability. Rose (2002)
propose there are five functions of bank capital, first, capital provides a cushion
against the risk of failure by absorbing financial and operating losses until
management can address the bank’s problem and restore the institution’s
profitability. Second, capital provides the funds needed to get the bank chartered,
organized, and operating before deposits come flowing in. Third, capital promotes
public confidence in bank and reassures its creditor of the bank’s financial
srength, capital also must be strong enough reassure borrowers thet bank will be
able to meet their credit needs even if the economy turns down. Fourth, capital
provides fund for organization’s growth and the development of new services,
program, and facilities. Fifth, capital serves a regulator of bank’s growth, helping
to ensure that individual bank’s growth is held to a pace that is suistainable in the
long run.
Both of the regulatory authorities and the financial markets require that bank
capital increases roughly in line with the growth of loans and other risky bank
assets. Thus, the cushion to absorb losses is supposed to increase along with a
deposits too fast will start receiving signals from the market and regulatory
community that its growth must be slowed or additional capital must be required.
So, capital regulation by the bank regulatory agencies has become an
increasingly important tool to limit how much risk exposure banks can accept. In
this role capital not only tends to promote public confidence in banks and the
banking system but also serves to protect the government’s deposit insurance
system from serious losses.
2.1.2 Bank Regulation
Bank regulations are a form of government regulation which subject banks
to certain requirements, restrictions and guidelines. This regulatory structure
creates transparency between banking institutions and the individuals and
corporations with whom they conduct business, among other things. Given the
interconnectedness of the banking industry and the reliance that the national and
global economy hold on banks, it is important for regulatory agencies to maintain
control over the standardized practices of these institutions.
Rose (2002) propose the principal reasons banks are subject to bank’s
regulation. First, to protect the safety of the public’s saving, it is related to
minimum requirements, requirements are imposed on banks in order to promote
the objectives of the regulator. Often, these requirements are closely tied to the
level of risk exposure for a certain sector of the bank. The most important
minimum requirement in banking regulation is maintaining minimum capital
nation’s broad economic goals, such as high economic’s growth, low inflation,
and high employment. Third, to ensure equal opportunity and fairness in the
public’s access to credit and other vital financial services. Fourth, to promote
public confidence in the financial system, so that savings flow smootly into
productive investment, and payments for goods and services are made speedily
and efficiently. Fifth, to avoid concentrations of financial power in the hands of a
few individuals and institutions. Sixth, to provide the government with credit, tax
revenues, and other services. Seventh, to helps sectors of the economy that have
special credit needs, such as housing, small business, and agriculture.
The capital regulation by the bank regulatory agencies has become one of
the key instruments of modern banking regulation with aim to provide both a
capital buffer during adverse economic conditions, as well as a mechanism aimed
at preventing excessive risk ex ante (Rochet, 1992). And this regulations becomes
an increasingly important tool to the safety of the public’s saving, to the public’s
confidence in the financial system and to the limit on how much risk exposure
banks can accept. In this role capital also serves protect the government’s deposit
insurance system from serious losses.
The capital regulation by the bank regulatory called as capital requirement
sets a framework on how banks must handle their capital in relation to their assets.
Globally, Basel Committee on Banking Supervision influences each country's
capital requirements. In 1988, the Committee decided to introduce a capital
measurement system commonly referred to as the Basel Capital Accords. The
framework is intended to be more risk sensitive than the original one, but is also a
lot more complex. The capital regulation rules those recomended by the BASEL
Accord are minimum to be implemented by banks globally in across country with
the aim to ensure a sound and stable financial environment.
2.1.3. The BASEL Agreement on International Capital Standards
2.1.2.1 BASEL I
In 1987 the Federal Reserve Board, representing by 12 countries such as
United States, Belgium, Canada, France, Germany, Italy, Japan, The Netherlands,
Sweden, Switzerland, the United Kingdom, and Luxemborg) announced
preliminary agreement on new capital standard, often referred to as the Basel
Agreement or Basel I that would be uniformly applied to all banking institutions
in their respective juridictions. Formally approved in July 1988, those new
requirements are designed to encourage leading banks to strengthen their capital
positions, reduce inequality in the regulatory rules of different nations, and
consider the risk to bank of the off balance sheet commitments that they have
made in recent years.
Basel I, primarily focused on credit risk. Assets of banks were classified
and grouped in five categories according to credit risk, carrying risk weights of
zero (for example home country sovereign debt), ten, twenty, fifty, and up to one
hundred percent (this category has, as an example, most corporate debt). Banks
with international presence are required to hold capital equal to 8 % of the
of international banking system as a result of the higher capital ratios that it
required.
2.1.2.3 BASEL II
Basel II initially published on June 2004, aims to create an international
standard for banking regulators to bring the framework more in line with modern
banking by becoming more risk sensitive and representative of current risk
management practise. This version intended to control how much capital banks
need to put aside to guard against the types of financial and operational risks
banks (and the whole economy) face.
Basel II was created to build on a solid foundation of prudent capital
regulation, supervision, and market discipline, and to enhance further risk
management and financial stability. As such, the Committee encourages each
national supervisor to consider carefully the benefits of the new framework in the
context of its own domestic banking system and in developing a timetable and
approach to implementation. Given resource and other constraints, these plans
may extend beyond the Committee's implementation dates. That said, supervisors
should consider implementing key elements of the supervisory review and market
discipline components of the new framework even if the Basel II minimum capital
requirements are not fully implemented by the implementation date. National
supervisors should also ensure that banks that implement Basel II are subject to
Advocates of Basel II believed that such an international standard could
help protect the international financial system from the types of problems that
might arise should a major bank or a series of banks collapse. In theory, Basel II
attempted to accomplish this by setting up risk and capital management
requirements designed to ensure that a bank has adequate capital for the risk the
bank exposes itself to through its lending and investment practices (BIS, 2012).
Generally speaking, these rules mean that the greater risk to which the bank is
exposed, the greater the amount of capital the bank needs to hold to safeguard its
solvency and overall economic stability.
2.1.2.3. BASEL III
Forum Basel Committee on Banking Supervision in Switzerland has
decided that the world have to improve standards of banking regulation following
the crisis 2008. With the due date of January 1, 2013, the whole world should
implement certain standards for sound banking. Bank Indonesia will adapt some
of the rules related to it, Indonesia compared to other countries, it has actually
been quite strong. That's since the capital structure of banks in Indonesia is still
strong with an average capital adequacy ratio (CAR) 17% (Gayatri, 2012).
Basel III is intended to be applied consistently around the world so as to
reduce the risk that financial institutions will move their operations to jurisdictions
with more lenient regulatory regimes. However, it is by no means clear that Basel
III will be implemented uniformly around the world. The timing of
countries may be compelled to comply with the tightest national timeline to which
they are subject. Even when fully implemented, the finer details of national capital
adequacy regimes are likely to differ and, again, international banks may find
themselves compelled to comply with the rules of the host country with the most
stringent national capital adequacy requirements.
Basel III’s new requirement for countercyclical capital buffers may also be
difficult for banks with international operations. Basel III requires that individual
countries consider whether to increase their national capital requirements when
there is an unsafe build-up of credit. If a bank has operations in more than one
country, the countercyclical buffer that it is required to maintain will be a
weighted average of all of the countercyclical buffers in force in countries in
which it has credit exposure.
Generally speaking, Indonesia is ready for implementing BASEL III
because banks in Indonesia has more components of tier one, however, the
tightening of the Basel capital rules will still affect Indonesia. Capitalization rules
will be tightened. The final rule requires the Basel minimum capital of 13% CAR
by the composition of at least 6% tier one, 2% tier two, capital conservation buffer
2.1.4 Theories Related to Capital Buffer
The theories related to capital buffer study that author have decided for
this research are as follows: Pecking Order Theory and To Big Too Fail
Consensus. Research on capital buffer has close conection to capital structure, so
the underlying theories used are based on capital structure theory too and capital
buffer is one of bank's behavior in their capital structure.
2.1.4.1 The Pecking Order Theory
In the theory of firm's capital structure and financing decisions, the
pecking order theory was first suggested by Donaldson in (1961) and it was
modified by Stewart C. Myers and Nicolas Majluf in (1984). It states that
companies prioritize their sources of financing (from internal financing to equity)
according to the principle of least effort, preferring to raise equity as a financing
means of last resort. Hence, internal funds are used first, and when that is
depleted, debt is issued, and when it is not sensible to issue any more debt, equity
is issued.
Pecking order theory starts with asymmetric information as managers
know more about their companies prospects, risks and value than outside
investors. Asymmetric information affects the choice between internal and
external financing and between the issue of debt or equity. Stewart C. Myers and
Nicolas Majluf in (1984) stated that equity is more costly compare to other bank
liabilities because of information asymmetries. Equity may also be disadvantaged
capital is hence expected to be negatively associated with equity cost. Therefore,
previous studies have considered the return on equity (ROE) as a proxy variable
for the direct cost of remunerating excess capital. Thus, this research expect a
negative relationship between ROE and excess capital (capital buffer).
Banks may face adjustment costs in moving toward their optimal capital
ratios. These costs arise both when the bank is raising new external capital and
when it is shedding external capital (Estrella, 2004). Equity also is a form of
capital for which monitoring costs are high, and the bank has an informational
advantage over public investors as to the value of its own equity, which would
increase the cost of the desired adjustment (Myers and Majluf, 1984).
Accordingly, the issuance of equity could be seen by the potential buyers as a
negative signal with regard to the banks’ value. An important cost of shedding
equity comes from pressure from regulators, supervisors and market participants
to maintain clearly sound levels of capital (Estrella, 2004).
An excess, or a deficiency of capital can arise as a result of the difficulties
in capital adjustment. However, the consequence of falling short of capital is
probably more serious, so banks are more likely to be “over-capitalised” than
“under-capitalised”. In addition to the assumption of asymmetric information,
changing capital level can be give a bad signal, thus making the bank reluctant to
react quickly when capital shocks occur (Myers and Majluf, 1984).
Ayuso et al. (2002) and Estrella (2004) found Lag of Capial Buffer
(BUFFt-1) coefficient may be interpreted as a measure of adjustment costs in
as a proxy of capital adjustment, but it will use increment of capital buffer, this
variable expected its sign to be positive as same as lag of capital buffer.
2.1.4.2 Too Big To Fail Consensus
A clear predictions about capital buffer obviously is related to the size of
the bank. a consensus has been reached, where large banks tend to have lower
capital buffer than small banks, due to the nature of the Too Big To Fail (Kane
2000; Mishkin 2006). In addition to Too Big To Fail, large bank is easily to get
their financing from capital market and it has a comparative advantage to address
the problem information to improve monitoring efforts to encourage them to strike
a balance between cost supervision and the cost of equity. In turn, banks will
reduce the cost of equity by way of lower capital reserves.
2.1.5 Capital Buffer
Bank’s capital buffer (BUFF) is defined as the difference between the
CAR ratio (ratio the adequacy of bank capital) to the regulatory capital minimum
of 8%. Despite the safety and soundness benefits of capital regulation, requiring
banks to hold increased levels of capital that does have costs and can be argued to
be a binding constraint on bank behaviour.
Bank’s capital buffers can view as a cushion, to absorb unexpected shock,
if the financial distress costs from low capital and the costs of accessing new
capital are high (Wong,et al. 2005). In addition, low capitalization banks are also
that banks may hold capital buffers as insurance to avoid cost about market
discipline and supervisory intervention if they approach or fall below the
regulatory minimum capital ratio.
Other reasons to have capital buffers, Berger et al. (1995) considers that
market forces lead banks to keep capital buffers, even when capital is relatively
costly, as bank capital commits the bank to monitor and without deposit insurance
that allows the bank to raise deposits more cheaply. Jokipii and Milne (2008)
argue that in the event of a substantial increase in loan demand, banks with
relatively little capital may lose market share to those that are well capitalized.
Mishkin (2006) argued that banks also hold capital are made based on
three most common reasons. First, bank capital aids to prevent bank failure. A
bank maintains bank capital to reduce the chance of become insolvent. Banks will
prefer to have a sufficient capital to act as cushion to absorb the losses. Second,
the amount of capital affects returns for the equity holders of the bank. The higher
the bank capital, the lower the return that the owners of the banks. There is a trade
off between the safety and the returns to equity holders, so the bank managers
had to set an optimal level of bank capital. Third, a minimum amount of bank
capital is required by the regulators.
Basically there are three different types of costs associated to bank capital
to the model of capital buffers, based on Ayuso et al. (2004), Lindquist (2004),
Stolz and Wedow, (2009), Brown and Davis (2008), Fonseca and Gonzalez
(2011), including of holding capital, cost of financial bankcruptcy or financial
distress, and adjustment costs.
Ayuso et al. (2002), Jokipii and Milne (2008), and Prasetyantoko &
Soedarmono (2010) uses ROE as a proxy of capital holding cost, the result was
proving Return on Equity (ROE) has a negative on influencing capital buffer. It
was different to the findings of Bauman Nier (2006), D'Avack & Levasseur
(2007) that found a positive correlation between ROE and capital buffer, it
indicates there is a role of shareholders in disciplining market. Shareholders
growing niche to increase of of the capital buffer to keep the market value (Park
and Peristiani, 2007), this is in line with the forward looking theory by the Palia
and Porter (2004), in which capital ratios used by banks to maintain their market
power.
Cost of bankcruptcy also determines capital buffers, Jokipii and Milne
(2008), Fonseca and Gonzalez (2009) used non-performing loan ratio to total
loans (NPL) to proxy the banks risk and the result has found a positive correlation
between NPL and capital buffers. While Alfon et al. (2005) found a negative
correlation Between NPL and capital buffers. This is in line with the argument by
Mishkin (2007) which states that the banks will prefer to have a sufficient capital
to act as a cushion to absorb the losses.
Capital adjustment has important effect on determining capital buffers,
since banks may face adjustment costs in moving toward optimal their capital
ratios. Ayuso et al. (2002) using lag of capital buffers to proxy this cost, the result
the theory, this research will use increment of capital buffer to proxy capital
adjustment.
There are two types of behavior of banks in managing their capital. First,
banks that are backward-looking will reduce the capital buffer during the boom to
extend credit activities. As a result, they fail to think of capital buffers in the
closing credit risk, and thus, they are forced to increase capital reserves during
periods of recession (Borio et al., 2001). Second, banks that are forward-looking
would anticipate economic recession in the future by improving capital buffer
during periods of economic boom.
Ayuso et al (2004) provide an empirical evidence on the behavior of banks
in Spain that are backward-looking to show that bank capital is procyclical.
Jokipii and Milne (2008) found similar results in which the capital reserves in
European banks are procyclical during the period 1997 to 2004.
In contrast, several studies have shown that the ratio of capital may be
countercyclical. This is because the banks that are forward-looking would
anticipate economic recession using the period of economic boom not only to
increase their profits, but also to increase the capital reserves avoiding greater
losses in the event of an economic recession (Borio et al, 2001). Berger and Udell
(2004) argues that the ratio of capital being countercyclical, due to develop bank
balance sheets during a period of economic boom. Finally, in this research also
add some other determinants to find a real determinants that can effect to capital
buffer's comercial banks in Indonesia, there are two other determinats that also
Assets (BSA). VLOAN is considered in the analysis, it uses to determine wheather the
higher loan’s growth will effects in reducing capacity to raise bank’s capital reserve or
not. BSA also considered as independent variables, therefore in this study need to prove
whether the bank with a substantial market power is relatively easier to get a profit so as
to encourage banks to increase of capital reserves from the profit.
2.1.6 The Determinants of Capital Buffer
As mentioned above, this research following Ayuso et al. (2004), Jokipii
and Milne (2008), and Tabak (2011), there are three different types of bank
capital-related costs to model capital buffers: cost of holding capital, cost of
financial distress, and adjustment costs.
2.1.6.1 Cost of Holding Capital
Holding capital implies direct costs of remunerating the excess of capital,
that is the opportunity cost of the capital (Ayuso, et al., 2002). Therefore, banks’
incentives to hold capital buffers depend on the cost of capital compared to the
cost of deposits (Fonseca and Gonzalez, 2009). Theoritical analysis (see Myers
and Majluf, 1984; Campbell, 1979) has argued that in the context of information
asymetries, equity is a more costly alternative to other bank liabilities. In this
research, include the banks return on equity (ROE) in order to capture direct costs
of remunerating excess capital. this measures reveals how much profit company
earned in comparison to the total amount of shareholder equity found on the
2.1.6.1.1 Return on Equity (ROEt-1)
When the return on equity is high, it is costly to hold excess capital. In this
case, a profit-maximising bank may maintain a lower capital buffer when the
opportunity cost of capital is high. Several previous researches, Ayuso et al.(2002)
and Jokipii & Milne (2008) found negative correlation between Capital Buffer
and the return on equity, it was suggested that banks would reduce capital holding
when the cost of capital is high.
Ayuso et al. (2004), Jokipii and Milne (2008) use each institutions’ return
on equity (ROE) to proxy cost of holding capital. As noted by Jokipii and Milne
(2008), ROE may well exceed the remuneration demanded by shareholders and to
this extent is a measure of revenue rather than cost. A high level of earnings
substitutes for capital as a buffer against unexpected shocks. Thus, as raising
capital through the capital markets is costly, retained earnings are frequently used
to increase capital buffers.
2.1.6.2. Cost of Financial Distress
Holding higher level of capital can ensuring banks to reduces the
probability of bankruptcy and therefore so called the costs of failure, which
include the loss of charter value, reputational loss and legal costs of the
bankruptcy process (Tabak, 2011). As mentioned by Milne and Whalley (2001),
higher levels of capital therefore reduce the risk of non-compliance and the
subsequent costs of failure which are directly proportional to absolute value of the
Related to these costs are those associated with the existence of
compulsory capital requirements. Higher capital levels also reduce the probability
of not complying with those requirements, thus minimising the consequent costs.
As a matter of fact, before regulatory limits are reached, supervisory authorities
usually place some restrictions on the activity of the bank. The risk profile of the
bank determines it’s capital buffer.
Since a bank's probability of failure is reliant on its risk profile, proxy for
the cost of failure adopting from various measures of risk. As Ayuso et al. (2004)
measured, in this research consider the ratio of non-performing loans. If banks set
their capital corresponding to the true riskiness of their assets portfolios, then
would expect the relationship between capital buffers and the ratio of
non-performing loans to be positive.
2.1.6.2.1 Non Performing Loans (NPL)
Based on Ayuso et al. (2004), Jokipii and Milne (2008), Fonseca and
Gonzalez (2009), they use the non-performing loan ratio to total loans (NPL) to
proxy the bank risk. Bank's risk is one of the bank's business risks, those
happened because of failed or no payback of loans by borrowers to the banks.
Therefore, the ability of credit management is really needed by the bank for
managing their credit problem (Sinungan, 2000). In this research use
non-performing loans (NPL) to proxy these risks (credit risk), this ratio indicates the
According to regulation of Bank Indonesia (BI No. 3/30DPNP on
december,14 2001), Non Performing Loan (NPL) measured from the
nonperforming loan divided to total loans. The higher Non performing Loan level
would increase costs, so it causes the potential bank to get losses. In accordance
with the regulations stipulated by Bank Indonesia, a good amount of Non
Performing Loans (NPL) is below 5%.
2.1.6.3 Adjustment Costs
Banks may face adjustment costs in moving toward their optimal capital
ratios. An excess, or a deficiency, of capital can arise as a result of the difficulties
in capital adjustment. However, the consequence of falling short of capital is
probably more serious, so banks are more likely to be “over-capitalised” than
“under-capitalised”. In other words, a part of the observed capital buffer may be
held for precautionary purposes, due partly to frictions in adjusting capital
level.(Wong, et al., 2005).
2.1.6.3.1 Increment of Capital Buffer (ΔBUFF)
Increment of Capital Buffer (∆BUFF) is proxy of adjustment cost, it
represents the delta of excess capital over regulatory requirements in the period t
(now) minus excess capital over regulatory requirement in the period t-1 (one year
before). In order to illustrate the cost of capital adjustment, this study added from
Ayuso et al. (2004) and Estrella (2004) model that used lag of capital buffer to
2.1.7 The Other Determinants of Capital Buffer
2.1.7.1 Loans to Total Assets (VLOAN)
Distributing loans to the borrowers is the main business of banks and the
main source of income for banks but it is contains the greatest risk as well. Loans
to Total Assets will impact on bank earnings growth. VLOAN sustained by
increasing of consumption today. In accordance with theory, the increased of
consumption will also increase the loans.
Total Loans to Total Assets ratio (VLOAN) is considered in the analysis
because it is important ratio for banks. VLOAN expected to relate positively to
capital buffer because the higher capital that is distributed to its credits, the riskier
bank will face because of high credit distribution.
2.1.7.2 Bank’s Share Assets
Bank's Share Assets (BSA) also considered as independent variables.
Prasetyantoko and Soedarmono (2008) defined bank's share assets defined as the
ratio of total bank assets of the total banking system assets.
Researches on Determinanats of Capital Buffer have been done by some
of the researchers, are as follows:
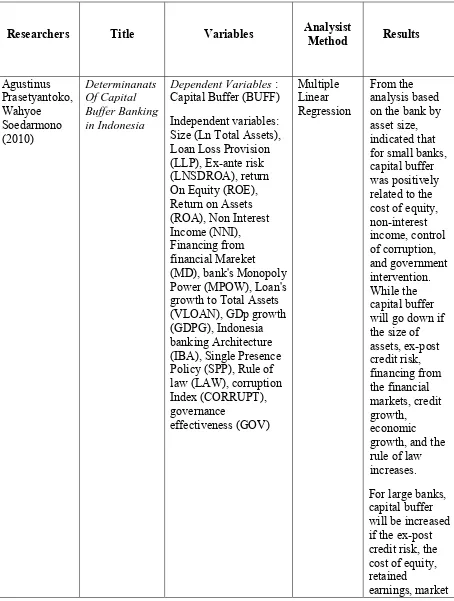
1. Prasetyantoko and Soedarmono (2010)
These research examine whether capital buffer banking in
Indonesia can be affected by the factors such as financial ratios,
business cycles, regulatory, and institutional. The data used in this
study is a monthly balance sheet and financial statements of the 99
commercial banks in Indonesia during the period 2004 - 2007.
From the analysis based on the bank by asset size, indicated that
for small banks, capital buffer was positively related to the cost of
equity, non-interest income, control of corruption, and government
intervention. While the capital buffer will go down if the size of
assets, ex-post credit risk, financing from the financial markets, credit
growth, economic growth, and the rule of law increases.
For large banks, capital buffer will be increased if the ex-post
credit risk, the cost of equity, retained earnings, market forces,
economic growth and control of corruption were improved.
Meanwhile, the only financing from financial markets and government
interventions that can reduce the capital reserves of banks.
In addition to focus on these factors, this study shows that
capital reserves in the banking Indonesia are procyclical. Those results
would be different if the analysis was done by groups of banks
discipline). In a large bank and the listed banks, the banks' capital
buffer capital is countercyclical. In other words, these banks tend to
raise the reserve optimistic in the current capital (economic booms),
and down in a recession.
Thus, the policy consolidation of small banks and the
strengthening of market discipline (market discipline) is required to
support implementation of Basel II, particularly in addressing the
procyclical effects of minimum regulatory capital.
2. Juan Ayuso et all (2002)
This research analyse the relationship between the Spanish
business cycle and the capital buffers held by Spanish commercial and
savings banks from 1986 to 2000 using panel data.Variables in this
research are lag of capital buffer (BUFt-1), Return On Equity (ROE),
Non Performing Loan (NPL), BIG, SMA, and GDP growth as
dependent variables, BIG and SMA are included to detect the
differences in the capital buffer according to the size of each
institution. In particular, BIG (SMA) is a dummy variable that taking
value 1 for banks in the highest (lowest) decile and capital Buffer
(BUFF) as a independent variable.
This research findings are fairly robust and quite unequivocal.
After controlling for other potential determinants of the surplus
capital, this research found a robustly significant negative relationship
showing that ROE has positive correlation and NPL has a negative
correlation. The signs of the dummy variables BIG and SMA are,
respectively, consistent with the too big to fail hypothesis and the
relatively greater difficulties for small banks to draw on capital
markets.
3. Francesco d’Avack and Sandrine Levasseur (2007)
This research anylize the determinants of capital buffers in
CEECs (Central and Eastern European Countries), using a dynamic
panel-analysis based on country-level data for CEECs. The research
try to use lag of Capial Buffer (BUFFt-1), Return On Equity (ROE),
Non Performing Loan (NPL), and Business cycle (GDP growth) as
independent variables, and Capital Buffer (BUFF) as dependent
variable.
The results was showing a positive significant adjustment costs
lag of Capial Buffer (BUFFt-1) in determining capital buffer, Return
on Equity (ROE) also has a positive effect in influencing capital
buffer. But Non Performing Loan (NPL), and GDP’s growth has
significant negative relationship to capital Buffer.
The main results are as follows. First, there are large and
significant adjustment costs in raising capital. Second, banks behave
pro-cyclically, depleting their buffers in upturns to benefit from
unanticipated investment opportunities. Third, there is a significant
(NPL) and capital buffers, suggesting that banks in CEECs are
risk-takers. Banking sectors with large past NPL however tend to have
larger buffers. Finally, the access to external capital may appear still
somewhat limited, with banks relying on internally generated funds to
raise buffers.
4. Miguel Boucinha (2008)
Miguel Bouchinha try to analyze the determinants of Portuguese
banks’ capital buffers. The dataset used for estimation covers 17
Portuguese banks from 1994 to 2004. This research use Non
Performing loan (NPLi,t), variance of profits (VPROV), Bank's Size
(Size), output gap to potential output (YGAP), Bank's merger
(Merger), the weight of volatile income financial assets in banks’ total
assets (STK), the change in the Lisbon Stock Exchange general index
(PSIG) as independent variables, and lag of capital buffer (BUFFt-1) as
dependent variable.
The results were showing that Non Performing Loan (NPLi,t),
Variance of Profits (VPROV), Bank's Size (Size), output gap to
potential output (YGAP), Bank's Merger (Merger) has negative
significant effect to BUFFi,t. The weight of volatile income financial
assets in banks’ total assets(STK), General stock market index (PSIG)
has positive significant effect to BUFFi,t. Merger has no effect to
The main findings are that the capital buffer is positively
influenced by several broad risk measures, suggesting that the
introduction of the more sensitive regulation in Basel II might not
affect Portuguese banks’ capital ratios as much as one could expect.
Provisions and high and stable profitability are found to be substitutes
for capital buffers, whereas larger banks seem to hold less excess
capital. A negative business cycle effect is also found, and several
other hypotheses are tested.
5. Terhi Jokipii and Alistair Milne (2006)
This research analyze the cyclical behaviour of European bank
capital buffer’s bank of Finland, it using an unbalanced panel of
commercial, savings and co-operative banks for the years 1997 to
2004, specifically control for potential determinants of capital buffer
in order to analyze the sign and the magnitude of the eefect that
business cycle has on capital buffer fluctuations.
The results highlight a distinct difference that appears to exit
between banks operative in the recently accessed member states
(RAM) and 25 banks those of the European Union 25 (EU25), and
euro area 15 (EA15).
The evidence indicated the capital buffers of the RAM banks
appear to have a significant positive relationship with the cycle, while
for those in the EU15 and the EA and the combined EU25 the
between type and size of banks, and find comercial and saving banks
as well as large banks move counter cyclically. The other finding was
showing that saving banks and smaller banks drive the negative effect
or move pro cyclically for the EU25, EU15, and EA samples.
6. Benjamin M. Tabak et all (2011)
This research analyze about bank capital buffers, lending growth
and economic eycle and it is using empirical evidence for Banks in
Brazil. The research used an unbalanced quarterly panel data of 134
banks, from 2000 to 2010. Return On Equity (ROE), Non Performing
Loans (NPL), Bank's Size (SIZE), Economic cycle (GAPt-1) used as
dependend variables and capital buffer used as independent variable.
The results were proving a negative significant Return On
Equity, Non Performing Loan, Size, and output gap (economic cycle)
on influencing capital buffers. It means that banks in Brazil move
pro-cyclically behavior since economic cycle has negative effect to capital
buffer, in other word banks in Brazil try to increase their capital buffer
Tabel 2.1
Summary of Previous Researches
Researchers Title Variables Analysist
Method Results
forces, differences in the buffer according to the size of each institution. In particular, BIG (SMA) is a dummy variable.
effect is also Capital Ratio - National Regulatory Minimum Reserve (BUFF)
Independent variables:
Benjamin M.
2.3 Research’s Model and Hypotesis
This study aims to determines the factors that affect the capital buffer of
comercial banks in Indonesia. The author formulates the problem to be discussed
as well as limit the scope so that this discussion can more be focused. This study
also choose research model as well as the appropriate analytical methods to be
the necessary data and process these data with the model of research, analysis and
statistical methods that have been determined. In the end, the author will draw
conclusions from the results of analysis.
The data required in this study consisted of the factors influenced to affect
the capital buffer of comercial banks in Indonesia as well as financial data bank
which was considered to describe the bank's financial performance. The factors
that affect the capital buffer are including cost of holding capital that proxy by
Return on Equity (ROE t-1), cost of bankcruptcy which proxy by credit risk or non
performing loan (NPL), cost of capital adjustment which proxy by Increment of
Capital Buffer (∆BUFF), and other determinants such as Loans to Total Assets
(VLOAN), and Bank's Share Assets (BSA).
2.3.1. The Influence of Cost of Holding Capital proxy by Return on Equity
(ROEt-1) toward Capital Buffer Banking in Indonesia
Based on Alfon et al. (2004), Ayuso et al. (2004), and Jokipii and Milne
(2008), they use return on equity (ROE) as a proxy for the cost of holding capital
or cost of financing. They use this proxy because when banks holding capital, it
will implie direct costs of remunerating the excess of capital. The cost of equity is
used to proxy cost of capital because it’s more challenging to calculate as equity
does not pay a set return to its investors. One of the determinant of Cost of equity
is the expected Total Share Return (TSR) when investing in the company, is
measured by looking at the past ROE of the company over the period t-1.The past
why a through analysis of the company’s future projects should be undertaken,
and would probably yield better predictions than a mere extrapolation of past
numbers.
The finding show a negative relation between ROE and capital buffer. De
Bondt and Prast (1999) also find that ROE is only negative and significant in
countries with large stock markets (the United States, the United Kingdom and the
Netherlands) suggesting that the argument of “opportunity cost of capital” holds
only in countries were shareholder value is important and access to external
finance relatively cheap. As noted by Jokipii and Milne (2008), ROE may well
exceed the remuneration demanded by shareholders and to this extent is a measure
of revenue rather than cost. A high level of earnings substitutes for capital as a
buffer against unexpected shocks. Thus, as raising capital through the capital
markets is costly, retained earnings are frequently used to increase capital buffers.
So the expected sign for ROE may be negative (Jokipii and Milne, 2008), but it
also may be positive (Nier and Baumman, 2006).
Moreover, when there are information asymmetries, a significant
proportion of fluctuations in bank earnings is kept as retained earnings, and
increases in earnings will spark increases in capital ratio, so we can expect a
positive relation between ROE and capital. Consistent with this argument, Berger
(1995), Nier and Baumann (2006), and Francesco d’Avack and Sandrine
Levasseur (2007) find a positive relation between ROE and cost of capital. The
opposing arguments and mixed empirical evidence lead us to include ROE as a
H1 : Return on Equity (ROEt-1) is more likely to give negative influence on Capital Buffer
2.3.2 The Effect of Bankruptcy Costs or Financial Distress Proxy by Non
Performing Loan (NPL) toward Capital Buffer Banking in Indonesia
The risk profile of each institution is proxied by NPL, which measures the
non performing loans ratio (ratio of non performing loans to total loans). This is
an ex post measurement of the risks assumed by the institution and, therefore, the
theory predicts this coefficient should be positive since higher risks increase the
probability of meeting regulatory capital constraints and facing the related costs
such as market discipline and supervisory intervention (Furfine, 2000; Estrella,
2004). Riskier banks should therefore raise capital. A negative coefficient
however would indicate "moral hazard” behaviour, where banks assume higher
risks with lower buffers. It could also indicate more sophisticated risk
management systems, allowing banks to hold lower buffers for the same amount
of risk (Alfón et al., 2005).
H2 : Non Performing Loan (NPL) is more likely to give positive
2.3.2. The Effect of Adjustment Cost proxy by Increment of Capital Buffer
(∆BUFF)toward Capital Buffer Banking in Indonesia
As argued by Ayuso et al. (2002) and Estrella (2004), lag of Capital Buffer
(BUFFt-1) coefficient may be interpreted as a measure of adjustment costs in
capital buffers. The lagged endogenous is introduced to reflect the presence of
adjustment costs in attaining the desired level of capital for banks and its expected
sign is thus positive. Since the capital buffer decissions not only determined by
adjusting capital buffer in the period before (t-1), but also determinded by capital
buffer in this perode (t), so the right variable for capital adjustment is increment of
capital buffer by seeing decreasing or increasing of the turning point.
H3 : Increment of Capital Buffer (∆BUFF) is more likely to give
positive influence on Capital Buffer
2.3.3. The Effect of Other Determinants (Loans to Total Assets, and Bank’s
Share Assets) toward Capital Buffer Banking in Indonesia
The loans’ to total assets ratio (VLOAN) are also considered in the
analysis. VLOAN expected to relate positively to Capital Buffer (BUFF).
Eventhough Prasetyantoko and Soedarmono (2010) showed the negative impact
of VLOAN toward Capital Buffer (BUFF), this suggests that the more bank
distribute their credit, the smaller level of capital buffer being reserved. But this
research agree with positive corelation between Loans to Total Assets and Capital