*Tel.:#9 31 40 247 2716; fax:#9 31 40 243 6492
E-mail address: [email protected]. (W.A.J. Schippers).
An integrated approach to process control
Werner A.J. Schippers*
Eindhoven University of Technology, Faculty of Technology Management, P.O. Box 513, Pav. C12, 5600 MB Eindhoven, Netherlands Received 28 May 1998; accepted 4 August 1998
Abstract
The control of production processes is the subject of several disciplines, such as statistical process control (SPC), total productive maintenance (TPM), and automated process control (APC). Although these disciplines are traditionally separated (both in science and in business practice), their goals have a great deal of overlap. Their common goal is to achieve optimal product quality, little downtime, and cost reduction, by controlling variations in the process. However, single or separated parallel applications may be not fully e!ective. This implies the need for an integrated approach to de"ne, describe and improve the control of production processes. This paper discusses how controls from disciplines such as SPC, TPM and APC can be seen as a coherent set of e!orts directed to the technical control of production processes. To achieve this, an integrated process control (IPC) model is introduced. The model provides a structure to get an overview of the functions of controls and their interrelations. It shows that there is no one best way to control a process: the optimal set of controls depends on the situation. The main contingencies are brie#y addressed. The possibilities to use the model for prescribing, describing and improving control are illustrated. Finally, implications for business practice are discussed. ( 2001 Elsevier Science B.V. All rights reserved.
Keywords: Process control; Integration; Framework; Contigencies; SPC; APC; TPM
1. Introduction
The work described in this paper is part of a re-search that is focussed on structuring the tools of statistical process control and studying the possi-bilities to apply them in di!erent situations [1]. Statistical process control traditionally uses output measurements to control the stability of a process and to detect causes of non-stability (out of control
situations) [2,3]. However, as a result of the trend to strive for prevention instead of detection, SPC is shifting from controlling product characteristics to controlling process input and process factors. The goal of this shift is to detect and resolve problems in the process before they can lead to (in-stable) vari-ation in the product. It shows that in some cases statistical tools such as control charts can be used to monitor process factors (such as furnace temper-atures), but in many cases, other tools, such as maintenance and automated controls that are part of other disciplines than SPC, are used to achieve process control.
Thus, the control of production processes is the subject of statistical process control (SPC) but also of several other disciplines, such as total productive maintenance (TPM) [4], and automated process control (APC) [5]. In this paper we will focus on SPC, TPM and APC, because they are three well known and frequently used examples of disciplines directed to process control. However, one could think of other related`disciplinesathat are directed to the control of production processes, such as source inspection and Poka Yoke [6]. Although each discipline has a speci"c approach to process control, there is a great deal of overlap between these disciplines because of their common goal: to achieve optimal process performance in terms of product quality, downtime, and costs, by control-ling variations in the process.
Despite this overlap, these disciplines are tradi-tionally separated, both in science and in business practice. In practice each discipline is often initiated by separate departments: SPC by the quality de-partment and production; TPM by the mainte-nance department; APC by the engineering depart-ment. In these cases e!orts to improve control tend to be limited to tools from one of these this disci-plines, or in case controls from di!erent disciplines are used, they are often not related to each other. This may result in single, or separated parallel mono-disciplinar applications. Since the tools from various disciplines are partly additional, but also partly overlapping alternatives, this situation may be not fully e!ective.
Also in literature the overlap of process controls did not result in an integrated approach to process control. Although literature from the separate dis-ciplines partly claim the same area, most of the referred publications from these disciplines hardly mention each other. Instead they tend to re"ne and expand their particular"eld to the level of control programs, thus implicitly claiming a larger part of the working areas of other disciplines. If tools from other disciplines are mentioned they are often de-picted as part of or supporting to the one described. Some papers discuss the integration of SPC and APC, but mainly focus on the mathematical aspects of integration [7}9]. Other papers discuss the in-tegration of SPC-related techniques and TPM [10,11], but limit the discussion to management
aspects. This paper however, presents a generic approach that also integrates process control tools outside the "elds of SPC, TPM and APC, and addresses technical operation aspects of integra-tion.
The"rst goal of this paper is to show the rela-tions and overlap of controls from di!erent disci-plines, and thus the need for an integrated approach to process control. After a discussion of the working areas and overlap of SPC, TPM and APC, the need for an integrated approach is ad-dressed. The second goal of this paper is to present a model that supports an integrated approach to process control, by providing a structure to de-scribe and systematize the controls of a process. This model, the IPC model, is introduced and the possibilities to use the model for business practice and scienti"c purposes are discussed. Finally, con-clusions and directions of further research are ad-dressed.
2. Working area and overlap of SPC-, TPM- and APC process controls
The common goal of SPC, TPM and APC is to reduce and to control the variation in a process. To achieve this, they rely for a great deal on de"ning activities to monitor production processes. These activities will be de"ned as controls. In this paper, we will concentrate on these controls and their application in discrete production processes. We consider discrete production processes, because in this type of production, the overlap of di!erent disciplines is clearly visible. To illustrate this over-lap between the di!erent process control disci-plines, below we will give a brief description of the working areas claimed by SPC, TPM and APC. After this, we will indicate their interrelations by discussing examples of what can cause the need to consider controls from di!erent"elds as an alterna-tive or combination.
2.1. Working area of SPC
underlying processed. In SPC, a stable process is de"ned as a process with only common (process inherent) causes of variation, resulting in a stable location and a stable spread around this location. To monitor the process, samples of product or process characteristics are taken with a certain fre-quency (e.g. hourly). Statistical tools such as con-trol charts, are used to determine whether the process location (mean) and spread (variation) are stable.
If the process is unstable there are supposed to be special causes of variation that are not process-inherent; this will be detected as an `Out of Con-trola. An out of control action plan (OCAP [12]), is used by the operators of the process, to determine how to "nd and remove these special causes of variation. The causes can be found in all parts of the process, e.g. material, machine, tools, machine settings, human factors, etc. Although OCAPs specify the required changes in process factors in case of an out of control, SPC has little tools to really control these process factors at the source.
SPC thus allows for random variations and mi-nor changes in the outcome of a process: Out of controls will only be detected by control charts in case of rather large disturbances. Furthermore, stability of a process does not mean that all prod-ucts are within speci"cations. Process capability studies are used to determine whether the stable process results in products that fall within the speci-"ed tolerances. This is achieved through relating the process inherent variation to the product toler-ances.
Recent publications stress that the power of SPC is not the application of statistical tools, but the `applicationa of statistical thinking [13,14]. In short, statistical thinking is based on the awareness that all work occurs in processes (including non-production processes), that all processes are subject to variation, and that understanding and controlling causes of variation improves pro"t. This way SPC becomes a con-cept that is very broad and can be used through-out the organization. In this paper however, we will only discuss SPC control tools used in production, as described in SPC textbooks (see e.g. [3]).
2.2. Working area of TPM
TPM [4,15,16] is directed to optimize the e! ec-tive use of production installations. This e! ec-tiveness is measured by the overall equipment e!ectiveness (OEE). The OEE can be worsened by six losses. These losses include time-related losses (1: breakdowns, 2: setup and adjustment time, 3: idling and minor stoppages, 4: reduced speed) and quality losses, 5: defects from running process, 6: defects from startup). Although setup and adjust-ment time is also in#uenced by organizational in-#uences, the OOE is largely in#uenced by the level of control of the process. The quality losses are cumulated for all product characteristics, unlike SPC where, in general, single characteristics are considered. The OOE is also not measured as fre-quently as SPC measurements, typical frequencies are once a week or once a month. Often the OOE is calculated for a series of process steps.
If the OOE becomes too low, possible causes in the hardware of the process are looked for and removed. However, the main goal of TPM is to reduce and prevent the six losses by controlling production installations, i.e. the hardware of a pro-duction process. The most important controls of process factors are di!erent types of maintenance activities. These maintenance activities are de"ned on a lower level than the OOE is measured, i.e. on single machines or machine parts.
Similar to SPC, TPM is also transformed into a concept, i.e. a way of managing processes [4,15]. In this paper, we will concentrate on the OOE measurements and the activities to control produc-tion installaproduc-tions, as described in TPM text books (see e.g. [4]).
2.3. Working area of APC
Table 1
Overview of working areas of SPC, TPM, and APC
Discipline Performance aspects Process factors (controlled) Measurements (frequency of) Scope SPC Quality; sudden shifts and trends
in location and spread
All (but not speci"c) Infrequent, e.g. hourly; on-line Process step TPM Time and quality; longer term
deteriorations
Hardware (machine, tools, settings)
Low frequency e.g. weekly; o!-line
Process line APC Quality; short-term, minor
disturbances in autocorrelated individual values;
Settings Very frequent-continuous
seconds}minutes; on-line
Process step part [17,9]. To control the process, very frequent or
continuous measurements of a product or process characteristic are taken and compared with a target value. The observed variations are compensated by automatic changes in controllable process factors. The goal is to minimize the deviations of output characteristics from their target values.
For automated control loops it is necessary to know the exact relation between process para-meters and process output. Often, however there are too many factors in#uencing the output to determine this relation. In many cases the relation between settings and process parameters, e.g. gas #ow and oven temperature is better know than the exact relation between furnace temperature and product characteristics. Therefore, APC is often used for feedback loops on process characteristics instead of output characteristics, e.g. to keep an oven temperature on target. Feed-forward loops are also possible; for instance the setting of drying time or oven temperature based on measuring the humidity of the material input.
If it is not possible to correct disturbances, APC can also be used to detect deviations from target and to give a signal (e.g. alarm or machine stop), or to sort out the deviating product. Thus APC includes sensors and limit switches that somehow automatically act on observed devi-ations.
Automated controls are mainly applied in the chemical industry, where variation is often largely auto-correlated and (chemical) process models are present [5], but automated control loops are also used in production machines for discrete products (part production). APC can be extended to a
con-cept with a very broad working"eld, namely con-trol theory (CT). CT also includes concon-trol loops that are not automated, continuous, or directed to drifts of the process mean; it can even be applied for non-production processes. In this paper we will consider APC controls as described in standard APC textbooks (see e.g. [5]).
The working areas of SPC, TPM, and APC are summarized in Table 1.
Starting from the application of tools from one discipline, there are several reasons that may cause the consideration of controls of other disci-plines to be alternatives or additions. Some exam-ples are:
f Traditional SPC controls measure output char-acteristics to monitor the stability of a process. However, the trend towards defect prevention, may result in measuring process factors (root causes) often process parameters [18]. In some cases it is not useful to apply a control chart to monitor a process factor. Instead, a sensor (APC) or periodical check (TPM) may be more e! ec-tive.
3. The need for an integrated approach to process control
As Table 1 shows, the controls from each disci-pline concentrate on one or more parts of the process (process factors such as machine, human, tooling, methods, settings, etc.). Furthermore, there are also di!erences and similarities in the part of the performance of the process and the level (qual-ity aspects, time aspects; on product or product characteristics level). One can conclude that the controls from each discipline are strongly related and may partly be considered as each other's alter-natives or additions. Especially on the operational level there is a large overlap: The outcome of an analysis to improve process control might be a con-trol chart (SPC), a maintenance task (TPM), or a sensor (APC). This implies a need for an integ-rated approach to process control. Although not all controls that are used in practice are part of the discussed disciplines, the need to consider them as a coherent set of tools to choose from, applies to all relevant controls.
The need for an integrated approach to process control may arise when processes that could be controlled with tools form one discipline are chang-ing to more hybrid processes, e.g. some parts pro-duction processes that used to be controlled with SPC controls, are get characteristics of chemical processes when transformed to high-speed mass production processes (thus APC tools can be used). Also when higher demands are placed on a process, controls from one discipline may not be e!ective enough to achieve this. This may lead to the need to consider techniques from di!erent"elds to combine or as an alternative [20]. Apart from the overlap in the basic controls of the disciplines, the need for integration on the operational level is enlarged when they are viewed as parts of organization wide management concepts, such as total quality man-agement and world class manufacturing (WCM) [10,11,16].
Regardless of the exact circumstances, approach-ing process control from one discipline, implies the danger of sticking to the tools of this discipline and thus not "nding the optimal solution for process control. Instead, when de"ning, describing or im-proving the control of production processes, the
disciplines should be seen as a coherent set of controls. However, there is no model that can be used to structure and integrate the large variety of controls. Such a model should be able to position controls and their relations, regardless of the type of process. Furthermore, it should give insight to determine to what extend controls are com-plementary or overlapping. To achieve this it is necessary to structure the"eld of process controls. This will be discussed in the next section.
4. The IPC model: Structuring process controls
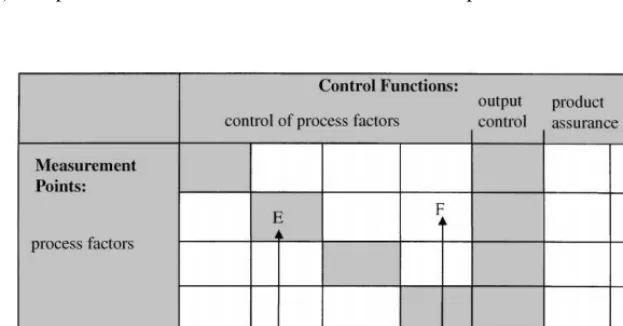
To support an integrated approach to process control we introduce the integrated process control (IPC) model (see Fig. 1 for a schematic representa-tion). This conceptual model structures the di! er-ent areas of process controls by plotting the controls of a process on two dimensions: On the horizontal axis the goal or function of a control, and on the vertical axes the place in the process where control measurements are taken. These two dimensions are discussed below.
4.1. The function or goal of controls
Although all controls are directed to process control, not all controls are each other's direct alternatives. Within the goal of process control there are groups of controls with di!erent sub-goals or functions. The functions of process controls can be used to group controls and to give insight in their relation [1]. The columns of the IPC model represent the di!erent functions of controls. The functions that are used in the IPC model are:
f controlling speci"c process factors, e.g. incoming material, machine characteristics, human factors or machine settings,
f controlling the process output in general, i.e. verify that the process output is stable (in SPC terms this is statistical control),
Fig. 1. Schematic representation of IPC model.
f performance measurement and analyses of pro-cess output, measuring over a longer period of time and thus not directed to production orders.
General process control (e.g. using a control chart) gives no guarantee for product conformance (see e.g. [20,21]), therefore product assurance is a separate function. One could argue that product assurance, and performance measurement and ana-lyses are not real control activities, but they are part of control loops directed to controlling process performance.
4.2. The measurement point of controls
To ful"ll a certain function one can measure at several points in a process. The main di!erence is between measuring process factors and process output. These main categories can be further divided. The categories that are used as the rows of the IPC model are:
f process factors (e.g. incoming material, machine characteristics, human factors or machine set-tings),
f output product on line (while process is running regular production),
f output product o! line (while process is not running regular production, or over a longer period of time),
f time aspects on line (i.e. downtime, stops and production speed measured while process is run-ning),
f time aspects o!line (i.e. over a longer period of time).
In Fig. 1 two examples of process controls are depicted. Control A is directed to controlling a spe-ci"c process factor (e.g. the settings of the process), based on measurements of another process factor (e.g. incoming material), an example of such a con-trol is an APC feed-forward system. Concon-trol B is directed to general output control based on on-line measurements of process output, an example of a control of this type is an (SPC) control chart.
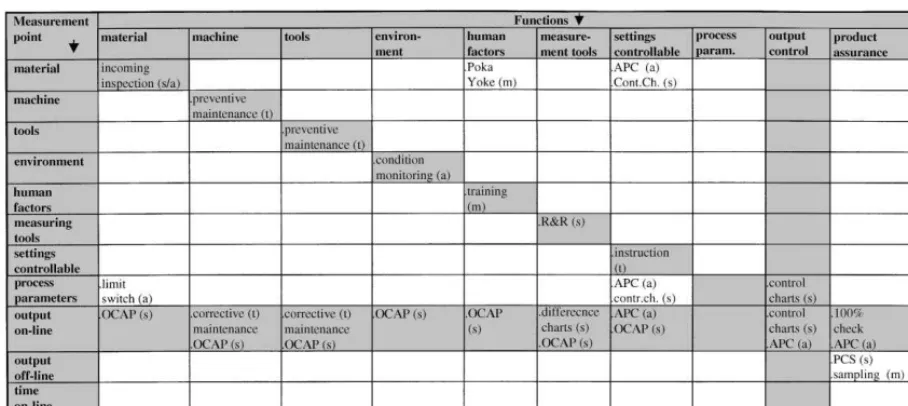
In the IPC model depicted in Fig. 2, a few illus-trative examples of controls and their discipline (abbreviation between brackets) are entered. The examples are placed by the functions and measure-ment points of typical applications found in litera-ture. Some cells of the model might be crossed out because practical controls that"t these combina-tions of function and measurement point are very unlikely. For some ways of using the model, it is "lled with a large number of possible controls. The possibilities to use the model are discussed in the next section.
Fig. 2. The integrated process control (IPC) model with some typical examples. (s)"SPC, (t)"TPM, (a)"APC, (m)"miscellaneous.
4.3. The control of process factors
f Materials can be controlled by incoming inspec-tion, but can also be controlled`in processaby measuring process parameters (e.g. oil pressure when deepdrawing sheetmetal parts, to detect when material thickness is deviating or double sheets are being inserted). As an output-oriented alternative, an OCAP [12] can be used. An OCAP prescribes how operators should react when process output is not in control. To do this, it can prescribe actions to remove causes in ma-terials used, but also in other process factors such as machine or tools.
f Machines and tools can be controlled by both preventive and corrective maintenance, (i.e. based on measuring output). One can see that corrective maintenance (TPM), and an OCAP (SPC) that refers to a machine or tool, are more or less the same: both prescribe actions on tools or machine, based on output measurements. f To control the environment in a preventive way,
condition monitoring (e.g. using APC controls) can be used. An alternative is using an OCAP to take the necessary actions based on deviating output measurements.
f Human factors can be controlled by training operators, but also by fool-proo"ng the process, e.g. detecting the absence or wrong positioning of material using Poka Yoke techniques [6]. Again also OCAPs can be used.
f Measurement tools can be controlled in a pre-ventive way by periodically performing a gage Repeatability and Reproducibility (R&R) study [3] to check the performance of the measure-ment tools used. An alternative is to use control charts to investigate the stability of the measure-ment tool, by monitoring di!erences between repeated measurements for one product. An-other&reactive'approach is to use an OCAP. f The settings of the process can be controlled by
instructions for operators to make the right set-tings and check them. Also control charts or APC feedforward and feedback controls can be used.
4.4. Output control and product assurance
be adequately described by a deterministic model, APC controls should be used.
f In some cases where a product characteristic is hard to measure, but it is known to be largely dependent of a process parameter (e.g. cutting force or bath concentration), also measurements of this process parameter can be used to monitor the stability of the whole process and thus con-trolling process output.
f Output control, e.g. using a control chart, some-times makes on-line product assurance super# u-ous. In these cases process capability studies (PCS) can be used o!-line to con"rm product conformance. When output control is not su$ -cient (i.e. reject rates are too high) additional 100% checks or APC controls may be necessary to assure product quality.
f An`old-fashionedaapproach to assure product quality o!-line is using sampling plans (e.g. mili-tary standard 414 (MIL STD 414) [22]) to take samples and to determine whether the quality level of a batch of products is acceptable.
4.5. Performance measurement and analyses
f Process capability studies can be used to measure and analyze the performance of a process. f The TPM OEE measurements are largely
com-plementary to a PCS and other SPC controls: A limitation of SPC (and also APC tools) is, that the considered aspects of performance are mostly product characteristics. In many production processes, however, quality problems will be de-tected in some way, and cause the machine to stop. This means a change from product quality problems to time problems: although scrap and rework may be reduced to PPMs, process con-trol may continue to be poor. Therefore addi-tional time-related controls, such as TPM indices, should be used.
f TPM is used to monitor output performance on a weekly level, and on a total product level, i.e. it does not monitor separate product character-istics during production. To ful"ll the necessary control and assurance functions and to provide information on defect levels, SPC or APC tools should be used.
5. Use of the IPC model
To support an integrated approach to process control, the IPC model can be used in di!erent ways; both for academic and business purposes. There are four ways of using the model, varying from describing the controls of a process to prescri-bing and planning of controls in the future.
5.1. Use of the model to understand overlapping and complementary xelds of e.g. SPC, ¹PM and APC
The model can be used to give an overview of the di!erent types of controls and give insight into the goals of controls from several disciplines, their overlap and relationships. In this way it becomes apparent that some controls have more or less the same goal and can be seen as alternatives (see previous section).
5.2. Use of the model on the descriptive level
On a descriptive level the IPC model can be used to describe the controls of a process and `mapa them to visualize the places where controls are used. In this way the IPC model can be used to document process knowledge. Because of its gen-eric structure based on goals and measurement points of controls, the IPC model can be used regardless of the type of process. The model can also be used to provide a structured toolbox with alternative controls to choose from. For this pur-pose a larger number of controls can be listed in the model. Related to this is the approach that uses the model as a checklist to describe the controls of a process by quickly marking the used controls.
5.3. Use of the model on the analyses level
Fig. 4. Schematic representation of in#uence situational characteristics in IPC model. Fig. 3. Applicability model (adapted from [1]).
situations. Whether a control function is important enough to execute and how it is executed by using a control, depends on the situation (e.g. the type of process or type of product). Schippers [1] describes the"t of a control as the applicability, and intro-duces an applicability model and models for situ-ational factors to study the"t of statistical process control techniques and their in#uence. Fig. 3 de-picts the applicability model.
Riis [16] also introduced a conceptual model that considers situational characteristics of an en-terprise to determine the optimal (TPM) mainten-ance pro"le. However, this model is used to de"ne this pro"le on a company level, whereas it is very well possible that di!erent processes within a
com-pany ask for a di!erent approach in maintenance as well as for other process control activities.
arrows indicate the direction of change in the type of controls used.
1. ¸evel of technical control/product risk: When the risk level is high, output control tends to be combined with product assurance controls and speci"c controls for process factors: when pro-cess demands are pushed higher, it may be ne-cessary to control variation at the sources and/or to "lter out all deviating products by 100% measuring [21], e.g., in some cases, SPC tools are not powerful enough to achieve very low defect levels (i.e. PPM levels). Instead, 100% checks or APC measurements may be necessary to totally assure product quality [20,23]. In other cases, the only way to achieve low defect rates is to control process factors.
2. Output failure pattern: The output failure type and failure pattern (e.g. deviation of mean, variation problems, single outliers) deter-mine which output measurement tool can or should be used. When a process is in statis-tical control (following the SPC de"nition), vari-ation is assumed to be process inherent. In such situations the role of statistical controls is lim-ited to monitoring variation. To be able to re-duce the variation any further, it may be necessary to de"ne (additional) APC controls [24]. If there is no suitable output control for the pattern, process factor controls may be used instead [21].
3. ¸evel of process knowledge: If the level of pro-cess knowledge is low, controls tend to be output-oriented (in terms of functions and measurement points): speci"c controls for pro-cess factors are not possible without propro-cess knowledge).
4. Dominance of process factors: If one process fac-tor is the most important cause of output devi-ations, the controls tend to focus on this factor. For instance, TPM concentrates on process con-trols for machines and tools. However, it is very well possible that not the tooling or machine is dominant but another process factor, such as an operator, or the settings of a machine. In these cases controls from other disciplines may be more appropriate. Also in cases where the ma-chine or tools are dominant, maintenance is not
necessarily the optimal solution. Sometimes it is better to control process characteristics using other controls than maintenance activities (for instance APC controls).
5. Absence of dominant process factor: If there is no real dominant factor and instead there are many moderate causes, this may cause a shift to gen-eral output control; the same is true when a process is immature and many causes of vari-ation exist: in these cases it is not possible to control all these causes separately at the source; instead output controls and feedback loops can be used.
6. Process failure pattern: The type and pattern of failures in process factors determine which measurement point and which control is used to control this factor; e.g. it may be hard to measure a deterioration in a machine (situ-ational maintenance), but easier to detect the resulting change in the output (corrective main-tenance).
7. Company/peoples vision on process control: When a company's vision on process control is detection oriented instead of prevention oriented, often controls are de"ned on the out-put side of the process and merely for product assurance because one sees no need to monitor the stability of the process output by process or output control.
8. Costs of control and turnover: If the costs of controls are low relative to the turnover of pro-duction, this leads to additional controls, both for assurance and process factors: more"nancial room for control allows the use of extra controls or controls with high start-up costs; on the other hand, when there is a high turnover the possible losses through poor control are higher (see 1: product risk).
9. Ease of measuring product output: If product output is hard to measure, process control will shift to process factors. Also if many types of product are produced with a process, process control will be more on process factors.
Fig. 5. Schematic representation of a roadmap in the IPC model.
5.4. Use of the model on a prescriptive level
Based on knowledge of situational factors, the IPC model can be used to prescribe scenarios or design pro"les of the set of controls that"ts a cer-tain `standardasituation. Future research should provide the necessary knowledge on situational factors (see Section 7).
The IPC model can also be used to prescribe transitions in time: the optimal set of controls does not only di!er between di!erent processes, but also within one process the optimal set of tools can vary in time [1]. The IPC model can be used to map the `roadathat should be followed. Another reason to consider a map of transitions in time is the fact that it may be impossible to go directly from the current set of controls to the `optimala set of controls. Some transitions may be necessary. The IPC model can be used to de"ne the improvement path.
A typical roadmap of transitions in time, that resembles the historical development of SPC con-trols as addressed in the introduction, is as follows. (A schematic representation of this roadmap in the IPC model is depicted in Fig. 5. The arrows indi-cate the change in controls when moving from one situation to another.)
f The traditional approach to process `controla was often product- and detection oriented (prod-uct assurance): samples are taken from a batch of
products after "nishing production (output o! -line) (situation A).
f The next step is not to wait until a batch is "nished but to measure products while being produced (output on-line), in order to prevent whole batches to be wrong. The samples are compared with product tolerances to assure product quality (product assurance) (situation B).
f Based on the ideas of SPC, the next step is to measure products in samples during production (output on-line) and to compare means and ranges of these samples with control limits based on a stable process (i.e. control charts). If samples fall outside these limits the process is out of control and therefore stopped to look for causes. The goal is to control the process by monitoring its output (output control). This is situation C. f While using control charts as in situation C, it
shows that most of the problems that occur can be related to a few dominant process factors, e.g. a deviating process setting, and the wear of a ma-chine part. These causes are the input for an OCAP, a #owchart to prescribe how to deter-mine and to remove the causes of an out of control situation (situation D added to C). In this way the control loop is closed.
measures are taken directed to the control of dominant process factors, e.g. the wear of the machine part is controlled by a conditional pre-ventive maintenance scheme (situation E). To prevent problems with the process setting, APC is used to measure material thickness and use a feed forward signal to adjust the setting (situ-ation F).
6. Implications for business practice
The most important implication for business practice is, that implementing IPC ensures that all relevant controls are considered and, if necessary, combined as a coherent set of controls. The IPC model supports such an integrated approach when describing, analyzing or prescribing the control of processes. These activities will be used when im-proving the control of existing production pro-cesses, or designing a control system for a new process.
Improving the control of production processes based on one discipline, is often part of an imple-mentation program. Such a program (see e.g. [25] for SPC) often consists of an organizational part and a stepwise methodology to analyze a process and select the right controls. The implication of the IPC model is not that companies that are running an SPC or TPM program should abandon this or start up additional mono-disciplinar programs. It is also not necessary to use a special implementation program for IPC. Starting from one discipline and considering all relevant controls is su$cient.
However, it is important to use an implementa-tion program, since achieving an e!ective control of production processes is more than choosing the right controls. Concerning the implementa-tion of both SPC [25] and TPM [16], authors stress the importance of organizational aspects, such as management commitment, operator in-volvement and empowerment, training, and imple-mentation management. An implementation program should assure that attention is given to these aspects.
The IPC model also has implications for process design activities. The task of the design department is not only to de"ne the product and the process,
but also the controls of the process. One should not wait for the actual production start-up to de"ne controls. This also prevents the development of products and processes that are di$cult to control. The IPC scenarios mentioned above, can be used as design pro"les for controls. Besides this, the IPC model can be used as a toolbox to select control tools. Again the most important implication is that all relevant controls are considered and if necessary combined as a coherent set of controls.
7. Conclusions
This paper shows the need for an integrated approach to process control in production. The goals of controls from various disciplines are inter-related and partly overlapping. In this way they can be each other's alternatives or can function as use-ful supplements. The risk of approaching process control from one discipline is that process controls are limited to process control tools and aspects of this discipline which may be not optimal or even counterproductive.
To support an integrated approach to process control, the IPC model is introduced. The model can be used to understand, describe, analyze and prescribe the control of production processes. In using the model, it is important to consider the in#uence of situational factors. Preliminary re-search already gives insight in these`contingencya in#uences, but additional research is necessary in this respect. Although this paper focuses on con-trols on the operational level, organizational as-pects also play an essential role in an e!ective control system.
In future research, a model similar to the IPC model will also be developed for control activities in product and process development, and also for activities for performance measurement and im-provement. All these elements will be combined into a decision support system for the application of process control techniques. The decision support system should provide:
f methods and guidelines for"lling in these mod-els, including control scenarios and organiza-tional guidelines,
f a database with control tools, including informa-tion on funcinforma-tions and situainforma-tional factors of pro-cess control tools.
The goal of all this is to structure the wide variety of control tools, and to help organizations to use them in an e!ective and e$cient way.
References
[1] W.A.J. Schippers, Applicability of statistical process con-trol techniques, International Journal of Production Econ-omics, 56}57 (1998) 525}535.
[2] W.A. Shewhart, Economic Control of Quality of Manufactured Product, Van Nostrand Reinhold, Prin-ceton, 1931.
[3] D.C. Montgomery, Introduction to Statistical Quality Control, 3rd ed., Wiley, New York, 1996.
[4] S. Nakajima, Introduction to TPM, Productivity Press, Cambridge, MA, 1988.
[5] G. Stephanopoulos, Chemical process Control: An Intro-duction to Theory and Practice, Prentice-Hall, Englewood Cli!s, NJ, 1984.
[6] S. Shingo, Zero Quality Control: Source Inspection and the Poka-Yoke System, Productivity Press, Stanford, Con-necticut, 1986.
[7] D.C. Montgomery, W.H. Woodall, A discussion on statist-ically-based process monitoring and control, Journal of Quality Technology 29 (2) (1997) 121}162.
[8] G.E.P. Box, T. Kramer, Statistical process control and feedback adjustment} A discussion, Technometrics 34 (1992) 251}285.
[9] G. Box, A. Lucen8o, Statistical Control by Monitoring and Feedback Adjustment, Wiley-Interscience, Chichester, 1997.
[10] R.S. Jostes, M. Helms, Total productive maintenance and its link to total quality management, Work Study 43 (7) (1994) 18}20.
[11] E.M. Dar-El, What we really need is TPQM!, Interna-tional Journal of production Economics 52 (1997) 5}13.
[12] J.P. Sandorf, A.T. Bassett III, The OCAP: Predetermined responses to out-of-control conditions, Quality Progress 26 (3) (1993) 91}96.
[13] R.W. Hoerl, Enhancing the bottom-line impact of statist-ical methods, ASQC Statistics Division Newsletter 15 (2) (1996) 6}18.
[14] W.A.J. Schippers, R.J.M.M. Does, 1997. Implementing statistical process control in industry, the role of statistics and statisticians. Proceedings of the Tempus Workshop: Statistics at Universities, Its Impact on Society, EoKtvoKs University Press, Budapest, pp. 65}82,
[15] P. Willmott, Total Productive Maintenance: the Western Way, Butterwordth-Heinemann, Oxford, 1993.
[16] J.O. Riis, J.T. Luxhoj, U. Thorsteinsson, A situational maintenance model, International Journal of Quality & Reliability Management 14 (4) (1997) 349}366. [17] D.C. Montgomery, J.B. Keats, G.C. Runger, W.S. Messina,
Integrating statistical process control and engineering pro-cess control, Journal of Quality Technology 26 (2) (1994) 79}87.
[18] J. Scott, K. Golkin, 1993. Rapid deployment of automated SPC systems, Industrial Engineering, 18}20.
[19] A.C. Palm, SPC versus automatic process control, Annual Quality Congress Transactions, vol. 44, ASQC, Mil-waukee, WI, pp. 694}699.
[20] A.G. Robinson, D.M. Schroeder, The limited role of stat-istical quality control in a zero-defect environment, Pro-duction and Inventory Management Journal 31 (4) (1990) 60}65.
[21] C.M. Hinckley, P. Barkan, The role of variations, mistakes and complexity in producing nonconformities, Journal of Quality Technology 27 (3) (1995) 242}249.
[22] MIL-STD-414, Sampling procedures and Tables for In-spection by Variables for Percent Defective, Military Stan-dard, US Department of Defense, Government Printing O$ce, Washington, DC, 1968.
[23] D.P. Osborn, Statistical power and sample size for control charts}survey results and implications, Production and Inventory Management Journal 31 (4) (1990) 49}54. [24] V.E. Sower, Ph.R. Foster, Implementing and evaluating
advanced technologies: A case study, Production and In-ventory Management Journal 31 (4) (1990) 44}47. [25] R.J.M.M. Does, W.A.J. Schippers, A. Trip, A


![Fig. 3. Applicability model (adapted from [1]).](https://thumb-ap.123doks.com/thumbv2/123dok/3115226.1378420/9.544.93.416.413.606/fig-applicability-model-adapted-from.webp)