ECONOMIC ANALYSIS OF KM MINA JAYA NIAGA
LONGLINER SHIP CONVERSION TO FISH CARRIER SHIP
Nyimas Safira Amalia NRP 4213 101 028
Dosen Pembimbing
Raja Oloan Saut Gurning, S.T., M.Sc., Ph.D Taufik Fajar Nugroho, S.T., M.Sc
LONGLINER SHIP CONVERSION TO FISH CARRIER SHIP
Nyimas Safira Amalia NRP 4213 101 028
Dosen Pembimbing
Raja Oloan Saut Gurning, S.T., M.Sc., Ph.D Taufik Fajar Nugroho, S.T., M.Sc
LONGLINER SHIP CONVERSION TO FISH CARRIER SHIP
Nyimas Safira Amalia NRP 4213 101 028
Dosen Pembimbing
i
BACHELOR THESIS – ME 141502
ECONOMIC ANALYSIS OF KM MINA JAYA NIAGA LONGLINER SHIP CONVERSION TO FISH CARRIER SHIP
NYIMAS SAFIRA AMALIA NRP. 4213 101 028 Supervisor :
Raja Oloan Saut Gurning, S.T., M.Sc., Ph.D Co-Supervisor :
Taufik Fajar Nugroho, S.T., M.Sc. DOUBLE DEGREE PROGRAM OF MARINE ENGINEERING DEPARTMENT Faculty of Marine Technology
Institut Teknologi Sepuluh Nopember Surabaya
ii
iii
SKRIPSI – ME 141502
ANALISIS EKONOMI KONVERSI KM MINA JAYA NIAGA LONGLINER SHIPMENJADI KAPAL PENGANGKUT IKAN
NYIMAS SAFIRA AMALIA NRP. 4213 101 028 Dosen Pembibing 1 :
Raja Oloan Saut Gurning, S.T., M.Sc., Ph.D Dosen Pembimbing 2 :
Taufik Fajar Nugroho, S.T., M.Sc. PROGRAM DOUBLE DEGREE
DEPARTEMEN TEKNIK SISTEM PERKAPALAN Fakultas Teknologi Kelautan
Institut Teknologi Sepuluh Nopember Surabaya
iv
v
vi
vii
viii
DECLARATION OF HONOR
I, who signed below hereby confirm that:
This bachelor thesis report has written without any plagiarism act, and confirm consciously that all the data, concepts, design, references, and material in this report own by Reliability, Availability, Management and Safety (RAMS) in Department of Marine Engineering ITS which are the product of research study and reserve the right to use for further research study and its development. Name : Nyimas Safira Amalia
NRP : 4213 101 028
Bachelor Thesis Title: Economic Analysis of KM Mina Jaya Niaga Longliner Ship Conversion to Fish Carrier Ship
Department : Double Degree Program in Marine Engineering
If there is plagiarism act in the future, I will fully responsible and receive the penalty given by ITS according to the regulation applied.
Surabaya,July 2017
ix
x
ECONOMIC ANALYSIS OF KM MINA JAYA NIAGA LONGLINER SHIP CONVERSION TO FISH CARRIER SHIP
Name : Nyimas Safira Amalia
NRP : 4213101028
Department : Double Degree Program of Marine Engineering Supervisor : Raja Oloan Saut Gurning, S.T., M.Sc., Ph.D Co-Supervisor : Taufik Fajar Nugroho, S.T., M.Sc.
ABSTRACT
KM. Mina Jaya Niaga is an asset that belongs to PT. IKI as one of Indonesian State Owned Enterprises according to Letter of Directorate General of Treasury Ministry of Finance Republic of Indonesia number S-3715/MK.6/2006 at 20 June 2005.There are 14 ships unit that had been completed and 17 ships set unit. Around 14 ships unit that had been completed, 2 units operated by PT. Perinus, 8 units are heavy damage and 4 units operated with minor repair. Therefore, it has been a terrible condition for KM Mina Jaya Niaga and need immediate decision to tackle the problems. Because of the restriction rules and to optimized the operational, KM Mina Jaya Niaga would be operated as a conversion from longline shipto fish carrier ship. On this thesis will be discussed about Economic Analysis of KM Mina Jaya Niaga Longliner Ship Conversion to Fish Carrier Ship. This thesis covers economic analysis based on operational pattern of KM Mina Jaya Niaga as fish carrier ship. Operational scenario from KM Mina Jaya Niaga, this fish carrier ship will be operated on WPP-RI 716 with home based port at PP Bitung. KM Mina Jaya will accommodate fish obtained from fishing vessels of with 50 GT on 4 fishing ground with estimated time for 1 voyage 18,92 hours, loading-unloading at PP Bitung 1 day, and time to berth at port 4 days. So, operational time for KM Mina Jaya Niaga is 6 days. Variable financing scenarios are performed to repair, modify and re-operate KM Mina Jaya Niaga as a fish carrier ship. Among them are self-funded by PT IKI as the owner of the vessel or joint funding with several parties. If viewed from an economic point of view, the conversion of KM Mina Jaya Niaga from longliner ship to fish carrier ship is feasible and can be a very profitable business.
xi
xii
ANALISIS EKONOMI KONVERSI KM MINA JAYA NIAGA LONGLINER SHIP MENJADI KAPAL PENGANGKUT IKAN
Nama : Nyimas Safira Amalia
NRP : 4213101028
Department : Double Degree Program of Marine Engineering Pembimbing 1 : Raja Oloan Saut Gurning, S.T., M.Sc., Ph.D Pembimbing 2 : Taufik Fajar Nugroho, S.T., M.Sc.
ABSTRAK
KM Mina Jaya Niaga adalah aset milik PT IKI sebagai salah satu Badan Usaha Milik Negara (BUMN), menurut Surat Keputusan Menteri Keuangan Republik Indonesia Nomor S-3715 / MK.6 / 2006 tanggal 20 Juni 2005. Ada 14 unit kapal yang telah selesai dan 17 kapal satuan. Sekitar 14 unit kapal yang telah selesai dibangun, 2 unit dioperasikan oleh PT Perinus, 8 unit mengalami kerusakan berat dan 4 unit dioperasikan dengan perbaikan ringan. Dikarenakan, kondisi KM Mina Jaya Niaga yang sudah sangat buruk dan butuh keputusan segera untuk mengatasi masalah tersebut. Dengan adanyaperaturan pembatasan dan optimalisasi operasionalnya, KM Mina Jaya Niaga akandimodifikasi dari kapal penangkap ikan menjadi kapal pengangkut ikan. Pada tesis ini akan dibahas tentang Analisis Ekonomi Konversi Kapal Longliner KM Mina Jaya Niaga menjadi Kapal Pengangkut Ikan. Tesis ini mencakup analisis ekonomi berdasarkan pola operasional KM Mina Jaya Niaga sebagai kapal pengangkut ikan. Skenario operasional KM Mina Jaya Niaga sebagai kapal pengangkut ikan, akan dioperasikan di WPP-RI 716 dengan pelabuhan di PP Bitung. KM Mina Jaya akan menampung ikan yang diperoleh dari kapal penangkap ikan kapasitas 50 GT di 4 titik tangkap ikan dengan perkiraan waktu untuk 1 pelayaran 18,92 jam, bongkar muat di PP Bitung 1 hari, dan waktu untuk bersandar di pelabuhan 4 hari. Sehingga total waktu operasional KM Mina Jaya Niaga adalah 6 hari. Skenario variabel pembiayaan dilakukan untuk memperbaiki, memodifikasi dan mengoperasikan kembali KM Mina Jaya Niaga sebagai kapal pengangkut ikan. Diantaranya didanai sendiri oleh PT IKI sebagai pemilik kapal atau dilakukan kerjasama dengan beberapa pihak. Jika dilihat dari sudut pandang ekonomi, konversi KM Mina Jaya Niaga dari kapal longliner menjadi kapal pengangkut ikan layak dilakukan dan bisa menjadi bisnis yang sangat menguntungkan.
xiii
xiv
PREFACE
Alhamdulillahirobbil’alamin. Thanks to presence of Allah SWT for everything that given to me, which was has given guidance so that the Bachelor Thesis with title “Economic Analysis of KM Mina Jaya Niaga Conversion to Fish Carrier Ship” can be done properly. When completing this Bachelor Thesis, I can’t do it alone. Therefore, I would like to thank those who helped me in completing this Bachelor Thesis, among others:
1. My everything, my all time lover, Nining Sri Sudarningsih, for all the support and love you have given to me. I am forever grateful. My first love and my role model, Kemas Djakfar Sodiq, for all his patience. I am forever your little daughter. My brother, Kemas Aulia Rakhmansyah Zain who always caring and loving me as I am. And My Grandmother.
2. Sutopo Purwono Fitri, S.T., M.Sc., Ph.D., as my father in Department of Marine Engineering since first semester until eight semester. Thank you for your advice and patience.
3. A.A.B. Dinaryana D.P., S.T., MES. Ph.D., as my father in RAMS Laboratory since day 1 I joined in this lab. Thank you for all your patience.
4. Raja Oloan Saut Gurning, S.T., M.Sc., Ph.D., as my first supervisor in this Bachelor Thesis. For constant help and pushing me to move forward during all phases of my work.
5. Taufik Fajar Nugroho, S.T., M.Sc., as my second supervisor in this Bachelor Thesis. For all the patience, attention and advice during my work on this thesis.
6. My uncle, Soedarjoko. My aunt, Widyasanti. My cousins, M. Nugratama Sudarsanto and Isnafa Safitri. Thank you for your kindness, help and support.
7. Fadilla Indrayuni Prastyasari, Ayudhia Pangestu Gusti, Putri Dyah Setyorini, Emmy Pratiwi, Danang Cahyagi, and Gede Bagus Bagus Dwi Suasti Antara, as my mentors during this Bachelor thesis. Thank you for all the advice and support.
8. Irfan Byna Nur Akbar and Danuja Wijayanto, as my partnerfor this thesis. 9. Dante Taufiq, Kevin Kurniawan, Ricard Diago, Zein Arfian, Hilda Gloria, I
xv
10. Faishal Rachman, Ellysa Maghda and Sri Rachmi.Thank you for the love and never ending patience that you gave to me.
11.Fitri Puspita Dewi, Muhammad Tri Kurniawan, Rizqi Ramadhan and Angya Prambiksono as my classmates during college life. Thank you for never ending support and always pray for each other.
12.Nabilah Amirah, Sekar Hardjono, M. Satrio Nurahman, Putu Gde Andhika. Thank you for the help and support.
13.Aditya Adi, Syahnan Ardi, and all of my friends for all the witness and share the laughter during my work on this thesis.
xvi
Contents
APPROVAL FORM ... Error! Bookmark not defined.
DECLARATION OF HONOR ... viii
1.2 Statement of Problems ... 1
1.3 Scope ... 2
2.2.1 General Conditions of Sulawesi Sea ... 4
2.2.2 Fish Catches ... 5
2.3 Type of Fishing Vessel ... 7
2.4 Economic Analysis ... 8
CHAPTER 3 ... 13
Methodology... 13
3.1 Methodology Flow Chart ... 13
3.2 Statement of Problems ... 14
3.3 Literature Review ... 15
3.4 Collecting Data ... 15
3.5 Data Processing ... 16
xvii
3.7 Conclusion and Recommendation ... 17
CHAPTER 4 ... 19
Data Analysis ... 19
4.1 Data and Assumption ... 19
4.2 Operational Scenario ... 21
4.3 Assumption and Parameter for Economic Analysis... 23
4.3.1 Capital Expenditure ... 23
4.3.2 Component of Investment Project Capital ... 24
4.3.3 Operational Expenditure ... 25
xviii
Appendix 5 ... 77
Appendix 6 ... 79
Appendix 7 ... 81
Appendix 8 ... 83
Appendix 9 ... 85
Appendix 10... 87
xix
xx
Table of Figure
Figure 2. 1 Condition of Sulawesi Sea ... 4
Figure 2. 2 Fishing Ground on Sulawesi Sea and Maluku. ... 5
Figure 2. 3 Fish Area Management Republic of Indonesia ... 6
Figure 2. 4 Cashflow diagram ... 8
Figure 3. 1Flow chart diagram of Methodology ... 13
Figure 3. 1 Flow chart diagram of Methodology (continued) ... 14
Figure 4. 1Differences KM Mina Jaya Niaga as longliner ship and fish carrier ship. ... 19
Figure 4. 2Operational Scenario of KM Mina Jaya Niaga as fish carrier ship. ... 22
Figure 4. 3 Graphic Production Skipjack Tuna ... 26
Figure 4. 4 Revenue Skipjack Tuna (Milyar Rp) ... 26
Figure 4. 5 Fix cost and Voyage cost ... 27
Figure 4. 6 Operational Expenditure ... 28
Figure 4. 7 Profit and (Loss) 15 years period ... 30
Figure 4. 9 Cashflow ratio 1st Scenario ... 37
Figure 4. 10 Cash flow ratio 2nd Scenario... 42
Figure 4. 11 Cash flow ratio 3rd Scenario... 49
xxi
xxii
List of Table
xxiii
1
CHAPTER 1
INTRODUCTION
1.1 Background
KM. Mina Jaya Niaga is an asset that belongs to PT. IKI as one of Indonesian State Owned Enterprises according to Letter of Directorate General of Treasury Ministry of Finance Republic of Indonesia number S-3715/MK.6/2006 at 20 June 2005. There are 14 ships unit that had been completed and 17 ships set unit. Around 14 ships unit that had been completed, 2 units operated by PT. Perinus, 8 units are heavy damage and 4 units operated with minor repair. Therefore, it has been a terrible condition for KM. Mina Jaya Niaga and need immediate decision to tackle the problems.
Circular letter from Ministry of Maritime and Fisheries Affairs number B.1234/DJPT/P.I410.D4/31/12/2015 about restriction of Ship’s Gross Tonnage size on SIUP/SIPI/SIKPI, which is Fish Carrier Ship restricted to 150 Gross Tonnage. Meanwhile, size of KM. Mina Jaya Niaga is 512 Gross Tonnage. That's one of factor that made KM. Mina Jaya Niaga couldn’t be operated (PT PANN, 2016).
Because of the restriction rules and to optimized the operational, KM. Mina Jaya Niaga would be operated as a conversion from fish carrier to mother ship. Where mother ship would be placed in small islands that have high potential to fish catching. Therefore, fisherman could go fishing without worries about the supply of logistics such as fuel and ice.
In addition, recommendation is needed to optimize used of KM. Mina Jaya Niaga for fisherman near small islands. A recommendation that been given is conversion of KM Mina Jaya Niaga from fishing vessel to carrier ship, reviewed on operational aspect.
1.2 Statement of Problems
From the explanation above, so the main problem will be discussed are as follows:
•How is the operational scenario for KM Mina Jaya Niaga as fish carrier ship?
•How is variable of financing for KM. Mina Jaya Niaga as fish carrier ship? •How is the economic feasibility for KM. Mina Jaya Niaga conversion from
1.3 Scope
The stated scopes of this study are: •Reviewing KM Mina Jaya longline ship. •Carrier ship will be placed on Sulawesi Sea.
•References of this thesis based on data from PT. IKI, government regulations, company’s data, quitionaries.
1.4 Objectives
The objectives of this study are to:
• Define operational and investment scenario for operating KM Mina Jaya Niaga as carrier ship.
• Indentify capital carrier expenditures and operation costs of Mina Jaya as carrier ship.
• Determine the economic feasibilityof KM Mina Jaya Niaga conversion from fishing vessel to carrier ship.
1.5 Benefits
The benefits of this study are:
• Could provide recommendations about ship conversion to related parties and government.
3 493/MK.016/1994 at 30 June, 1994. PT. PANN has received 31 shipset material of ship from Spainand assembled by PT Industri Kapal Indonesia (PT IKI). From 31 shipset that has been received,14 ships were resolved and 17 units are still in the form of shipset. 14 ships that already completed are not able to be absorbed by the market as the price and rents are high.
Based on document No. S-117/MBU/2005 at22 March 2005 that released by Ministry of State Owned Enterprises regarding ofKM Mina Jaya Niaga transfer assets, 17 shipsets and 14 ships that parked in the area of shipyard PT IKI. Approval stated by Ministry of Finance through letter GG Treasury No. S-3715/MK.6/2006 date June 20, 2005 including:
1. The transfer of the KM Mina Jaya Niaga assets of PT PANN to PT IKI as of April 1, 2005.
2. Loan closing SLA PT. PANN and loans issued between the government and the PT. IKI.
From 14 ships that have been completed, 2 units have been operated by PT Perikanan Nusantara (PT. Perinus) in agreement at April 24 and November 3, 2014. 12 units remaining of KM Minajaya Niaga that parked in shipyard area of PT IKI with conditions 8 units are severely damage and 4 units can be operated with minor repairs. If KM Mina Jaya Niaga is still abandoned in shipyard area in PT. IKI, it could worse the condition of KM Mina Jaya Niaga condition. Therefore, empowerment of KM Mina Jaya Niaga is considered as very important to provide benefits to the economy society and also able to clean the commercial area of PT. IKI.
the size of the KM Mina Jaya Niaga is the 512 GT. It makes KM Mina Jaya Niaga is unable to operate (PT PANN, 2016).
2.2 General Data
2.2.1General Conditions of Sulawesi Sea
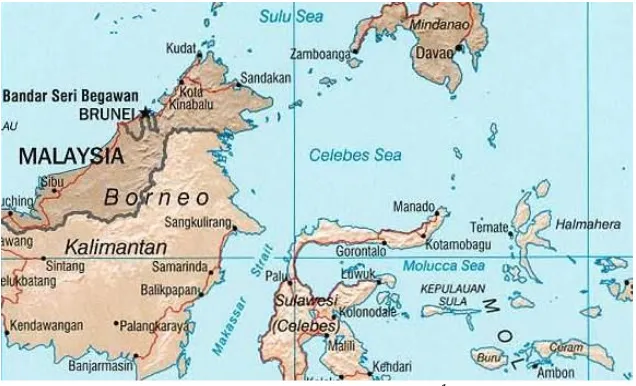
Celebes Sea is located on the west of Pacific Ocean. This ocean basin has a depth of 6200m. It extends 420 miles (675 km) north-south by 520 mi (840 km) east-west and has a total surface area of 110,000 square miles (280,000 km2) (Wikipedia,2017). Figure 2. 1will show where Celebes Sea lies bordered by Sulu Archipelago, Sulu Sea and Kalimantan.
Figure 2. 1 Condition of Sulawesi Sea1
The tropical setting and warm clear waters of Celebes Sea makes it a decent habitat for corals, whales, dolphins, and many kinds of pelagic species. This condition also increases the potential of pelagic-fish catch in Celebes Sea especially tuna.
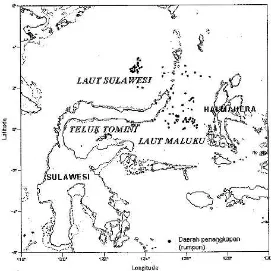
Fish catches in North Sulawesi are dominated by the fisherman whose their boat is using huhate as a fishing rod. As shown inFigure 2. 2, area of fisherman that using huhate is fishing ground at Sulawesi Sea and Maluku Sea (Nugraha, B. & E. Rahmat, 2008).
5
Figure 2. 2 Fishing Ground on Sulawesi Sea and Maluku.
2.2.2Fish Catches
One of the potential of marine resources have long been exploited population is fishery resources. Seafood Indonesia has the sustainable potential of 6.4 million tons per year. The potential for sustainable fishing is the potential that still allows the fish to regenerate so that the amount of fish caught will not reduce the fish population.
Based on international regulations, the allowable catch was 80% of the sustainable potential or approximately 5.12 million tons per year. In fact, the number of fish caught in Indonesia reached 5.4 million tons per year. This means there are still opportunities to increase the allowable catch, which amounted to 720,000 tons per year. If we compare the potential distribution of the fish, it appears the general differences between Western and Eastern part of Indonesia. In the western part of Indonesia with an average depth of 75 meters, the type of fish that many dtemukan is small pelagic fish. Rather different conditions contained in the eastern part of Indonesia that the depth of the sea reaches 4,000 m. In eastern Indonesia, is found in large pelagic fish such as tuna and skipjack tuna.
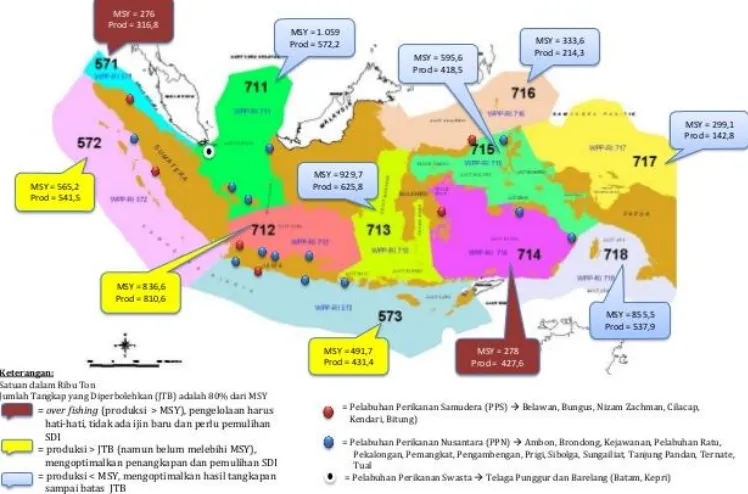
No.01/MEN/200 by Ministry of Maritime Affairs and Fisheries, Fish Management Area – Republic of Indonesia is divided into 11 WPPNRI. Figure 2. 3 shows 11 WPPNRI along Maximum Suistainable Yield (MSY) and The Allowable Catch of each area.
Figure 2. 3Fish Area Management Republic of Indonesia
7
Table 2. 1 Statistic of marine capture fisheries production by species in Sulawesi Sea and Nothern of Halmahera Island (WPP-RI 716), 2011-20152
Species Year
Jumlah 100408 124352 166068 209616 199172
From the table above, we can see that the production rate of Tuna increases on the average of 24,33% per year.The production rate of Tongkol increases on the average of 16,92% per year, mean while for the production rate of another big pelagic increase 20,17% per year and for Skipjack Tuna it increases about 14.96% per year.
From the data shown in Table 2.1 can be used as a reference to determine the Total Allowable Catches (TAC) in WPP-RI 716 for skipjack tuna, which is 124290,84 tons / year.
The peak of the skipjack tuna fishing season in eastern Indonesia generally occurs during the transition season 1 (April to June) up to the beginning of east season(Uktolseja et al, 1991).
2.3 Type of Fishing Vessel
In general fishing vessels defined on several types, such as fishing vessel, fish carrier vessel and patrol vessel. The definition between fishing vessel, carrier vessel and patrol vessel is :
• Fishing vessel: Fishing vessel is a ship constructed and used specifically only for catching fishes that appropriate with its catching gear and catching technique that will be used for save, hold and preserve. • Carrier vessel: Carrier vessel is a ship that carries catched fishes
equipped with special hatch that used for saving, holding and preserving catched fishes.
2 Directorate General of Capture Fisheries, Ministry of Marine Affairs and Fisheries. (2016) Marine
• Patrol vessel: Patrol vessel is a ship that spesifically constructed for activities concerning controlling and patrolling fishing vessels. In this thesis will be disscuss about conversion of KM Mina Jaya Niaga longline ship (fishing vessel) to fish carrier vessel. Where this fish carrier vessel will has home base port in Bitung and will be operated in WPP-RI 716.
2.4 Economic Analysis
It is important to know the parameters before doing an economic analysis to find out whether or not a project is feasible.The aim of this thesis is to examine whether the conversion of KM Mina Jaya Niaga longliner ship into fish carrier ship is feasible by holding on to certain parameters.
Few steps of economic analysis on this project are (Soeharto, 2001) :
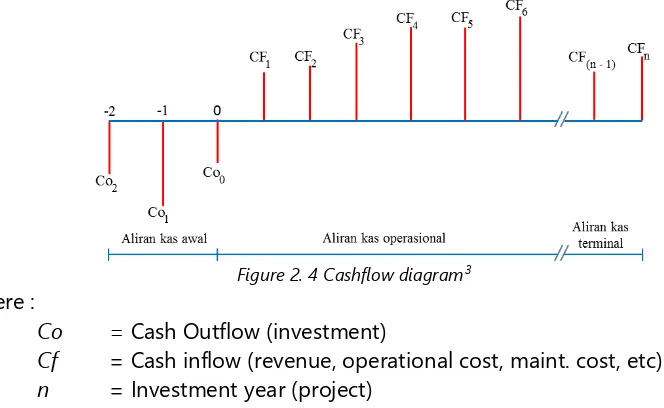
a. Cashflow
Cashflowis done throughout the operational years of KM Mina Jaya Niaga. Figure 2. 4 will describes a general graph of the cashflow process.
Figure 2. 4 Cashflow diagram3 where :
Co = Cash Outflow (investment)
Cf = Cash inflow (revenue, operational cost, maint. cost, etc) n = Investment year (project)
Cost analysis is conducted to recommend a cost estimate that will be used by a company on their scenarios. Cost analysis that will be conduct includinginitial cost, operational cost and terminal cost (Stopford, 2009) :
1) Initial Cost
Initial cost or initial investment on each scenario.Initial cost includes Capital Expenditure (CAPEX),is a budget allocation for purchase, repair,
3Soeharto, I. (2001). Manajemen Proyek (dar konseptual hingga operasional) Bagian II: Kelayakan
9
replacement, or conversionof some equipment which is classified as an asset for a business or company (Masyhuri Hamidi.2003.Jurnal Economic and Business Indonesia).
Budget allocation includes several considerations, one of them is where the capital investment that is used for equipment purchasing, repairment, replacement or conversion comes from. Is it from their own capital or having loan from the bank, this definitely affects the financial sustainability of this project.
2) Operational Cost
Operational Cost estimated operating costs or Operational Expenditure (OPEX), is budget expended to finance the operations of a business or company.Operational Expenditure (OPEX) which is covered by the company is related to which kind of chartering fee selected. The type of boat rental that used in this thesis is bare boat charter. For the funding of bare boat charter, the costs covered by company are as follows:
a.) Fix Cost
Operational costs are all daily cost during vessel’s operational time and non-operational time. Fixed cost consists of some cost components such as crew salary, crew assurance, and the ship’s lubrication. This cost includes maintenance cost but not dry-docking fee and fuel consumptions.
b.) Voyage Cost
Voyage Cost are the costs incurred to earn the freight or other voyage revenue. Voyage cost consists of some components such as fish sales, fuel costs, docking at the harbor cost, loading and unloading cost, and etc.
Other than operational and voyage cost, there are several other costs that affect operational cost or Operational Expenditure (OPEX). Those are the costs of docking, administration fee, and ship-chartering fee. Therefore the total of Operational Expenditures can be calculated with the formula :
OPEX = Operational Cost + Voyage Cost + docking fee, administration fee,
3) Terminal Cashflow
Terminal Cashflow consists of salvage value from repayment work capital. To simplify calculation, the salvage value is commonly considered as 0 (zero), but if there will be selling on assets at the end of age of depreciation, then sales tax shall be counted in.
b. Calculation of economic feasibility parameter
There are several parameters to calculate the economic feasibility of a project, such as:
1) Net Present Value (NPV)
Method that used for arranged stock to measure analysis feasibility of project investment. NPV is the difference between investment value and present value with considering time value of money. If NPV > 0, then proposed project could be accepted, meanwhile if NPV < 0 then it will be rejected. Equation 2.2 shown NPV calculation formula :
𝑁𝑃𝑉 = ∑ (1+𝑖)𝑅𝑡 𝑡
2) Internal Rate of Return (IRR)
An indicator for efficiency level of an investment. IRR is interest rate that will make NPV value considered as zero. Equation 2.3 shown IRR calculation formula:
IRR = 𝑖1 + (NPV1−NPV2NPV1 ) 𝑥(𝑖2 − 𝑖1) (2.3)
Where,
NPV1 : NPV value in low interest rate. NPV2 : NPV value in high interest rate. i1 : low interest rate.
11
3) Payback Period
Method for calculating how fast investment that has been implemented could return. Equation 2.1 shown payback period calculation formula:
Payback Period = Total Number of InvestmentsNumber of Proceeds x 1 Year (2.1)
c. Risk Assessment
Risk Assessment become important because there is an assumption on the calculation. An assumption always have a different risk from the reality. However, risk assessment on this project is not the main purpose of this paper, so it will not be explained in detail.
d. Economic Feasibility Study
13 identification of problems to eventually get a conclusion for the working of this thesis.
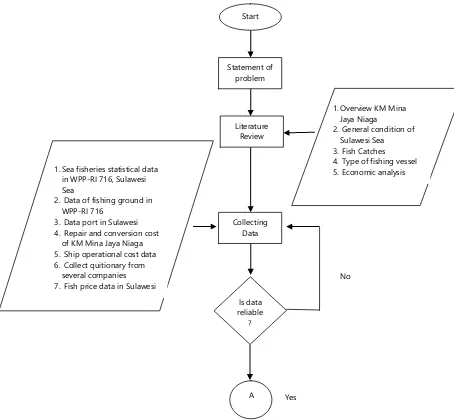
Figure 3. 1Flow chart diagram of Methodology
Start
2. General condition of Sulawesi Sea 3. Fish Catches 4. Type of fishing vessel 5. Economic analysis 1.Sea fisheries statistical data
in WPP-RI 716, Sulawesi Sea
2. Data of fishing ground in WPP-RI 716
3. Data port in Sulawesi 4. Repair and conversion cost
of KM Mina Jaya Niaga 5. Ship operational cost data 6. Collect quitionary from
several companies 7. Fish price data in Sulawesi
Is data reliable
?
No
Figure 3. 1 Flow chart diagram of Methodology (continued)
Based on the flow chart above, which provide steps for the completion of this thesis, then the explanation of each points will be explained as below:
3.2 Statement of Problems
Before conducting the research, at first the statement of problems of this study will be explained. Statement of problems are important, because this stage would determine whether the problems is considered as eligible or not.
In this thesis, it has been formulated several problems such as:
• How is the operational scenario for KM Mina Jaya Niaga as fish carrier ship?
• How is variable of financing for KM. Mina Jaya Niaga as fish carrier ship? • How is the economic feasibility for KM. Mina Jaya Niaga conversion from
fishing vessel to fish carrier ship?
Statement of Problems above is exactly the same with the one stated in Chapter 1 point 1.2 and will be used as the input for the next step.
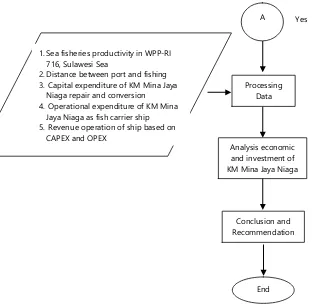
A Yes
Processing Data 1.Sea fisheries productivity in WPP-RI
716, Sulawesi Sea
2.Distance between port and fishing 3. Capital expenditure of KM Mina Jaya
Niaga repair and conversion 4. Operational expenditure of KM Mina
Jaya Niaga as fish carrier ship 5. Revenue operation of ship based on
15
3.3 Literature Review
Literature review is an early stage, about the basic theories to be discussed or used in the study.Literature review is also used to gather information from several sources to provide detailed information regarding the topic of this thesis. Referring to the statement of problems in this thesis, the important points which needs to be reviewed in the literature review are:
• Overview of KM Mina Jaya Niaga.
• General condition of Sulawesi Sea regarding fishing activity. • Fish catches
• Type of fishing vessel. • Economic analysis.
Source taken at this stage comes from books, papers, websites, journals, and so forth.Result from the literature review is the material, theory and opinion as the basic to resolve the statement of problems of this thesis.
3.4 Collecting Data
This phase is to obtain information that related to the study. The data that needed on this study are:
• Sea fisheries statistical data in WPP-RI 716 Sulawesi Sea is obtained from e-mail that been sent by Ministry of Marine Affairs and Fisheries Republic of Indonesia.
• Data of fishing ground in WPP-RI 716 is obtained from Ditjen Perikanan Tangkap (DJPT) Ministry of Marine Affairs and Fisheries Republic of Indonesia’s website.
• Data of port in Sulawesi to determine the homebase port which will be used in this thesis. Data of port that has been used in thesis is obtained from Ditjen Perikanan Tangkap (DJPT) Ministry of Marine Affairs and Fisheries Republic of Indonesia’s website.
• General arrangement of KM Mina Jaya Niaga.
• Repair and conversion cost of KM Mina Jaya Niagais obtained from bachelor thesis that written by Irfan Byna Nur Akbar.
• Ship operation cost is obtained from interview with several fishing companies.
• Fish price data in Sulawesi regionis obtained from interview with several fishing companies.
1. How your company interest if your company is asked to be the operator for KM Mina Jaya Niaga fish carrier ship? (Scale 1 to 10) 2. If your company is asked to give the price rate to rent ABF and cold
storage, how much you will rate?
3. If you been asked to buy fish from fisherman and you could sell again as profit, how much you willing to pay from fisherman?
4. How much do you suggest about price range for selling fish?
3.5 Data Processing
In this process, the data obtained will be processed by using the Microsoft Excel. From the data processed, some the result will be:
• Sea fisheries productivity in WPP-RI 716 Sulawesi
• Operational Scenario KM Mina Jaya Niaga in WPP-RI 716 Sulawesi. • Capital Expenditure of KM Mina Jaya conversion.
• Operational Expenditure of KM Mina Jaya as a fish carrier ship.
• Revenue operation of ship based on Capital Expenditure and Operational Expenditure.
The data processed in this step will be analysed further in the chapter 4 of this thesis.
3.6 Data Analysis
This study use several basic analysis method, which as follows: 1. Trend analysis
Trend analysis is a time – series analysis, technical analysis that tries to predict the future based on past data. On time – series analysis, the crucial point is the quality and level of accuracy from data that has been collected.
In this thesis, the trend analysis will be explained with the increasing cost which later will affect the profit obtained by the company regarding the conversion of KM Mina Jaya Niaga, which are:
- Increase crew salary 2,5% every year. - Increase fuel price 2% every year.
- Increase maintenance cost 5% every year. - Increase ABF contribution 5% every year.
- Increase cold storage contribution 5% every year. - Increase selling price of fish 2,5% every year. - Increase purchasing of fish 1,5% every year. - Increase of sailing fee 5% every years.
- Increase of loading-unloading cost 5% every 5 years. - Increase of retribution cost 5% every 5 years.
17
- Increase of trasnportation and communication cost 5% every 5 years. - Increase of ship equipment cost 2% every 5 years.
- Increase of fresh water cost 5% every 5 years. - Increase of port cost 5% every 5 years.
- Increase of administration cost 5% every 5 years. - Increase of docking cost 10% every 5 years
Estimated increasing price on above, will be clearly different if it implemented on long term investment 15 years.
2. Economic feasibility analysis
Feasibility analysis is an analysis to determine whether the project is feasible or not feasible to execute, based on several aspects such as market, technical and financial.
In this thesis, will also be discussed about the economic feasibility analysis to modify KM Mina Jaya Niaga as a fish carrier ship and the operating system which will be referred from some factors such as:
• The feasibility of fish potential in terms of fish production with the data obtained from KKP.
• The feasibility of KM Mina Jaya Niaga conversion as a fish carrier ship in terms of the operating system.
3. Scenario Analysis
In this thesis will be discussed some scenarios, such as : • Operational Scenario
The scenario analysis will explained about how effective operating system in terms of economic and performance to operate KM Mina Jaya Niaga as fish carrier ship in WPP-RI 716 Sulawesi with PP Bitung as the home base port.
• Investment Scenario
In this scenario will be discussed about investment scenario based on capital or initial investment for KM Mina Jaya Niaga conversion.
• Business Scenario
In this scenario will be discussed about parties that involved in the conversion and re-operation of KM Mina Jaya Niaga as fish carrier ship.
3.7 Conclusion and Recommendation
19
CHAPTER 4
Data Analysis
4.1Data and Assumption
On this thesis, will be explain about the operational of KM Mina Jaya Niaga longliner ship which converted into fish carrier ship.Figure 4. 1will explain the differences between KM Mina Jaya Niaga operates as a longliner ship and after KM Mina Jaya Niaga converted into a fish carrier ship.
Convert into
Figure 4. 1Differences KM Mina Jaya Niaga as longliner ship and fish carrier ship.
With converted KM Mina Jaya Niaga become fish carier ship, then the operational pattern will be different from before. If usually KM Mina Jaya Niaga as ship longliner fishing skipjack tuna, with KM Mina Jaya had converted into a fish carrier ship, now KM Mina Jaya Niaga only accomodate fish that have been caught by fisherman.
Table 4. 1and Table 4. 2will show different specifications of KM Mina Jaya longliner ship with KM Mina Jaya Niaga which has been converted into fish carrier ship.
Table 4. 1 General Data of Km Mina Jaya Niaga longliner ship
Item Specification
Ship Name Mina Jaya Niaga
Table 4. 2 General Data of KM Mina Jaya Niaga fish carrier ship
Item Specification
Ship Name Mina Jaya Niaga
Year Of Built 2017 various equipment.Some examples of conversions KM Mina Jaya Niaga as a fish carrier ship, such as :
• Release of Ropper Gear System and other fishing equipment. • Additional bunkering system for ship to ship fuel supply.
• Addition of loading and unloading system loading system at KM Mina Jaya Niaga to move fish load from fishing boat.
• Adding an economical cooling system to the vessel.
Table 4. 3 shows total cost for KM Mina Jaya Niaga’s repair and conversion process. Besides, the details of total cost for KM Mina Jaya Niaga will be shown at Appendix 1.
Table 4. 3 Repair and Conversion cost of KM Mina Jaya Niaga conversion Total Repair and Conversion of KM Mina Jaya Niaga
(Rp)
Repair and conversion Cost 2.425.000.000
Profit of shipyard and vendor (12%) 291.000.000
Tax (10%) 242.500.000
Total 2.958.500.000
The calculation of repair and conversion cost will be added with the price of the ship.This will be used as a reference to know the cash flow from KM Mina Jaya Niaga as a fish carrier ship to calculate and determineof variable financing.
21
production fish, esecially big pelagic fish like Tuna. Table 4. 4 shows statistics of marine capture fisheries production by species in WPP-RI 716, especially Tuna.
Table 4. 4Statistic of marine capture fisheries production by species in Sulawesi Sea and Nothern of Halmahera Island (WPP-RI 716), 2011-20151
Species Year
Jumlah 100408 124352 166068 209616 199172
From the table above, we can see that the production rate of Bigeye Tuna increases on the average of 55.17% per year, meanwhile the production rate of Yellowfin Tuna increases on the average of 27.77% and for Skipjack Tuna it increases about 14.96% per year.
KM Mina Jaya Niaga as a fish carrier ship at WPP-RI 716 has home base port at PP Bitung, Sulawesi. The details of KM Mina Jaya Niaga’s home base port will be shown on operational scenario.
4.2Operational Scenario
After converted from longliner ship to fish carrier ship, KM Mina Jaya Niaga will have home base port in PP Bitung and will be operated in WPP 716.Figure 4. 2shows the operational scenario from KM Mina Jaya Niaga. Which A-B-C-D symbols are ship operational point, while 1-2-3-4-5 symbols are distance, estimation route and time from each ship operational point. Figure 4. 2shows operational scenario scheme of KM Mina Jaya Niaga as fish carrier ship.
1Directorate General of Capture Fisheries, Ministry of Marine Affairs and Fisheries. (2016) Marine
1 2 3 4
5
Figure 4. 2Operational Scenario of KM Mina Jaya Niaga as fish carrier ship.
Based onFigure 4. 2,fish carrief ship starts from PP Bitung to first fishing ground (point A) then second fishing ground (point B) and so on. Operational pattern of KM Mina Jaya Niaga from 1- 5 is consecutive and will be ended at PP Bitung.
Operational scenario for this fish carrier ship consists of 3 stage, such as : a) PP Bitung - Preparation Stage
Before conducted the operational stage, should have done the preparation stage. The preparation stage including:
1. Bunkering process of fuel, fresh water and logistic in PP Cempae. Bunkering of fuel and fresh water based on capacity KM Mina Jaya Niaga which has fuel oil tank capacity 349,54 m3 and fresh water tank capacity 33,76 m3.
2. After finish the bunkering process, then sail to fishing ground point A. b) Point A, B, C, D - Operational Stage
On the operational stage, ship will be operate around fishing ground, which means :
1. Fish carrier ship will be operated at point A, B, C, and D. Every point has several fisherman ship with a measurement of 50 GT, the fisherman transfer their fish catches to KM Mina Jaya Niaga as a fish carrier ship. The capacity of 50 GT ship fit up to 31,25 ton with comparison between ice and fish is 50:50 so, the total of fish catches which transfered from fisherman ship is estimated in amount of 15 ton for every 50 GT ship. While waiting for fish transferring to KM Mina Jaya Niaga fish carrier ship, they also do fuel transferring, logistic transferring and crew transferring according to their needs. All of the process is estimated takes 2 hours for every single ship.
2. Fish that have been obtained from fisherman will be gathered in the processing room.
3. Fish that has been obtained from fisherman will be cut and cleaned. 4. After is cleaned then it washed with ice water. Assumed that 1 kg of fish
need 1 kg of ice.
23
5. After cleaning process is done, fish will be included to trey and getting frozen at freezer around 8 hours, then transfered to the fishing hold (cold storage).
c) PP Bitung - Selling Stage
After fish is collected and stored at the inside of cold storage, fish would be sold to partner or market. From this selling stage, it become benefit for the operator company.
Total of the distance that KM Mina Jaya Niaga as a fish carrier ship for 1 voyage from PP Bitung - A – B – C – D – PP Bitung is 157,25 km, with velocity servis 8 knot. It is estimated that 1 voyage takes 10,92 hours plus the estimated loading and unloading time in each fishing ground is 2 hours, so the total time of 1 voyage is about 18.92 hours or 0.8 days. If 1 trip time coupled with loading and unloading process in PP Bitung is estimated to be up to 1 day and estimated time to berth on port is 4 days, then total operational of KM Mina Jaya Niaga is 5,7 days or 6 days. The details of calcultaion of distance, time, unloading, and fuel process during KM Mina Jaya Niaga’s operational as fish carrier ship will be shown atAppendix 2.
The cost from operational of KM Mina Jaya Niaga affected by the distance and operational time as a fish carrier ship. The explanation about total cost which is needed by KM Mina Jaya Niaga will be shown at economic analysis.
4.3Assumption and Parameter for Economic Analysis
This thesis will determine the feasibility of KM Mina Jaya Niaga’s operational which converted from longliner ship into fish carrier ship. Determination of feasibility can be seen from the economic analysis. Thus, will affect how variable financing will be made to modify and operational financing for KM Mina Jaya Niaga as a fish carrier ship.
There are several cost factors that can affect the process to determine the feasibility and make the economic analysis, such as capital expenditure, component of investment project capital, and operational expenditure.
4.3.1 Capital Expenditure
Capital expenditure is the investment cost which used to start the project. Capital expenditures include repair and conversion costs for KM Mina Jaya Niaga plus ship price.
Table 4. 5Capital Expenditure of KM Mina Jaya Niaga Total Capital Expenditure of KM Mina Jaya Niaga
(Rp)
Total cost for repair and conversion 2.958.500.000
Price of the ship 4.000.000.000
Total 6.958.500.000
The price of the ship is estimated around Rp4.000.000.000,- so the total capital expenditure of KM Mina Jaya Niaga is Rp6.958.500.000,- or around Rp7.000.000.000,-.
4.3.2 Component of Investment Project Capital
The cost of repair and conversion of KM Mina Jaya Niaga requires capital of Rp 2.958.500.0000,- or around Rp3.000.000.000,-. Based on that condition, there will be some example of scenarios to cover the repair and conversion cost of KM Mina Jaya Niaga. Some examples of financing scenarios, such as :
• Full equity to cover the repair and conversion cost of Km Mina
Table 4. 6Component and structure of CAPEX KM Mina Jaya Niaga scenario Loan-Equity
Project Cost Component Precentage Total Cost
(Rp)
Credit from Bank 60% 1.800.000.000
Self-funded 40% 1.200.000.000
Total 100% 3.000.000.000
25
Table 4. 7 Credit Installment Recapitulation Full Loan scenario
Period
Fix
Installment Interest Total
Beginning
Balance Ending Balance
3.000.000.000 3.000.000.000
Year - 1 600.000.000 299.750.000 899.750.000
Year - 2 600.000.000 233.750.000 833.750.000
Year - 3 600.000.000 167.750.000 767.750.000
Year - 4 600.000.000 101.750.000 701.750.000
Year - 5 600.000.000 35.750.000 635.750.000
Table 4. 8will show the calculation for installments cost for the company every year from Loan – Equity scenario. For the detail installment will be shown at Appendix 3.
Table 4. 8 Credit Installment Recapitulation Loan – Equity Scenario
Period
Fix
Installment Interest Total
Beginning
Balance Ending Balance
1.800.000.000 1.800.000.000
Year 1 900.000.000 152.625.000 1.052.625.000
Year 2 900.000.000 53.625.00 953.625.000
4.3.3 Operational Expenditure
Operational Expenditure is an outflow cost for KM Mina Jaya Niaga’s operational activities. Operational Expenditure has a strong impact to company revenue. Because of that, the calculation of Operational Expenditure must clear and precise.
Operational Expenditure affected by several cost component, such as:
Figure 4. 3 Graphic Production Skipjack Tuna
Based on the figure above, can be obtained that the amounts of Skipjack Tuna catches in April until July (medium season), is estimated around 250 ton/month. In August to November (high season), the amount of Skipjack Tuna catches is estimated around 300 ton/month, while in January to March and December (low season) the number of catches is 0 due to the bad weather and these 4 months are used to do the ship docking.
Figure 4. 4 Revenue Skipjack Tuna (Milyar Rp)will show the estimation of income in billion rupiah units from the selling of the skipjack tuna production based on the fishing season, and the estimation of skipjack tuna selling is Rp30.000,- per kilogram.
27
Based on the figure above can be obtained that the total income of selling the fish catches from April until July (medium season) is Rp7.500.000.000,-. From August until November (high season) fish catches income is Rp9.000.000.000,-, while in January until March and December (low season) the number of income is 0 because there are no fishing activity.
b. Operational cost which consist of Fixed Cost and Voyage Cost. •Fix cost is the number of cost needs to be pay fully in a month,
Figure 4. 5 will show comparison of fix cost and voyage cost within 1 year period.
Figure 4. 5 Fix cost and Voyage cost
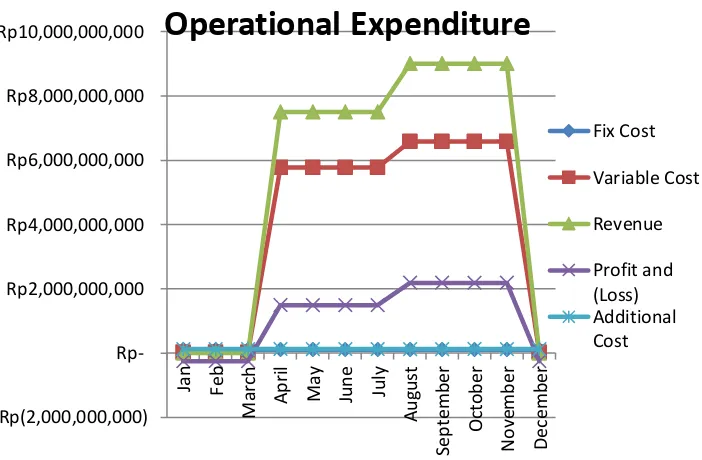
Figure 4. 6will show a comparison of operational expenditure costs within 1 year.
Figure 4. 6 Operational Expenditure
From the figure above can be seen that in low season (December, January, February, March) the company will incur losses. This is due to the low season no income at all, but still had to pay fixed costs.Table 4. 9shows the estimated amount of total operational expenditure in a year and for the detail will be shown at Appendix 5.
Table 4. 9 Operational Expenditure
A. Revenue Rp 66.000.000.000
B. Operational Cost
Fixed Cost Rp 1.263.000.000
Voyage Cost Rp 62.700.552.604
C. Additional Cost Rp 1.540.000.000
Total Cost Rp 65.503.552,604
Profit and (Loss) Rp 496.447.396
4.4Cashflow
After knowing the assumption of any factors affecting the analysis from an economic point of view for the project, the next thing to do is cashflow arrangement. The arrangement of cash flow consist cost of capital expenditure,
29
cost of operational expenditure, and additional cost per year. Cashflow arrangement will begin from year-0 for repairing and modifying the ship, and for 15 years of ship operation.
Figure 4. 7will define the total of profit and loss from year-0 to year-15 of operation of the ship.
From the figure below, we can see that the value total profit and loss in each year always changing. This is due to several assumption factors, such as :
- Increase crew salary 2,5% every year. - Increase fuel price 2% every year.
- Increase maintenance cost 5% every year. - Increase ABF contribution 5% every year.
- Increase cold storage contribution 5% every year. - Increase selling price of fish 2,5% every year. - Increase purchasing of fish 1,5% every year. - Increase of sailing fee 5% every years.
- Increase of loading-unloading cost 5% every 5 years. - Increase of retribution cost 5% every 5 years.
- Increase of ship equipment 2,5% every 5 years.
- Increase of trasnportation and communication cost 5% every 5 years. - Increase of ship equipment cost 2% every 5 years.
- Increase of fresh water cost 5% every 5 years. - Increase of port cost 5% every 5 years.
- Increase of administration cost 5% every 5 years. - Increase of docking cost 10% every 5 years.
Rp(10,000,000,000)
Profit and (Loss) 15 years period
For the detail calculation of profit and loss and it several assumption will be shown at Appendix 6.
Figure 4. 7 Profit and (Loss) 15 years period
From the graphic above can be seen that every 2 years company earnings decreased. This is caused by ship docking costs every 2 years. After knowing profit and loss in 15 year, the next thing is calculate cash flow to know whether the project is feasible or not. The cash flow calculation will be arranged from 0 year untill 15 year as shown at Table 4. 10.
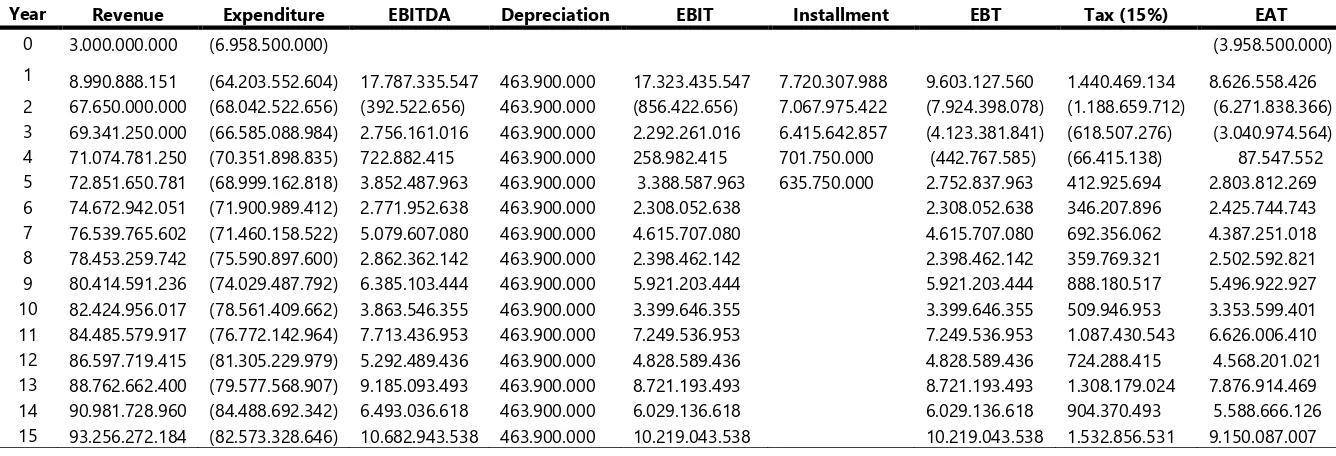
From Table 4. 10 it cansee that income in year 0 is obtained from loans provided by the bank. We also can see earning after tax (EAT) obtained from the total revenue minus total expenditure, ship depreciation, installment, taxed at 15%, plus ship depreciation. This is due to the ship depreciation not reduce revenue, but only reduce the value of the assets of the project which the value of the ship.
It can also be seen that the NPV value of Rp4.629.121.002, IRR of 29%, and Payback Period 4,27 year. These parameters indicate that the project is feasible to be implemented.
Profit and (Loss) 15 years period
31
Table 4. 10 Cash flow (Rupiah)
Year Revenue Expenditure EBITDA Depreciation EBIT Installment EBT Tax (15%) EAT
0 3.000.000.000 (6.958.500.000) (3.958.500.000)
1 8.990.888.151 (64.203.552.604) 17.787.335.547 463.900.000 17.323.435.547 7.720.307.988 9.603.127.560 1.440.469.134 8.626.558.426
2 67.650.000.000 (68.042.522.656) (392.522.656) 463.900.000 (856.422.656) 7.067.975.422 (7.924.398.078) (1.188.659.712) (6.271.838.366) 3 69.341.250.000 (66.585.088.984) 2.756.161.016 463.900.000 2.292.261.016 6.415.642.857 (4.123.381.841) (618.507.276) (3.040.974.564) 4 71.074.781.250 (70.351.898.835) 722.882.415 463.900.000 258.982.415 701.750.000 (442.767.585) (66.415.138) 87.547.552 5 72.851.650.781 (68.999.162.818) 3.852.487.963 463.900.000 3.388.587.963 635.750.000 2.752.837.963 412.925.694 2.803.812.269 6 74.672.942.051 (71.900.989.412) 2.771.952.638 463.900.000 2.308.052.638 2.308.052.638 346.207.896 2.425.744.743 7 76.539.765.602 (71.460.158.522) 5.079.607.080 463.900.000 4.615.707.080 4.615.707.080 692.356.062 4.387.251.018 8 78.453.259.742 (75.590.897.600) 2.862.362.142 463.900.000 2.398.462.142 2.398.462.142 359.769.321 2.502.592.821 9 80.414.591.236 (74.029.487.792) 6.385.103.444 463.900.000 5.921.203.444 5.921.203.444 888.180.517 5.496.922.927 10 82.424.956.017 (78.561.409.662) 3.863.546.355 463.900.000 3.399.646.355 3.399.646.355 509.946.953 3.353.599.401 11 84.485.579.917 (76.772.142.964) 7.713.436.953 463.900.000 7.249.536.953 7.249.536.953 1.087.430.543 6.626.006.410 12 86.597.719.415 (81.305.229.979) 5.292.489.436 463.900.000 4.828.589.436 4.828.589.436 724.288.415 4.568.201.021 13 88.762.662.400 (79.577.568.907) 9.185.093.493 463.900.000 8.721.193.493 8.721.193.493 1.308.179.024 7.876.914.469 14 90.981.728.960 (84.488.692.342) 6.493.036.618 463.900.000 6.029.136.618 6.029.136.618 904.370.493 5.588.666.126 15 93.256.272.184 (82.573.328.646) 10.682.943.538 463.900.000 10.219.043.538 10.219.043.538 1.532.856.531 9.150.087.007
4.5Investment Scenario
In this chapter will be discussed about investment scenario based on capital or initial investment for KM Mina Jaya Niaga conversion. The scenarios in this chapter are influenced by several factors, including:
• Investment project capital (Loan-Equity, Full Loan, Full Equity)
• Based on the discount rate (i) used to obtain value of NPV, IRR and Payback Period.
This investment scenario will be calculated for 15 years ship operation.
4.5.1 1stInvestment Scenario
In this first scenario of investment will be discussed the investment scenario for the operation of KM Mina Jaya Niaga as a fish carrier ship for 15 years. Investment scenario is done with the aim to get the value of NPV, IRR and Payback Period in investing this project. The determination of the value of NPV, IRR and Payback Period based on project capital investment with dicount rate (i) 10%.
Table 4. 11 will show comparison of NPV, IRR and Payback Period with investment project capital Loan – Equity, Full Loan, and Full Equity with discount rate (i) 10%.
Table 4. 11 Investment Project Capital with (i) 10%
Item NPV IRR Payback Period
Loan - Equity 4.164.567.270 23% 4,32 year
Full Loan 4.639.121.002 29% 4,27 year
Full Equity 3.601.243.315 18% 4,15 year
From the table above we could see if we use investment project capital Loan-Equity will get NPV Rp4.164.567.270 with IRR 23% and Payback Period 4,32 year. If investment project capital full loan from bank will get NPV Rp4.639.121.002 with IRR 29% and Payback Period 4,27 year. While, when we choose to use investment project capital full equity we will get NPV Rp3.601.243.315 with IRR 18% and Payback Period 4,15 year.
4.5.2 2nd Investment Scenario
33
value of NPV, IRR and Payback Period based on project capital investment with dicount rate (i) 12%.
Table 4. 12 will show comparison of NPV, IRR and Payback Period with investment project capital Loan – Equity, Full Loan, and Full Equity with discount rate (i) 12%.
Table 4. 12 Investment Project Capital with (i) 12%
Item NPV IRR Payback Period
Loan - Equity 2.885.839.062 17% 4,08 year
Full Loan 3.407.940.223 20% 4,01 year
Full Equity 2.395.188.661 15% 4,15 year
From the table above we could see if we use investment project capital Loan-Equity will get NPV Rp2.885.839.062 with IRR 17% and Payback Period 4,08 year. If investment project capital full loan from bank will get NPV Rp3.407.940.223 with IRR 20% and Payback Period 4,01 year. While, when we choose to use investment project capital full equity we will get NPV Rp2.395.188.661 with IRR 15% and Payback Period 4,15 year.
4.5.3 3rd Investment Scenario
In this third scenario of investment will be discussed the investment scenario for the operation of KM Mina Jaya Niaga as a fish carrier ship for 15 years. Investment scenario is done with the aim to get the value of NPV, IRR and Payback Period in investing this project. The determination of the value of NPV, IRR and Payback Period based on project capital investment with dicount rate (i) 15%.
Table 4. 13 will show comparison of NPV, IRR and Payback Period with investment project capital Loan – Equity, Full Loan, and Full Equity with discount rate (i) 15%.
Table 4. 13 Investment Project Capital with (i) 15%
Item NPV IRR Payback Period
Loan - Equity 1.488.614.468 14% 4,08 year
Full Loan 2.704.304.006 17% 4,01 year
Full Equity 955.741.267 12% 4,15 year
Period 4,08 year. If investment project capital full loan from bank will get NPV Rp2.704.304.006 with IRR 17% and Payback Period 4,01 year. While, when we choose to use investment project capital full equity we will get NPV Rp955.741.267 with IRR 15% and Payback Period 4,15 year.
4.5.4 4th Investment Scenario
In this fourthscenario of investment will be discussed the investment scenario for the operation of KM Mina Jaya Niaga as a fish carrier ship for 15 years. Investment scenario is done with the aim to get the value of NPV, IRR and Payback Period in investing this project. The determination of the value of NPV, IRR and Payback Period based on project capital investment with dicount rate (i) 18%.
Table 4. 14 will show comparison of NPV, IRR and Payback Period with investment project capital Loan – Equity, Full Loan, and Full Equity with discount rate (i) 18%.
Table 4. 14 Investment Project Capital with (i) 18%
Item NPV IRR Payback Period
Loan - Equity 420.317.606 11% 4,08 year
Full Loan 1.061.566.812 14% 4,01 year
Full Equity (152.020.232) 10% 4,15 year
35
Table 4. 15will show the comparison between investment project capital Loan-Equity, Full Loan and Full Equity with different discount rate (i).
Table 4. 15Comparison Investment Project Capital
Type of Capital Investment Discount Rate (i) NPV IRR Payback Period
Loan-Equity discount rate (i) will affect the value of NPV, IRR and Payback Period.A project can be assessed economically feasible if the NPV is more than 0, the IRR is greater than bank interest and a short payback period. This makes investors interested to invest on the project.
4.6Business Scenario
To make improvements, conversion and KM Mina Jaya Niaga operation as a fish carrier ship need a lot of money. For ease the costs of KM Mina Jaya Niaga, in this thesis will be explain some business scenario involving some parties, one of which is PT IKI as the owner of a KM Mina Jaya Niaga. PT B and PT C as fishing companies and operator, fish trader as a buyer of fish and fisherman.
Each parties certainly have a project capital to serve as initial capital to start this project. On this business scenario each parties will use Loan – Equity.
4.6.1 1st Scenario
Table 4. 16 1st Scenario
- Fixed Cost (except maintenance
and administration) x v x x x
- Voyage Cost x v x x x
- Additional Cost x v x x x
From the table above, it can be seen that the expenses PT IKI has to covered as the owner of the ship are capital expenditure in the 0 year and maintenance expense for Rp3.000.000.000,- in the first year. PT IKI must also pay bank instalments for 1.052.625.000 in the 1st year and
Rp953.625.000 in the 2nd year.For the detail calculation of PT IKI cashflow
will be shown atTable 4. 17.
Besides of pay the repair and conversionship investment, PT IKI get revenue in the form of charterred cost of ship, ABF lease and cold storage paid by PT B. We also can see that the value total profit and loss in each year always changing. This is due to several assumption factors, such as :
- Increase crew salary 2,5% every year. - Increase fuel price 2% every year.
- Increase maintenance cost 5% every year. - Increase ABF contribution 5% every year.
- Increase cold storage contribution 5% every year. - Increase selling price of fish 2,5% every year. - Increase purchasing of fish 1,5% every year. - Increase of sailing fee 5% every years.
- Increase of loading-unloading cost 5% every 5 years. - Increase of retribution cost 5% every 5 years.
- Increase of ship equipment 2,5% every 5 years.
- Increase of trasnportation and communication cost 5% every 5 years. - Increase of ship equipment cost 2% every 5 years.
37
- Increase of administration cost 5% every 5 years. - Increase of docking cost 10% every 5 years
Figure 4. 8will show cash flow ratio of PT IKI and PT B.
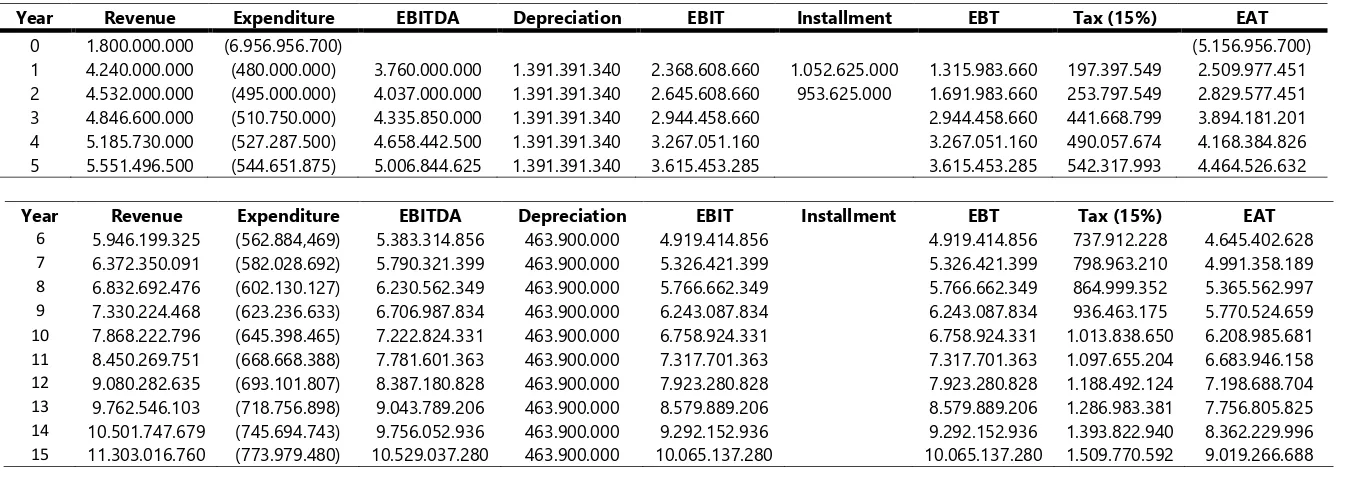
Figure 4. 8 Cashflow ratio 1st Scenario
Table 4. 17Cash flow PT. IKI Scenario 1 (Rupiah)
Year Revenue Expenditure EBITDA Depreciation EBIT Installment EBT Tax (15%) EAT
0 1.800.000.000 (6.956.956.700) (5.156.956.700)
1 4.240.000.000 (480.000.000) 3.760.000.000 1.391.391.340 2.368.608.660 1.052.625.000 1.315.983.660 197.397.549 2.509.977.451 2 4.532.000.000 (495.000.000) 4.037.000.000 1.391.391.340 2.645.608.660 953.625.000 1.691.983.660 253.797.549 2.829.577.451
3 4.846.600.000 (510.750.000) 4.335.850.000 1.391.391.340 2.944.458.660 2.944.458.660 441.668.799 3.894.181.201
4 5.185.730.000 (527.287.500) 4.658.442.500 1.391.391.340 3.267.051.160 3.267.051.160 490.057.674 4.168.384.826
5 5.551.496.500 (544.651.875) 5.006.844.625 1.391.391.340 3.615.453.285 3.615.453.285 542.317.993 4.464.526.632
Year Revenue Expenditure EBITDA Depreciation EBIT Installment EBT Tax (15%) EAT
6 5.946.199.325 (562.884,469) 5.383.314.856 463.900.000 4.919.414.856 4.919.414.856 737.912.228 4.645.402.628
7 6.372.350.091 (582.028.692) 5.790.321.399 463.900.000 5.326.421.399 5.326.421.399 798.963.210 4.991.358.189
8 6.832.692.476 (602.130.127) 6.230.562.349 463.900.000 5.766.662.349 5.766.662.349 864.999.352 5.365.562.997
9 7.330.224.468 (623.236.633) 6.706.987.834 463.900.000 6.243.087.834 6.243.087.834 936.463.175 5.770.524.659
10 7.868.222.796 (645.398.465) 7.222.824.331 463.900.000 6.758.924.331 6.758.924.331 1.013.838.650 6.208.985.681
11 8.450.269.751 (668.668.388) 7.781.601.363 463.900.000 7.317.701.363 7.317.701.363 1.097.655.204 6.683.946.158
12 9.080.282.635 (693.101.807) 8.387.180.828 463.900.000 7.923.280.828 7.923.280.828 1.188.492.124 7.198.688.704
13 9.762.546.103 (718.756.898) 9.043.789.206 463.900.000 8.579.889.206 8.579.889.206 1.286.983.381 7.756.805.825
14 10.501.747.679 (745.694.743) 9.756.052.936 463.900.000 9.292.152.936 9.292.152.936 1.393.822.940 8.362.229.996
15 11.303.016.760 (773.979.480) 10.529.037.280 463.900.000 10.065.137.280 10.065.137.280 1.509.770.592 9.019.266.688
39
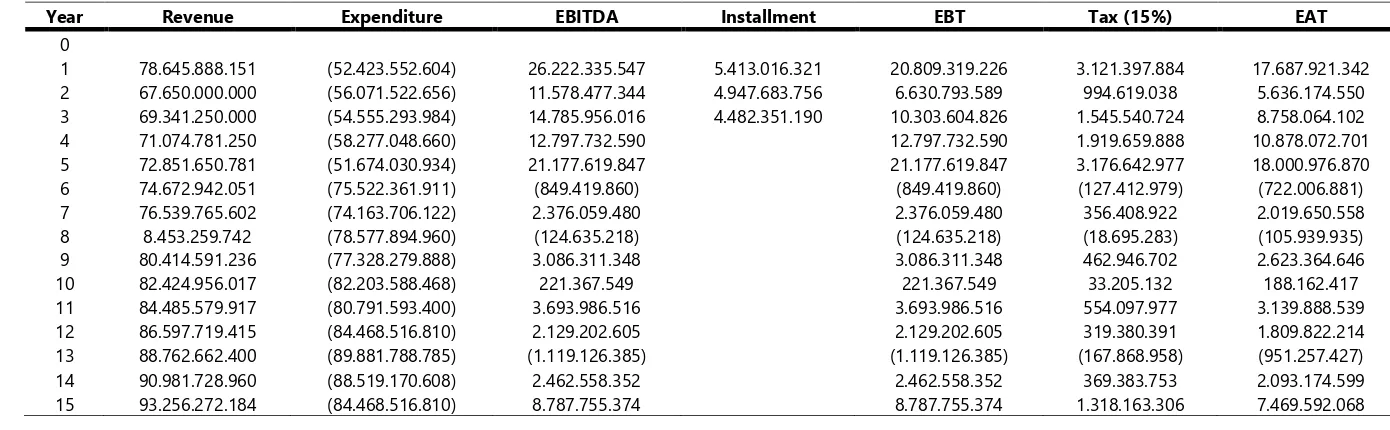
Table 4. 18 Cash flow PT B Scenario 1 (Rupiah)
Year Revenue Expenditure EBITDA Installment EBT Tax (15%) EAT
0
1 78.645.888.151 (52.423.552.604) 26.222.335.547 5.413.016.321 20.809.319.226 3.121.397.884 17.687.921.342
2 67.650.000.000 (56.071.522.656) 11.578.477.344 4.947.683.756 6.630.793.589 994.619.038 5.636.174.550
3 69.341.250.000 (54.555.293.984) 14.785.956.016 4.482.351.190 10.303.604.826 1.545.540.724 8.758.064.102
4 71.074.781.250 (58.277.048.660) 12.797.732.590 12.797.732.590 1.919.659.888 10.878.072.701
5 72.851.650.781 (51.674.030.934) 21.177.619.847 21.177.619.847 3.176.642.977 18.000.976.870
6 74.672.942.051 (75.522.361.911) (849.419.860) (849.419.860) (127.412.979) (722.006.881)
7 76.539.765.602 (74.163.706.122) 2.376.059.480 2.376.059.480 356.408.922 2.019.650.558
8 8.453.259.742 (78.577.894.960) (124.635.218) (124.635.218) (18.695.283) (105.939.935)
9 80.414.591.236 (77.328.279.888) 3.086.311.348 3.086.311.348 462.946.702 2.623.364.646
10 82.424.956.017 (82.203.588.468) 221.367.549 221.367.549 33.205.132 188.162.417
11 84.485.579.917 (80.791.593.400) 3.693.986.516 3.693.986.516 554.097.977 3.139.888.539
12 86.597.719.415 (84.468.516.810) 2.129.202.605 2.129.202.605 319.380.391 1.809.822.214
13 88.762.662.400 (89.881.788.785) (1.119.126.385) (1.119.126.385) (167.868.958) (951.257.427)
14 90.981.728.960 (88.519.170.608) 2.462.558.352 2.462.558.352 369.383.753 2.093.174.599
15 93.256.272.184 (84.468.516.810) 8.787.755.374 8.787.755.374 1.318.163.306 7.469.592.068
Meanwhile, from table 4.11 we can see the table of cash flow PT. B.It shows that as the chartererand operator of KM Mina Jaya Niaga, PT. B must pay the ship charter cost for Rp1.600.000.000.,- in the 1st year, operational cost and additional cost.PT B also should pay installment for 3 year. This installment is used to pay off working capital that loans by the bank for Rp12.645.888.151,-. To know the detail calculation profit and loss from 1st
scenario could be seen at Appendix 7.
Based on the cashflow calculationof PT. IKIwith a discount rate of 10%, then the value of NPV obtained is Rp2.503.178.915,- with IRR 46% and Payback Period2,43 year. While, with the same discount rate (i) PT B get the NPV value of (Rp5.253.526.594,-) with IRR 0% and Payback Period 7,07 year. As already discussed in the investment scenario that the discount rate will affect the value of NPV, IRR and Payback Period. So in this business scenario also will be discussed on the variation of the discount rate.Table 4. 19will explain the comparison of the difference in discount rate (i) on 1st
business scenario.
Table 4. 19Comparison of Discount Rate (i) 1st Secnario
(i) PT IKI PT B feasible for PT IKI as the owner of the ship but, it is not feasible for PT B as a charterer and the operator of the ship. Because IRR value of PT B is 0%, which means lower than bank interest.
4.6.2 2nd Scenario
41
Table 4. 20 2nd Scenario
Item PT. IKI PT. B PT. C Fisherman Fish Trader
- Voyage Cost (except fish purchasing and maintenance costand administration cost of ship as the owner. PT IKI also should pay bank instalments for Rp1.052.625.000 in the 1st year and
Rp953.625.000 in the 2nd year. For the detail calculation cash flow of PT. IKI
will be shown onTable 4. 22.
In this second scenario PT B remains as a charterer and as a ship operator, but does not incur any costs for the sell and purchase of fish. So the costs which covered by PT B slightly reduced. For the cost of purchasing and selling fish will be covered by PT C as the third party. Later proceeds from the selling of fish by PT C will do a profit sharing with PT B, with a ratio of 60% for PT B and 40% for PT C. Sharing of profit given to PT B is larger than PT C, because it is proportional to the cost incurred by PT B. Figure 4. 9 Cash flow ratio 2nd Scenariowill be shown cash flow ratio from PT IKI, PT B and PT C.
Similar to scenario 1, the income and expenditures earned by each company in this scenario also increase in each year. This is due to several assumptions, such as:
- Increase crew salary 2,5% every year. - Increase fuel price 2% every year.