* To whom correspondence should be addressed.
MOLECULAR DETECTION OF PUTATIVE MUTANT CLONES OF
RODENT TUBER (
Typhonium flagelliforme
Lodd.) CV.
PEKALONGAN USING RAPD MARKERS
NESTI FRONIKA SIANIPAR1,2* and RAGAPADMI PURNAMANINGSIH3
1Food Technology Department, Faculty of Engineering, Bina Nusantara University,
Jakarta, Indonesia 11480
2Research Interest Group Biotechnology, Bina Nusantara University, Jakarta, Indonesia 11480 3Indonesian Center for Agricultural Biotechnology and Genetic Resources Research
and Development (BB-Biogen), 16111 Bogor, Indonesia
*E-mail: [email protected]
Accepted 15 March 2018, Published online 25 May 2018
ABSTRACT
The aim of this study was to derive superior mutant clones of rodent tuber, which has been mutated by gamma ray irradiation. Thirty clones were successfully produced from in vitro putative shoots by using 20 Gy of gamma irradiation. Morphological selection was obtained from 30 clones and 14 genotypes were detected using randomly amplified polymorphic DNA (RAPD). The detection of genetic changes was using 14 primers. There were 7 primers (OPB-18, OPC-05, OPD-20, OPA-02 and OPA-09) had produced the highest number of polymorphic bands. Significant variations were observed in the genetic changes between the control and M14 clone in the size range 100-1650 bp. The phylogenetic analysis showed that the 14 mutant genotypes splits into 2 clusters at a coefficient of 0.67. 3 mutant genotypes with genetic distances closest to the control were genotype M12, M15, and M16 with genetic similarity coefficient values of 0.77 (23% of genetic differences), while genotypes with the farthest genetic distances from the control were genotype of the M14 with genetic similarity coefficient values of 0.63 (37% of genetic differences).
Key words: Typhonium flagelliforme Lodd putative mutant, molecular detection, RAPD.
INTRODUCTION
Rodent tuber plant (Typhonium flagelliforme Lodd.) is one of the medicinal plant that is efficacious as anticancer (Essai, 1986). Anticancer compounds contain almost all parts of this plant, including roots, stems, leaves and flowers. The various research results indicated that rodent tuber is advantageous for treating cancer such as breast cancer, intestine, prostate gland, liver, leukemia and cervix (Hoesen, 2007; Heyne, 1987). Choon et al. (2008) showed that rodent tuber had activity as anticancer and induced apoptosis.
The extracts of rodent tuber have been known to induce apoptosis in some cancer cells in vitro. The ethanol fraction of it has been shown to effectively inhibit the growth of breast cancer cells T47D (Nurrochmad et al., 2011), breast cancer
cells MCF-7 (Putra et al., 2012), inhibit the polyphylation of human T4-lymphoblastoid cancer cells (Mohan et al., 2008; Mohan et al., 2010).
There are many chemical compounds found in the roder tuber plant, thus, very potential to be developed as one of the sources of herbal medicine to treat people whom has cancer diseases. Development of rodent tuber plant for anticancer drugs of bioactive compounds from accessions were low. Due to the multiplication of rodent tuber through vegetatively with the separation of the saplings (Essai, 1986).
changes in vitro (Sianipar et al., 2013). Several times, they were planted in the green house to acquire the seventh generation and they were detected genetic changing by RAPD. The 30 clones were selected from 14 mutant genotypes and analyzed their genetic variations which had a higher bioactive compound than their counterparts based on the results of gas chromatography mass spectrometry (GC-MS) analysis. In order to obtain mutant clones that are superior and different from the mother plant, the genetic relationship from the mutant clones was analyzed using molecular markers as well as RAPD.
The genetic variations can occur due to genetic changes at the level of DNA, genes or chromosomes during the culture (Pelloquin, 1981). Genetic variation that occurs within tissue culture is caused by the doubling of the chromosome number (fusion, endomitosis), changes in chromosomal structure, gene changes and cytoplasmic changes (Griffith et al., 1993; Kumar, 1995). Gamma irradiation can be used for mutation induction (Ahloowalia et al., 2004). Gamma rays can also affect the physiological and biochemical changes in mutants because gamma rays contain a certain amount of kinetic energy that shown chromosome structure changes in the plants (Datta et al., 2011). According to Lamseejan et al. (2000), LD50 was obtained on
the chrysalis purple clone at 14 Gy.
Molecular detection using RAPD is one of the methods that can be used to determine genetic mutant variation. RAPD is a method of genomic DNA analysis through the pattern of DNA bands produced after the genome is amplified using a single primer. This method is based on polymerase chain reaction or known as PCR (Polymerase Chain Reaction) by using high temperature resistant DNA polymerase (McClelland, 1994). The RAPD-PCR method is a combination of PCR techniques using primers with random sequences for amplification of random loci from the genome (Rafalski et al., 1991). This method has advantages in the simplicity of the technique and its rapid processing (Hu & Quiros, 1991), therefore, RAPD is feasible to be used in an analysis that uses a considerable sample size and is utilized in plant breeding (Rafalski et al., 1991). The genetic relationships analysis can be determined by genetic similarity among the individuals.
The purpose of this study was to detect genetic changes from rodent tuber plants that have been irradiated by gamma rays and to discover the genetic variations and the relationships between the mutant genotypes of rodent tuber using RAPD markers.
MATERIALS AND METHODS
Place and time of the study
The study was conducted in the greenhouse and the laboratory of molecular biology, Center for Research and Development of Biotechnology and Genetic Resources of Agriculture, Bogor. The study was held from January to December 2016.
Tools and materials
Rodent tuber plants were used the control and the 14 mutant genotypes with the seventh generation (MV7) accession Pekalongan produced by gamma ray irradiation. The samples was taken from the leaves part of the rodent tuber plant. MV7 was generated through the treatment of mutation induction using gamma ray irradiation and somaclonal variability. The 14 selected genotypes detected were obtained from 20 Gy of gamma irradiation (Sianipar et al., 2013).
Detection of Genetic Changes of RAPD Molecular Markers
Isolation of DNA
DNA sample was isolated from the leaves of putative mutants and the control using Doyle and Doyle (1987) methods by modifying some com-ponents in the initial process of DNA extraction. A total of 2.5 g of each sample inserted into a cooled mortar and added 0.1% PVP and crushed by adding liquid nitrogen to fine powder. The powder poured into an Eppendorf tube containing 2 mL of extraction buffer [CTAB 10% b/v]; EDTA 0.5M pH 8.0; Tris HCl 1M pH 8.0; NaCl 5M] 10 μL mercaptoethanol 1% (b/v).
incubated in the refrigerator (4°C) overnight. DNA solution was stored at -20°C.
Test the quality and quantity of DNA
The 1% agarose gel was prepared by dissolving 0.4 g of agarose in 40 mL of TAE 1x buffer (Tris base, glacial acetic acid, 0.5 M EDTA, pH 8.0). The gel was put into a tub of electrophoresis that has been filled TAE 1x solution until submerged. The DNA samples were inserted into the gel well and electrically sprung for approximately 1 hr at a voltage of 60 V. Furthermore, the gel documentation was performed by Kodak Gel Logic program. The thickness of the DNA band shows the quantity of DNA samples compared to the thickness of the known lambda DNA bands. The quality of DNA was determined based on the integrity of the DNA band thick white colored without a smear band.
RAPD Analysis Method
PCR analysis was used 14 primers with 10-mer sizes. The composition of the PCR reaction is presented in Table 1. The amplification reaction was carried out using a Thermal Cycler Gene PCR (ABI 9700) device with a thermal cycle of 45 times with the following steps: for 1 min at 94°C, 1 min at 36°C, 2 min at 72°C and 4 min at 72°C, after reaching 45 cycles there is an extention time stages for 4 min at fixed temperature of 72°C. The PCR product can be fractionated using 1.4% agarose gel (b/v) in TAE 1X 40 mL solution. Electrophoresis was run at 75 volts for 1.5 hr. The results of electrophoresis were documented using Kodak Logic dott program.
Data analysis was performed by using a scoring method of DNA band which appeared on agarose electrophoresis gel results of 1.5%. The visible bands on the visualization result are considered as one allele. DNA bands that have the same migration rates are regarded as the same locus. At the same migration rate, for each visible band is given a score of 1, the invisible band has scored 0, while the sample that did not produce the amplicon has scored 0 and is considered missing data, the results of the tape scores is binary data. To facilitate the
positioning of ribbons, scoring activities are assisted with Gel Analyzer software. The scoring results were analyzed using Sequential Agglomerative Hierarchial and Nested (SAHN)-UPGMA (Unweighted Pair-Group Method with Arithmetic NTSYSpc version 2.01 program (Rohlf, 2000). The results are presented in the form of dendrogram and matrix of genetic similarity.
RESULTS AND DISCUSSION
Genetic changes detection using RAPD
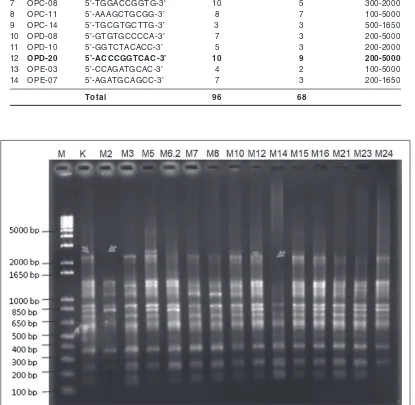
Results of genetic variation analysis using RAPD from 14 primers has 96 bands and 68 polymorphic bands are presented in Table 2. The least number of bands was obtained using OPA 02 and OPE 3 primer, which has 4 bands with 2 polymorphic bands. The most widely produced bands of OPD-20 primer was 10 bands with 9 polymorphic bands as it was shown in Table 2, Figure 1 and Figure 2.
14 primers were produced a genetic change in the size of the band patterns between 100 bp to 5000 bp. The profile band was occurring in OPB-18 primers which indicated 11 bands and 6 polymorphic bands. The OPB-18 primer is shown that the polymorphic band pattern is present in the size of 100-5000 bp. The differences of polymorphic band are clearly shown between the control (K) and M2 mutant plants in the size range 650-5000 bp and M14 around 100-1650 bp (Figure 2). Genetic changes are occurring due to a combination of gamma irradiation and somaclonal variation in plantlets.
Gamma rays irradiation can cause chromosomal changes in plants (Datta et al., 2011) and may also increase the bioactive compounds in rodent tuber mutants by GC-MS analysis (Sianipar et al., 2016a; Sianipar et al., 2016b). According to Busey (1980) the stolon of Stenotaphrum secundatum ((Walt.) Kuntze) which is irradiated by gamma rays with a dose of 4.5 krad (45 Gy) was produced mutant plants about 7%. Additionally, the induction experiments with gamma-ray mutations in Thai tulip (Curcuma
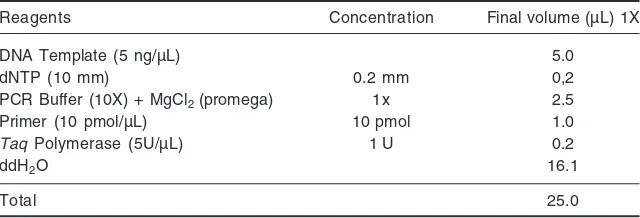
Table 1. Composition of PCR reagents with RAPD primers
Reagents Concentration Final volume (µL) 1X
DNA Template (5 ng/µL) 5.0
dNTP (10 mm) 0.2 mm 0,2
PCR Buffer (10X) + MgCl2 (promega) 1x 2.5
Primer (10 pmol/µL) 10 pmol 1.0
Taq Polymerase (5U/µL) 1 U 0.2
ddH2O 16.1
Fig. 1. RAPD profile band with OPB-18 primer. (M) Marker; (K) Control; (M2) 20-1-2-1-2-2; (M3) 20-1-1-3-2-4; (M5) 20-1-2-2-3; (M6.2) 20-1-2-1-2-6; (M7) 20-1-2-2-4-3; (M8) 20-1-1-2-2-3; (M10) 20-1-3-4-4-8; (M12) 20-1-2-2-1-3; (M14) 20-1-2-2-4-3; (M15) 20-1-1-3; (M16) 20-1-2-4-5; (M21) 20-1-2-4-4; (M23) 20-4-2-1-1-1; (M24) 20-1-3-4-4-9.
alismatifolia) the dose of LD50 was detected about
25 Gy. There are changes in the growth of flowers, chlorophyll mutations and plant morphology alteration of producing some mutants (Abdullah et al., 2009). Banerji and Datta (1992) found the optimum dosage of gamma rays to produce the most preferred chrysanthemum mutant plant (30% of the plant population) was 25 Gy.
Somaclonal variation is defined as genetic and phenotypic variation between clonal plant propagation derived from a single clone source (Kaeppler et al., 1998; Olhoft & Phillips, 1999). According to Karp (1995), the factors are affecting the somaclonal variation between the growth rate of meristematic tissues which is used as a source of explant are the genetic constitution of cultured or Table 2. Number of DNA bands produced using RAPD marker with 14 primers
Primer Sequence Total bands Polymorphic bands Size (bp)
1 OPA-02 5’-TGCCGAGCTG-3’ 4 2 200-850
2 OPA-03 5’-AGTCAGCCAC-3’ 7 7 300-5000
3 OPA-09 5’-GGGTAACGCC-3’ 7 7 200-1650
4 OPA-14 5’-TCTGTGCTGG-3’ 6 5 100-2000
5 OPB-18 5’-CCACAGCAGT-3’ 11 6 100-5000
6 OPC-05 5’-GATGACCGCC-3’ 7 6 300-5000
7 OPC-08 5’-TGGACCGGTG-3’ 10 5 300-2000
8 OPC-11 5’-AAAGCTGCGG-3’ 8 7 100-5000
9 OPC-14 5’-TGCGTGCTTG-3’ 3 3 500-1650
10 OPD-08 5’-GTGTGCCCCA-3’ 7 3 200-5000
11 OPD-10 5’-GGTCTACACC-3’ 5 3 200-2000
12 OPD-20 5’-ACCCGGTCAC-3’ 10 9 200-5000
13 OPE-03 5’-CCAGATGCAC-3’ 4 2 100-5000
14 OPE-07 5’-AGATGCAGCC-3’ 7 3 200-1650
explant tissue sources and the selection of plant growth regulator concentrations. In addition, the substantial factor is done subculture during the doubling of embryo somatic cells and the callus maintenance phase also influences the formation of somaclonal variation.
The 14 mutant clones were irradiated by gamma ray and analyzed by RAPD generate a polymorphic band pattern that can distinguish between control plants and mutant plants. The alteration in the expression of a character is caused by genetic changes. Genetic changes can occur due to transformation in chromosome sets, chromosome numbers, chromosome structures or genes. The expressions of these characters can be at the morphological, physiological and biochemical levels (Griffith et al., 1993).
Grattapaglia et al. (1992) defines that the number of polymorphic bands describes the state of the plant genome, while the difference in the number and polymorphism bands produced by each primer illustrates the complexity of the plant genome. The primers that produced the most polymorphic bands were OPA-09, OPA-02, OPB-18, OPD-20 and OPC-05. Phillips et al. (1990) suggests that plant regenerates from callus and relatively undifferentiated causing the possibility of enormous genetic changes. These changes include changes in chromosome regulation and mutation of a single recessive single gene, DNA methylation and repeated point mutation phenomena that are usually referred to as regulatory errors affecting premeiotics. Various types of mutations associated with tissue culture are responsible factors in various phenotypic changes.
Genetic Diversity Analysis
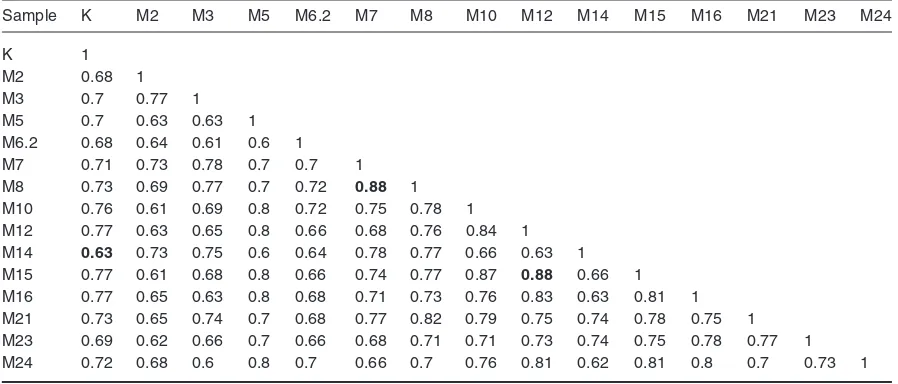
The phylogenetic analysis showed that the 14 mutant genotypes of rodent tuber and the control genotype used in this study split into two clusters at a coefficient of 0.67 (Figure 2). The first cluster consisted of 14 genotypes, while the second cluster consisted of only one genotype, the M6.2 genotype. Furthermore, the first cluster is subdivided into two subclusters of IA subcluster and IB subcluster. IA subcluster consists of 7 clones, including control while IB subcluster also consists of 7 genotypes. Based on the matrix of genetic similarity, there are two genotypes that have the closest relationship of the M12 and M15 genotypes in IA subcluster and M7 genotype in IB subcluster, each with a genetic equivalence coefficient value of 0.88, it means the genetic differences between the two pairs of genotype is only equal to 12% (Table 2).
Based on the matrix of genetic similarity (Table 3), there are 3 genotypes that have the closest genetic distance to the control (K) i.e. M12, M15, and M16 genotypes with the value of genetic equality coefficient of 0.77. This value means that the genotypes have a difference of 23% with the control genotype (K), while the genotype with the genetic distance furthest from the control (K) is the M14 genotype with the genetic similarity coefficient value of 0.63. The M14 genotype showed success in the mutation process because of the similarity with the control genotype that has diminished. If the mutation is positive and produces rodent tuber mutant plant with a better character than the control, the genotype is potential to be released and developed as new varieties of rodent tuber.
The results of the genetic relationship analysis of 14 mutant genotypes of rodent tuber using RAPD-PCR approach showed the existence of genetic distance and genetic variation. The results showed that there has been a DNA mutation in mutant genotypes caused by gamma irradiation treatment given on rodent tuber callus and occurrence of somaclonal variation during in vitro culture period. Gamma irradiation ionizes the cellular atom which it can damage the DNA base and make it mismatched. Irradiation can also alter the structure of chromosomes through deletion, inversion, duplication, and translocation. DNA changes may eventually increase phenotypic variation, one of which is planted morphology (van Harten, 1998).
In addition to gamma irradiation, somaclonal variation may also cause genetic differences or genetic variations as reflected by the morphological differentiation between the plant clones. According to van Harten (1998), somaclonal variation is the result of the irregularity of cell division by mitosis that occurs during the process of plant regeneration in vitro. Genetic variation due to somaclonal variation can be caused by doubling the number of chromosomes (fusion, endomitosis), changes in chromosome structure, gene changes, and cytoplasmic changes (Griffith et al., 1993; Kumar, 1995).
Genetic differences among the mutant geno-types are due to these genogeno-types originated from different cells. Mutations caused by gamma irradiation and somaclonal variability are random, each cell can express a genetic mutation with a different pattern (Surya & Soeranto, 2006; Pillay & Tenkouano, 2011). The differences in DNA gene sequencing can produce proteins and enzymes with different structures, functions, and expression
patterns, thus enhancing the plant morphology could be vary (Karp, 2008). Random changes to the genome due to gamma irradiation also occurred in coconut mutants (Rohani et al., 2012).
CONCLUSION
Molecular detection was detected the genetic changes in rodent tuber mutant plants. RAPD analysis using 14 primers had detected the genetic changes in the size range 100-5000 bp. Significant variations were observed in the genetic changes between the control and M14 clone in the size range 100-1650 bp with primer OPB-18. The genetic relationship analysis with RAPD marker has been shown on 14 mutant genotypes using 14 primers. The phylogenetic analysis showed that the 14 mutant genotypes split into 2 clusters at a coefficient of 0.67. 3 mutant genotypes with genetic distances closest to the control were genotype M12, M15, and M16 with genetic similarity coefficient values of 0.77 (23% of genetic differences), while genotypes with the farthest genetic distances from the control were genotype of the M14 with genetic similarity coefficient values of 0.63 (37% of genetic differences).
ACKNOWLEDGEMENTS
This work was funded by The Directorate general of Higher Education through competitive grant project and Bina Nusantara University through Nationwide University Network in Indonesia (NUNI) grant. The authors would like to thank The Directorate General of Higher Education, Table 3. Genetic similarity matrix of 15 genotypes of rodent tuber mutant based on RAPD marker
Sample K M2 M3 M5 M6.2 M7 M8 M10 M12 M14 M15 M16 M21 M23 M24
K 1
M2 0.68 1
M3 0.7 0.77 1
M5 0.7 0.63 0.63 1
M6.2 0.68 0.64 0.61 0.6 1
M7 0.71 0.73 0.78 0.7 0.7 1
M8 0.73 0.69 0.77 0.7 0.72 0.88 1
M10 0.76 0.61 0.69 0.8 0.72 0.75 0.78 1
M12 0.77 0.63 0.65 0.8 0.66 0.68 0.76 0.84 1
M14 0.63 0.73 0.75 0.6 0.64 0.78 0.77 0.66 0.63 1
M15 0.77 0.61 0.68 0.8 0.66 0.74 0.77 0.87 0.88 0.66 1
M16 0.77 0.65 0.63 0.8 0.68 0.71 0.73 0.76 0.83 0.63 0.81 1
M21 0.73 0.65 0.74 0.7 0.68 0.77 0.82 0.79 0.75 0.74 0.78 0.75 1
M23 0.69 0.62 0.66 0.7 0.66 0.68 0.71 0.71 0.73 0.74 0.75 0.78 0.77 1
Ministry of National Education, Indonesia and Bina Nusantara University. The authors are thankful to Wiwit Amrinola for helping in data analysis and Verlina for editing the paper.
REFERENCES
Abdullah, T.L., Endan, J. & Nazir, B.M. 2009. Changes in flower development, chlorophyll mutation and alteration in plant morphology of Curcuma alismatifolia by gamma irradiation. Journal of Applied Science, 6: 1436-1439. Ahloowalia, B.S., Maluszynski, M. & Nichterlein, K.
2004. Global impact of mutation-derived varieties. Euphytica, 135: 187-204.
Banerji, B.K. & Datta, S.K. 1992. Gamma ray induced flower shape mutation in crisanthemum cv ‘Java’. Journal of Nuclear Agriculture and Biology, 21(2): 73-79.
Busey, P. 1980. Gamma ray dosage and mutation breeding in St. Augustinegrass. Journal of the Crop Science Society of America, 20: 181-184. Choon, S.L., Rosemal, H.M., Nair, N.K., Majid,
M.I.A., Mansor, S.M. & Navaratnam. 2008. Typhonium flagelliforme inhibits cancer cell growth in vitro and induces apoptosis: An evaluation by the bioactivity guided approach. Journal of Ethnopharmacology, 118: 14-20. Datta, S.K., Chakrabarty, D., Verma, A.K. & Banerji,
B.K. 2011. Gamma ray induced chromosomal aberration and enzyme related defense mechanism in Allium cepa L. Caryologia, 64: 388-397. Doyle, J.J. & Doyle, J.L. 1987. A rapid DNA
isolation procedure for small quantities of fresh leaf tissue. Phytochemical Bulletin, 19: 11-15. Essai. 1986. Medicinal herbs index in Indonesia. PT
Essai Indonesia. 357 pp. (Bahasa).
Grattapaglia, D., Chaparro, J., Wilcox, P., McCord, S., Werner, D., Amerson, H., McKeand, S., Bridgwater, F., Whetten, R., O’Malley, D. & Sederoff, R. 1992. Mapping in woody plants with RAPD markers: application to breeding in forestry and horticulture. Application of RAPD Technology to Plant Breeding. Joint Plant Breeding Symposia Series CSSA/ASHS/AGA. Minneapolis. 1 November 1992.
Griffith, A.J.F., Suzuki, J., Miller, H. & Lewontin, R.C. 1993. An Introduction to genetic Analysis. 5th Ed. W.H. freeman and Co. pp. 840.
Heyne. 1987. Tumbuhan berguna Indonesia. Jilid I. Jakarta. 502 pp. (Bahasa).
Hoesen, D.S.H. 2007. Pertumbuhan dan per-kembangan tunas Typhonium secara in vitro. Berita Biologi, 8(5): 413-422.
Hu, J. & Quiros, G.F. 1991. Identification of broccoli and cauliflower cultivars with RAPD marker. Plant Cell Reports, 10: 505-511.
Kaeppler, S.M., Kaeppler, H.F. & Rhee, Y. 2000. Epigenetic aspects of somaclonal variation in plants. Plant Molecular Biology, 43: 179-188. Karp, A. 1995. Somaclonal variation in crop
improvement. Euphytica, 185: 295-302. Karp, G. 2008. Cell and Molecular Biology –
Concept and Experiment. 5th Ed. John Wiley &
Sons, Inc, USA.
Kumar, A. 1995. Somaclonal variation and molecular genetics department. Scottish Crop Research Institute, Invergrowrie Dundee. Canada. pp. 197-212.
Kumar, P.S. & Mathur, V.L. 2004. Chromosomal instability is callus culture of Pisum sativum. Plant Cell Tissue and Organ Culture, 78: 267-271.
Lamseejan, S., Jompok, P., Wongpiyasatid, A., Deeseepan, S. & Kwanthammachart, P. 2000. Gamma-rays induced morfological change in crysanthemum (Crysanthemum morifolium). Kasetsart Journal Natural Sciences, 34: 417-422.
McClelland, N., Nelson, M. & Raschke, E. 1994. Effect of site-spesific modification on restriction endonukleases and DNA modification methyl-transferase. Nucleic Acids Reesearchs, 22: 3640-3659.
Mohan, S., Bustamam, A., Ibrahim, S., Al-Zubairi, A.S. & Aspollah, M. 2008. Anticancerous Effect of Typhonium flagelliforme on Human T4-Lymphoblastoid Cell Line CEM-ss. Journal of Pharmacology and Toxicology, 3(6): 449-456. Mohan, S., Abdul, A., Abdelwahab, S., Al-Zubairi,
A., Sukari, M., Abdullah, R., Taha, M., Ibrahim, M. & Syam, S. 2010. Typhonium flagelliforme induces apoptosis in CEMss cells via activation of caspase-9, PARP cleavage and cytochrome c release: Its activation coupled with G0/G1 phase cell cycle arrest. Journal of Ethno-pharmacology, 131(3): 592-600.
Nurrochmad, A., Lukitaningsih, E. & Meiyanto, E. 2011. Anticancer activity of rodent tuber (Typhonium flagelliforme (lodd.) blume on human breast cancer T47D cells. International Journal of Phytomedicine, 2: 138-146.
Olhoft, P.M. & Phillips, R.L. 1999. Genetic and epigenetic instability in tissue culture and regenerated progenies. In Plant Responses to Enviroment Stresses: From Phytohormones to Genome Reorganization H. R. Lerner (Ed.), Marcel Dekker, New York. 111-148 pp.
Pelloquin, S.J. 1981. Manipulation of chromosome and cytoplasma. In: Kenneth JF (Eds). Plant Breeding III. Iowa State University Press. 117-150 pp.
Phillips, R.L., Plunkett, D.J. & Kaeppler, S.M. 1990. Do we understand somaclonal variation? Di dalam : H.J.J. Nijkamp et al. editor. Progress in Plant Cellular and Molecular Biology. Proc. 7th International Congress Plant Tissue Cell
Culture. 131-14 pp.
Putra, A., Tjahjono & Winarto. 2012. Efektivitas ekstrak umbi Typhonium flagelliforme fraksi diklorometanolik dalam menghambat pro-liferasi sel MCF-7 kanker payudara. Journal of The Indonesian Medical Association, 62(1): 10-15.
Rafalski, J.A., Tingey, S.V. & Williams, J.G.K. 1991. RAPD markers-a new technology for genetic mapping and plant breeding. AgBitech News and Information, 3: 645-648.
Rohani, O., Kamal, S., Rajinder, S. & Mohd-Nazir, B. 2012. Mutation induction using gamma irradiation on oil palm (Elaeis guineensis Jacq.) cultures. Journal of Oil Palm Research, 24: 1448-1458.
Rohlf, F.J. 2000. Statistical power comparisons among alternative morphometric methods. American Journal of Physical Anthropology, 111(4): 463-478.
Sianipar, N.F., Purnamaningsih, R., Darwati, I. & Laurent, D. 2016a. Gas chromatography-mass spectrometry (GC-MS) analysis of phyto-chemicals of first generation gamma-irradiated Typonium flagelliforme Lodd mutants. Journal Teknologi (Sciences & Engineering), 78(10): 1-7.
Sianipar, N.F., Purnamaningsih, R. & Rosaria. 2016b. Anticancer compounds of fourth generation gamma-irradiation Typhonium flagelliforme Lodd mutants based on gas chromatography-mass spectrometry. IOP Conference Series: Earth and Environmental Science, 41(1): 1-10.
Sianipar, N.F., Laurent, D., Chelen, Rosaria & Tanty, H. 2015. Induction, multiplication, and acclimatization of rodent tuber (Typhonium flagelliforme Lodd.) plant from Indonesia by in vitro organogenesis. International Conference on Technology, Informatics, Management, Engineering & Environment (TIME-E 2015), IEEE Proceedings, 1: 1-6.
Sianipar, N.F., Wantho, A., Rustikawati & Maarisit, W. 2013. The effect of gamma irradiation on growth response of rodent tuber (Typhonium flagelliforme Lodd.) mutant in vitro culture. HAYATI Journal of Bioscience, 20(2): 51-56. Surya, M.I. & Soeranto, R. 2006. Pengaruh iradiasi
sinar gamma terhadap pertumbuhan sorgum manis (Sorghum bicolor L.). Risalah Seminar Ilmiah Aplikasi lsotop dan Radiasi, pp. 206-215. (Bahasa).