PEMILIHAN BAHAN DAN PROSES
Berbagai Bahan & Proses pada sebuah Traktor
Manufacturing Processes for Engineering Materials, 5th ed.
Kalpakjian • Schmid
© 2008, Pearson Education ISBN No. 0-13-227271-7
GAMBAR 1.1 Traktor Model 8430, dengan ilustrasi rinci
tentang mesin diesel, menunjukkan berbagai material dan
proses penggabungan. Sumber: Courtesy of Perusahaan
John Deere.
Pentingnya Manufaktur
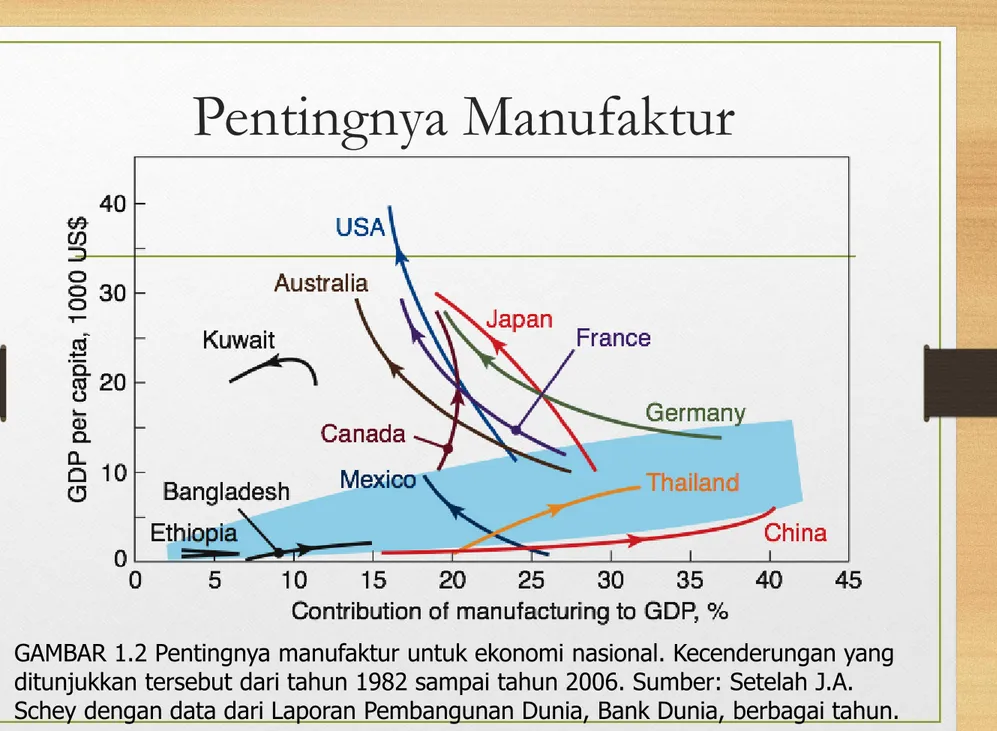
GAMBAR 1.2 Pentingnya manufaktur untuk ekonomi nasional. Kecenderungan yang
ditunjukkan tersebut dari tahun 1982 sampai tahun 2006. Sumber: Setelah J.A.
Schey dengan data dari Laporan Pembangunan Dunia, Bank Dunia, berbagai tahun.
Proses Pengembangan
Gambar 1.3
(a) Bagan yang menunjukkan berbagai
langkah terkait pada merancang dan
produk manufaktur. Tergantung pada
kompleksitas produk dan jenis bahan
yang digunakan, rentang waktu antara
konsep asli dan pemasaran produk
mungkin berkisar dari beberapa bulan
untuk bertahun-tahun.
(b) Grafik menunjukkan aliran produk
umum, dari analisis pasar untuk
menjual produk, dan menggambarkan
concurrent
engineering.
Sumber:
Setelah S. Pugh.
Bentuk &
Proses
Manufaktur
TABEL 1.2 Bentuk dan beberapa
metode umum produksi.
Desain pada Perakitan
GAMBAR 1.4 Redesain komponen untuk memudahkan perakitan otomatis.
Sumber: Dipetik dari G. Boothroyd dan P. Dewhurst, Desain Produk pada
Assembly, 1989, oleh milik Marcel Dekker, Inc
Mobil semua dari Aluminium
Gambar 1.5 (a) Audi A8 mobil, sebuah contoh konstruksi dari bahan canggih; (b)
struktur body aluminium, menampilkan berbagai komponen yang dibuat oleh ekstrusi,
pembentukan plat, dan proses pengecoran. Sumber: Courtesy of ALCOA, Inc
Metode Manufaktur
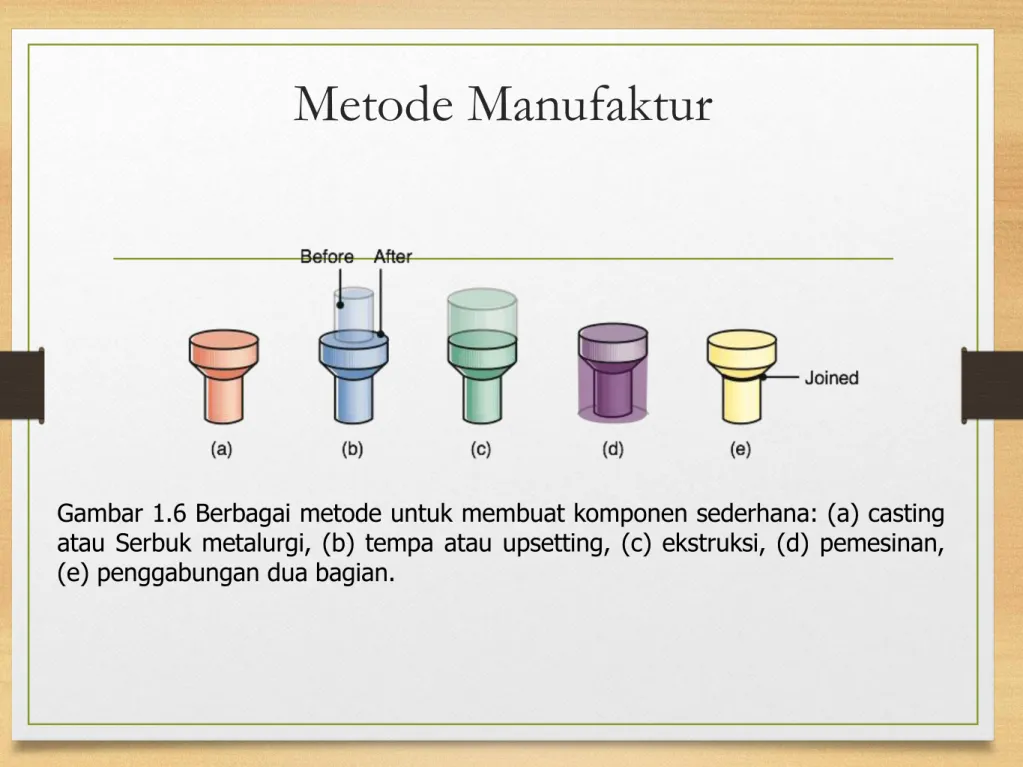
Gambar 1.6 Berbagai metode untuk membuat komponen sederhana: (a) casting
atau Serbuk metalurgi, (b) tempa atau upsetting, (c) ekstruksi, (d) pemesinan,
(e) penggabungan dua bagian.
Perbandingan ukuran pada Manufaktur
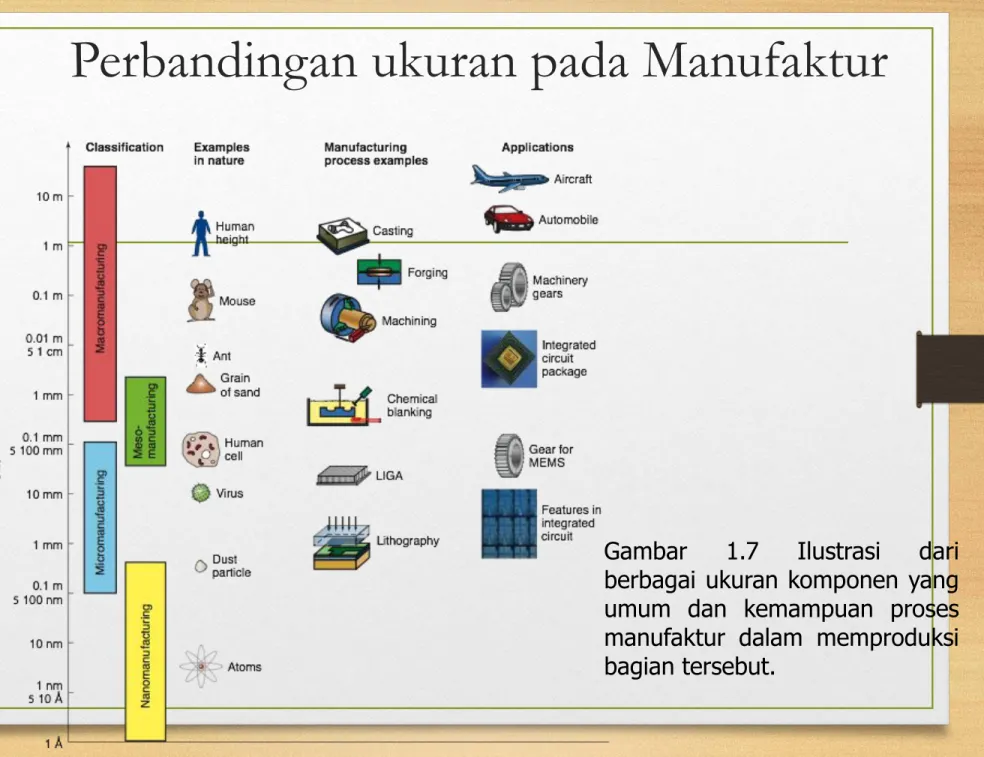
Gambar
1.7
Ilustrasi
dari
berbagai ukuran komponen yang
umum dan kemampuan proses
manufaktur dalam memproduksi
bagian tersebut.
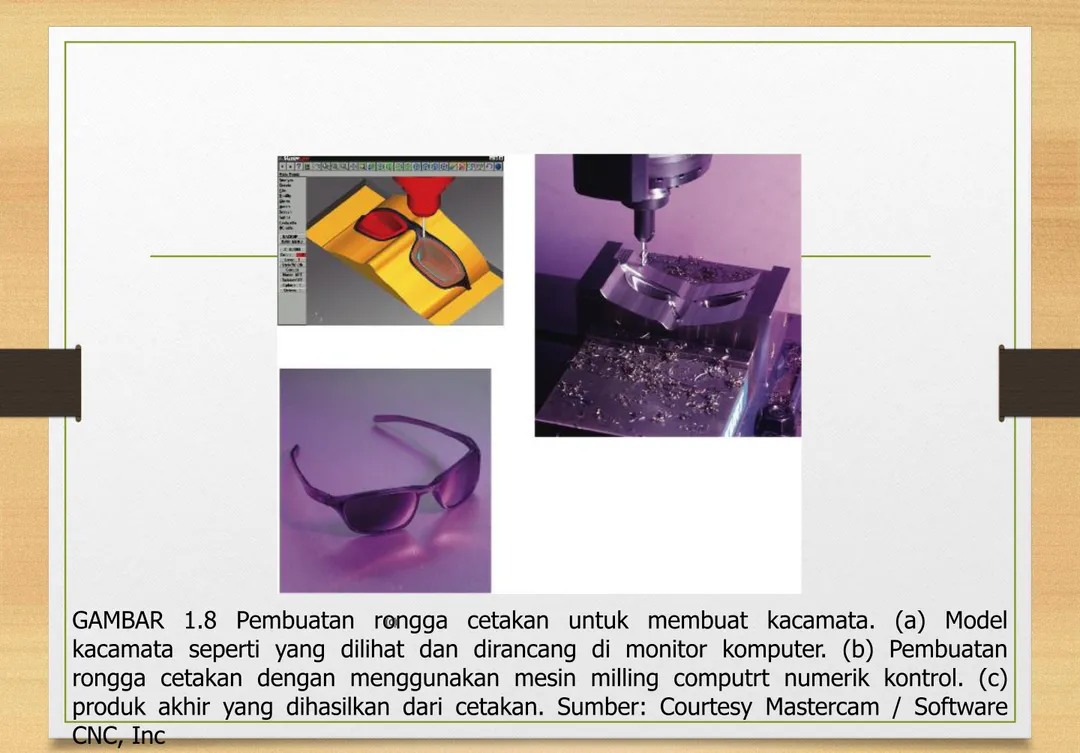
GAMBAR 1.8 Pembuatan rongga cetakan untuk membuat kacamata. (a) Model
kacamata seperti yang dilihat dan dirancang di monitor komputer. (b) Pembuatan
rongga cetakan dengan menggunakan mesin milling computrt numerik kontrol. (c)
produk akhir yang dihasilkan dari cetakan. Sumber: Courtesy Mastercam / Software
CNC, Inc
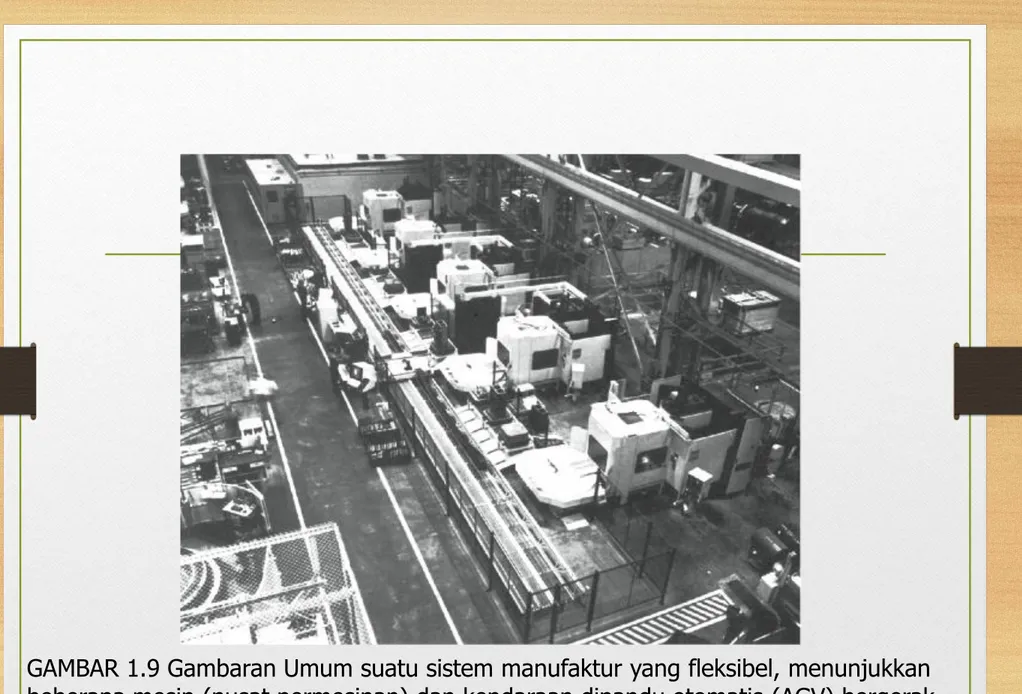
GAMBAR 1.9 Gambaran Umum suatu sistem manufaktur yang fleksibel, menunjukkan
beberapa mesin (pusat permesinan) dan kendaraan dipandu otomatis (AGV) bergerak
sepanjang lorong. Sumber: Courtesy of Milacron Cincinnati, Inc
REFERENSI
1.
S. Kalpakjian, Manufacturing Processes for Engineering Materials, 5th
ed. Pearson Education, 2008
2.
E.P. DeGarmo, Materials and Processes in Manufacturing, Prentice
Hall Inc., 2004
3.
P.L. Mangonon, The Principles of Materials Selection for Engineering
Design, Prentice Hall Inc., 1995
4.
B.H. Anstead, Proses Mekanik (terjemahan), Erlangga, Jakarta,
1979
Macam Tegangan
Manufacturing Processes for Engineering Materials, 5th ed. Kalpakjian • Schmid
© 2008, Pearson Education ISBN No. 0-13-227271-7
GAMBAR 2.1 Macam tegangan. (a) Tarik. (b) tekan. (c) Geser.
Semua Deformasi dalam proses pembuatan melibatkan jenis
tegangan ini. Tegangan tarik terjadi dalam peregangan lembaran
logam untuk membuat badan mobil, tegangan tekan dalam
menempa logam untuk membuat cakra turbin, dan tegangan geser
dalam membuat lubang dengan puncing.
Engineering Strain:
Tensile-Test
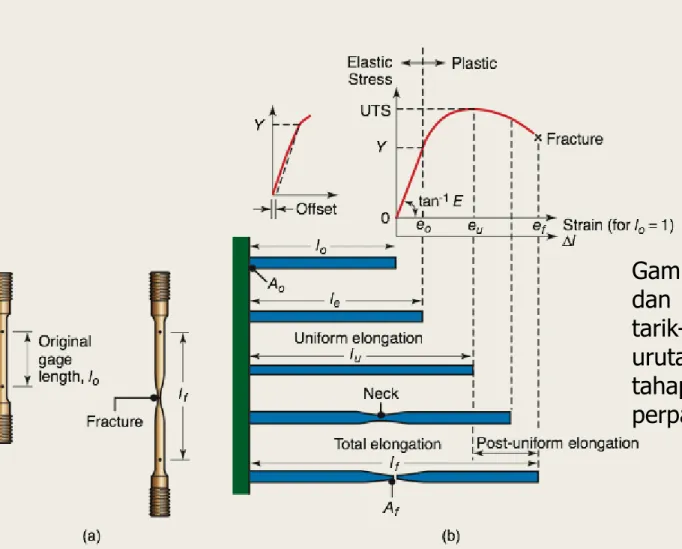
Gambar 2.2 (a) Bentuk awal
dan bentuk akhir dari spesimen
tarik-uji standar. (b) Garis Besar
urutan uji tarik menunjukkan
tahapan yang berbeda dalam
perpanjangan spesimen.
Mechanical Properties
TABLE 2.1 Typical mechanical properties of various materials at room temperature. See also Tables 10.1, 10.4, 10.8, 11.3 and 11.7.
Loading & Unloading; Elongation
FIGURE 2.3 Schematic illustration of loading and unloading of a tensile-test specimen. Note that during unloading the curve follows a path parallel to the original elastic slope.
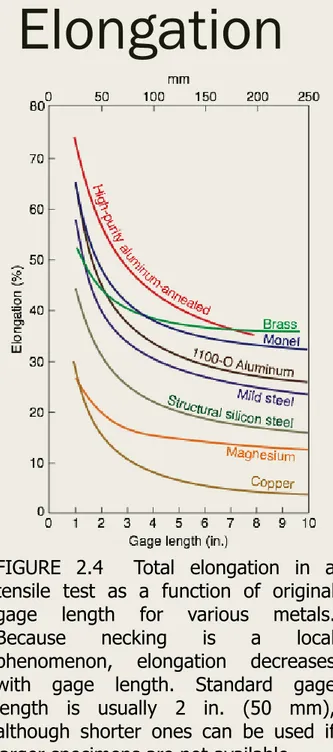
FIGURE 2.4 Total elongation in a tensile test as a function of original gage length for various metals. Because necking is a local phenomenon, elongation decreases with gage length. Standard gage length is usually 2 in. (50 mm), although shorter ones can be used if larger specimens are not available.
True Stress and True Strain
TABLE 2.2 Comparison of engineering and true strains in tension
True stress
True Stress - True Strain
Curve
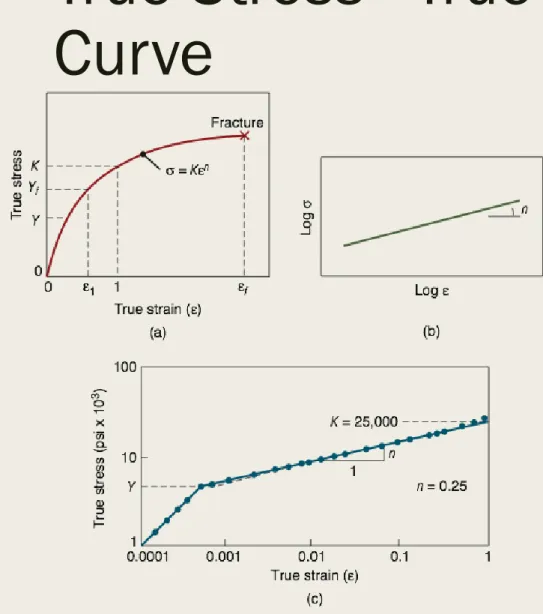
FIGURE 2.5 (a) True stress--true strain curve in tension. Note that, unlike in an engineering stress-strain curve, the slope is always positive and that the slope decreases with increasing strain. Although in the elastic range stress and strain are proportional, the total curve can be approximated by the power expression shown. On this curve, Y is the yield stress and Yf is the
flow stress. (b) True stress-true strain curve plotted on a log-log scale. (c) True stress-true strain curve in tension for 1100-O aluminum plotted on a log-log scale. Note the large difference in the slopes in the elastic and plastic ranges. Source: After R. M. Caddell and R. Sowerby.
Power Law Flow Rule
TABLE 2.3 Typical values for K and n
in Eq. 2.11 at room temperature.
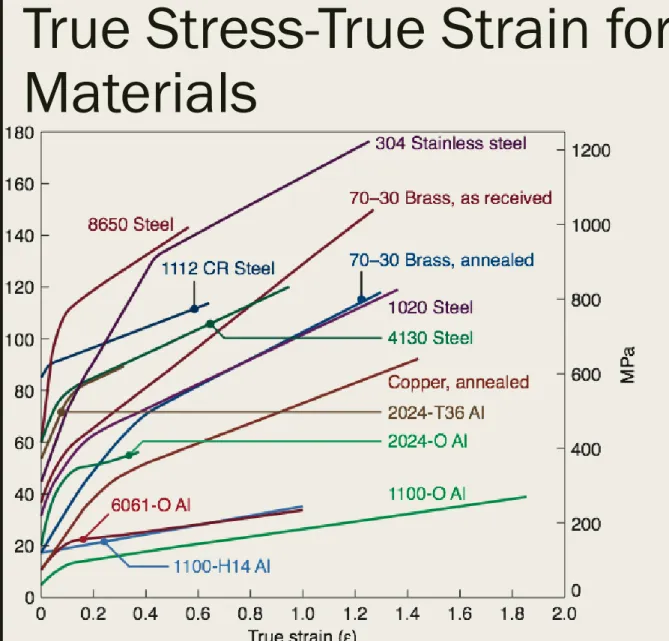
True Stress-True Strain for Various
Materials
FIGURE 2.6 True stress-true strain curves in tension at room temperature for various metals. The point of intersection of each curve at the ordinate is the yield stress Y; thus, the elastic portions of the curves are not indicated. When the K and n values are determined from these curves, they may not agree with those given in Table 2.3 because of the different sources from which they were collected. Source: S. Kalpakjian.
Idealized Stress-Strain
Curves
FIGURE 2.7 Schematic illustration of various types of idealized stress-strain curves. (a) Perfectly elastic. (b) Rigid, perfectly plastic. (c) Elastic, perfectly plastic. (d) Rigid, linearly strain hardening. (e) Elastic, linearly strain hardening. The broken lines and arrows indicate unloading and reloading during the test.
FIGURE 2.8 The effect of strain-hardening exponent n on the shape of true stress-true strain curves. When n
= 1, the material is elastic, and when n
Temperature and Strain Rate Effects
FIGURE 2.9 Effect of temperature on mechanical properties of a carbon steel. Most materials display similar temperature sensitivity for elastic modulus, yield strength, ultimate strength, and ductility.
FIGURE 2.10 The effect of strain rate on the ultimate tensile strength of aluminum. Note that as temperature increases, the slope increases. Thus, tensile strength becomes more and more sensitive to strain rate as temperature increases. Source: After J. H. Hollomon.
Typical Strain Rates in
Metalworking
TABLE 2.4 Typical ranges of strain, deformation speed, and strain rates in metalworking processes.
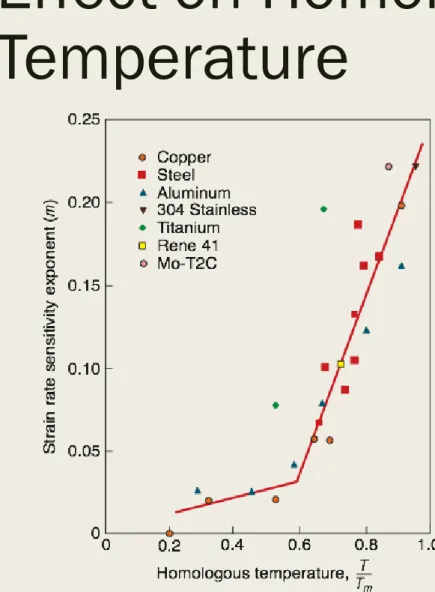
Effect on Homologous
Temperature
FIGURE 2.11 Dependence of the strain-rate sensitivity exponent m on the homologous temperature T/Tm for
various materials. T is the testing temperature and Tm is the melting
point of the metal, both on the absolute scale. The transition in the slopes of the curve occurs at about the recrystallization temperature of the metals. Source: After F. W. Boulger.
Strain Rate Effects
TABLE 2.5 Approximate range of values for C and m
in Eq. (2.16) for various annealed metals at true strains ranging from 0.2 to 1.0.
Effect of Strain Rate Sensitivity on
Elongation
FIGURE 2.12 (a) The effect of strain-rate sensitivity exponent m on the total elongation for various metals. Note that elongation at high values of m approaches 1000%. Source: After D. Lee and W.A. Backofen. (b) The effect of strain-rate sensitivity exponent m on the post uniform (after necking) elongation for various metals. Source: After A.K. Ghosh.
Hydrostatic Pressure &
Barreling
FIGURE 2.13 The effect of hydrostatic pressure on true strain at fracture in tension for various metals. Even cast iron becomes ductile under high pressure. Source: After H.L.D. Pugh and D. Green.
FIGURE 2.14 Barreling in compressing a round solid cylindrical specimen (7075-O aluminum) between flat dies. Barreling is caused by friction at the die-specimen interfaces, which retards the free flow of the material. See also Figs.6.1 and 6.2. Source: K.M. Kulkarni and S. Kalpakjian.
Plane-Strain Compression
Test
FIGURE 2.15 Schematic illustration of the plane-strain compression test. The dimensional relationships shown should be satisfied for this test to be useful and reproducible. This test gives the yield stress of the material in plane strain, Y’.
Source: After A. Nadai and H. Ford.
Tension & Compression; Baushinger
Effect
FIGURE 2.16 True stress-true strain curve in tension and compression for aluminum. For ductile metals, the curves for tension and compression are identical. Source: After A.H. Cottrell.
FIGURE 2.17 Schematic illustration of the Bauschinger effect. Arrows show loading and unloading paths. Note the decrease in the yield stress in compression after the specimen has been subjected to tension. The same result is obtained if compression is applied first, followed by tension, whereby the yield stress in tension decreases.
Disk & Torsion Tests
FIGURE 2.18 Disk test on a brittle material, showing the direction of loading and the fracture path. This test is useful for brittle materials, such as ceramics and carbides.
FIGURE 2.19 A typical torsion-test specimen. It is mounted between the two heads of a machine and is twisted. Note the shear deformation of an element in the reduced section.
Simple vs. Pure Shear
FIGURE 2.20 Comparison of (a) simple shear and (b) pure shear. Note that simple shear is equivalent to pure shear plus a rotation.
Three- and Four-Point Bend-Tests
FIGURE 2.21 Two bend-test methods for brittle materials: (a) three-point bending; (b) four-point bending. The shaded areas on the beams represent the bending-moment diagrams, described in texts on the mechanics of solids. Note the region of constant maximum bending moment in (b), whereas the maximum bending moment occurs only at the center of the specimen in (a).
Hardness Tests
FIGURE 2.22 General characteristics of hardness testing methods. The Knoop test is known as a microhardness test because of the light load and small impressions. Source: After H.W. Hayden, W.G. Moffatt, and V. Wulff.
Hardness Test Considerations
FIGURE 2.23 Indentation geometry for Brinell hardness testing: (a) annealed metal; (b) work-hardened metal. Note the difference in metal flow at the periphery of the impressions.
FIGURE 2.25 Bulk deformation in mild steel under a spherical indenter. Note that the depth of the deformed zone is about one order of magnitude larger than the depth of indentation. For a hardness test to be valid, the material should be allowed to fully develop this zone. This is why thinner specimens require smaller indentations. Source:
Courtesy of M.C. Shaw and C.T. Yang.
FIGURE 2.24 Relation between Brinell hardness and yield stress for aluminum and steels. For comparison, the Brinell hardness (which is always measured in kg/mm2) is converted to psi units on the left scale.
Fatigue
FIGURE 2.26 Typical S-N curves for two metals. Note that, unlike steel, aluminum does not have an endurance limit.
FIGURE 2.27 Ratio of fatigue strength to tensile strength for various metals, as a function of tensile strength.
Creep & Impact
FIGURE 2.28 Schematic illustration of a typical creep curve. The linear segment of the curve (constant slope) is useful in designing components for a specific creep life.
FIGURE 2.29 Impact test specimens: (a) Charpy; (b) lzod.
Residual Stresses
FIGURE 2.30 Residual stresses developed in bending a beam made of an elastic, strain-hardening material. Note that unloading is equivalent to applying an equal and opposite moment to the part, as shown in (b). Because of nonuniform deformation, most parts made by plastic deformation processes contain residual stresses. Note that the forces and moments due to residual stresses must be internally balanced.
Distortion due to Residual
Stress
FIGURE 2.31 Distortion of parts with residual stresses after cutting or slitting: (a) rolled sheet or plate; (b) drawn rod; (c) thin-walled tubing. Because of the presence of residual stresses on the surfaces of parts, a round drill may produce an oval-shaped hole because of relaxation of stresses when a portion is removed.
Elimination of Residual
Stresses
FIGURE 2.32 Elimination of residual stresses by stretching. Residual stresses can be also reduced or eliminated by thermal treatments, such as stress relieving or annealing.
State of Stress in
Metalworking
FIGURE 2.33 The state of stress in various metalworking operations. (a) Expansion of a thin-walled spherical shell under internal pressure. (b) Drawing of round rod or wire through a conical die to reduce its diameter; see Section 6.5 (c) Deep drawing of sheet metal with a punch and die to make a cup; see Section 7.6.
Strain State in Necking
FIGURE 2.34 Stress distribution in the necked region of a tension-test specimen.
States of Stress
FIGURE 2.35 Examples of states of stress: (a) plane stress in sheet stretching; there are no stresses acting on the surfaces of the sheet. (b) plane stress in compression; there are no stresses acting on the sides of the specimen being compressed. (c) plane strain in tension; the width of the sheet remains constant while being stretched. (d) plane strain in compression (see also Fig. 2.15); the width of the specimen remains constant due to the restraint by the groove. (e) Triaxial tensile stresses acting on an element. (f) Hydrostatic compression of an element. Note also that an element on the cylindrical portion of a thin-walled tube in torsion is in the condition of both plane stress and plane strain (see also Section 2.11.7).
Yield Criteria
Maximum-shear-stress criterion:
Flow Stress and Work of
Deformation
FIGURE 2.37 Schematic illustration of true stress-true strain curve showing yield stress Y, average flow stress, specific energy u1 and flow stress Yf.
Flow stress:
Ideal & Redundant Work
FIGURE 2.38 Deformation of grid patterns in a workpiece: (a) original pattern; (b) after ideal deformation; (c) after inhomogeneous deformation, requiring redundant work of deformation. Note that (c) is basically (b) with additional shearing, especially at the outer layers. Thus (c) requires greater work of deformation than (b). See also Figs. 6.3 and 6.49.
Total specific energy:
Sifat mekanik, pengujian dan
sifat manufaktur material
TUJUAN PENGUJIAN MEKANIS
Untuk mengevaluasi (evaluate) sifat mekanis dasar
untuk dipakai dalam disain
Untuk memprediksi (predict) performa (unjuk kerja)
material dibawah kondisi pembebanan
Untuk memperoleh (provide) data sifat mekanis dari
material seperti kekuatan (strength), kekakuan
(stiffness), elastisitas (elasticity), plastisitas
PERTIMBANGAN
Pertimbangan penting dalam design suatu struktur
atau mesin adalah kekuatannya. Sifat tersebut adalah
dimana peralatan dapat menjalankan fungsinya secara
aman dan baik.
Contoh : Peralatan crane harus mendukung (support)
beban tanpa terjadi perpatahan atau tanpa bengkok
(bending) sehingga tidak mempersulit operator dari
Sifat Mekanik
Material dalam pengunaanya
dikenakan gaya atau beban.
Karena itu perlu diketahui kharater
material agar deformasi yg terjadi
tidak berlebihan dan tidak terjadi
kerusakan atau patah
Karakter material tergantung pada:
Komposisi kimia
Struktur mikro
Sifat material: sifat mekanik, sifat
fisik dan sifat kimia
Material
Gaya/beban
Sifat mekanik
Kekuatan (strength): ukuran besar gaya yang
diperlukan utk mematahkan atau merusak suatu
bahan
Kekuatan luluh (yield strength): kekuatan bahan
terhadap deformasi awal
Kekuatan tarik (tensile strength): kekuatan
maksimun yang dapat menerima beban.
Keuletan (ductility): berhubungan dengan besar
Sifat Mekanik
Kekerasan (hardness): ketahanan bahan terhadap
penetrasi pada permukaannya
Ketangguhan (toughness): jumlah energi yang
mampu diserap bahan sampai terjadi perpatahan
Mulur (creep)
Kelelahan (fatique): ketahanan bahan terhadap
pembebanan dinamik
Konsep tegangan & regangan
Pembebanan statik:
Tarik
Kompressi
Geser
F
F
F
F
Beban tarik
Beban kompressi
F
F
Uji tarik
Standar sampel untuk uji tarik
Tegangan teknik, = F/A
o
(N/m
2
=Pa)
Regangan teknik, = (l
i
-l
o
)/l
o
Tegangan geser, = F/A
o
2¼
’
2’
¾
’
0,505’
R 3/8’
Deformasi elastis
Pada pembebanan rendah
dalam uji tarik, hubungan
antara tegangan dan
regangan linier
Teg.
Reg
.
Modulus
elastis
Pembebanan
Beban
dihilangkan
Deformasi elastis
Hubungan tersebut masih dalam daerah
deformasi elastis dan dinyatakan dengan
Hubungan diatas dikenal sebagai Hukum
Hooke
Deformasi yang mempunyai hubungan
tegangan dan regangan linier
(proporsional) disebut sebagai deformasi
elastis
Paduan
logam
Modulus elastis
(104 MPa)
Modulus geser
(104 MPa)
Ratio
Poisson
Al
6,9
2,6
0,33
Cu-Zn
10,1
3,7
0,35
Cu
11,0
4,6
0,35
Mg
4,5
1,7
0,29
Ni
20,7
7,6
0,31
Baja
20,7
8,3
0,27
Ti
10,7
4,5
0,36
W
40,7
16,0
0,28
Hubungan tegangan
geser dan regangan
geser dinyatakan
dengan
= G
Dengan
= teg.geser
= reg.geser
G = modulus geser
½
½
Sifat elastis material
Ketika uji tarik dilakukan pada
suatu logam, perpanjangan pada
arah beban, yang dinyatakan
dalam regangan
z
mengakibatkan terjadinya
regangan kompressi pada
x
sb-x
dan
y
pada sumbu-y
Bila beban pada arah sumbu-z
uniaxial, maka
x
=
y
. Ratio
regangan lateral & axial dikenal
sebagai ratio Poisson
Z
Z
z
x
y
=
x
/
y
Harga selalu positip, karena tanda
x
dan
y
berlawanan.
Hubungan modulus Young dengan modulus
geser dinyatakan dengan
E = 2 G (1 + )
Biasanya <0,5 dan untuk logam
umumnya
Deformasi plastis
Untuk material logam,
umumnya deformso elastis
terjadi < 0,005 regangan
Regangan > 0,005 terjadi
deformasi plastis
(deformasi permanen)
Ikatan atom atau molekul
putus : atom atau molekul
berpindah tidak kembali
pada posisinya bila
tegangan dihilangkan
Teg.
Teg.
Reg.
Reg.
ys
ys
Titik
luluh atas
Titik
Luluh bawah
0,002
Perilaku uji tarik
Titik luluh: transisi
elastis & platis
Kekuatan: kekuatan
tarik: kekuatan
maksimum
Dari kekuatan
maksimum hingga titik
terjadinya patah,
diameter sampel uji
tarik mengecil
Keuletan (ductility)
Keuletan: derajat deformasi plastis hingga
terjadinya patah
Keuletan dinyatakan dengan
Presentasi elongasi,
%El. = (l
f
-l
o
)/l
o
x 100%
Presentasi reduksi area,
Ketangguan (Toughness)
Perbedaan antara kurva
tegangan dan regangan
hasil uji tarik utk
material yang getas
dan ulet
ABC : ketangguhan
material getas
AB’C’ : ketangguhan
material ulet
Teg.
Reg.
A
B
B’
C
C’
Logam
Kekuatan luluh
(MPa)
Kekuatan tarik
(MPa)
Keuletan
%El.
Au
-
130
45
Al
28
69
45
Cu
69
200
45
Fe
130
262
45
Ni
138
480
40
Ti
240
330
30
Mo
565
655
35
Tegangan & regangan sebenarnya
Pada daerah necking,
luas tampang lintang
sampel uji material
Tegangan sebenarnya
T
= F/A
i
Regangan sebenarnya
T
= ln l
i
/l
o
Teg.
Reg.
teknik
sebenarnya
Bila volum sampel uji tidak berubah, maka
A
i
l
i
= A
o
l
o
Hubungan tegangan teknik dengan tegangan
sebenarnya
T
= (1 + )
Hubungan regangan teknik dengan regangan
sebenarnya
Uji Kekerasan (Hardness Test)
Kekerasan dari suatu logam pada dasarnya adalah
ketahanannya terhadap tusukan (indentor) dan
telah memberikan indikasi akan kekuatan suatu
logam.
Test kekerasan yang paling umum adalah
mengguna-kan suatu kekuatan beban untuk meusumengguna-kan indentor
terhadap material yg sedang di tes.
Alat untuk menusuk (indentor) biasanya adalah
suatu material umumnya adalah intan – yang ada
dalam berbagai bentuk.
Uji Kekerasan (Hardness Test)
Faktor yang menentukan nilai kekerasan adalah
kedalaman bekas tusukan.
Bentuk indentor dapat pyramidal (vikers) ataupun
bulat (brinell).
Besar kecilnya nilai kekerasan suatu material
diperoleh dengan mengukur panjangnya diagonal
dari diameter bekas tusukan indentor.
Uji Mulur (Creep Test)
Jika suatu beban, yang nilainya dibawah tensile strength
suatu material diterapkan pada suhu kamar, material
perlahan akan memanjang (dapat diukur) pada saat
beban diterapkan.
Namun jika suatu beban yang sama diterapkan terus
menerus pada suhu yang makin tinggi, maka material
akan perlahan – lahan terus memanjang, selama
pembebanan terus berlangsung.
Tingkah laku ini disebut creep.
Menahan beban cukup lama akan menyebabkan material
Uji Mulur (Creep Test)
Dua faktor lain yang penting yang menyebakan
benda patah adalah waktu dan suhu.
Semakin tinggi suhunya semakin pendek waktu yang
dibutuhkan untuk menghasilkan jumlah sejumlah
creep.
Pada suatu suhu yang lebih tinggi, akan
menyebabkan creep dan pecah terjadi lebih cepat.
Namun tegangan creep ditandai dengan jumlah
tekanan yang dibutuhkan untuk menghasilkan
sejumlah tegangan creep dalam suatu waktu pada
suatu suhu tertentu
Uji Kelelahan (Fatique Test)
Jika suatu material menerima stress yang nilainya
lebih kecil dari ultimate strength, maka material
tersebut tidak akan patah; jika beban yang sama
diangkat lalu diterapkan kembali beberapa kali
maka akhirnya ia akan patah.
Melipat suatu penjepit kertas (klip) berulang – ulang
sampai pada titik patahnya adalah suatu contoh tipe
fatigue.
Kekuatan suatu material untuk menahan beban yang
Uji Kelelahan (Fatique Test)
Fatigue strength biasanya dihubungkan dengan
jumlah siklus yang dibutuhkan untuk mencapai titik
kegagalan.
Fatigue strength biasanya ditentukan dengan
menerapkan suatu beban dan pada level yang sama
juga mendapat tekanan.
Makin dekat nilai stress maksimum pada nilai tensile
strength, makin sedikit rangkaian proses yang
dibutuhkan sebelum peristiwa patah terjadi. Ketika
nilai stress dikurangi, makin banyak jumlah
Pengujian Impak Charpy
Gambar 1. Alat uji
Pengujian Impak Charpy
Benda uji dipatahkan dengan benturan dari sebuah palu
pendulum yang berat, yang jatuh dari jarak tetap
(energi potensial yang konstan) untuk membentur
benda uji dengan kecepatan yang tetap (energi kinetik
yang konstan).
Bahan-bahan yang tangguh (tough) menyerap banyak
energi ketika dipatahkan dan bahan-bahan yang getas
(brittle) menyerap energi sangat sedikit.
Banyak faktor yang mempengaruhi ketangguhan dan
tidak semua material memiliki ketangguhan yang sama.
Material yang tangguh memiliki suhu transisi dan
kekuatan patah yang lebih rendah, pada segala suhu
biasanya membutuhkan energi yang lebih besar.
39