Published online EarlyView 2 January 2014 in Wiley Online Library (wileyonlinelibrary.com) DOI: 10.1002/smj.2205 Received 22 February 2012;Final revision received 23 June 2013
RESEARCH NOTES AND COMMENTARIES
CASH IS SURPRISINGLY VALUABLE
AS A STRATEGIC ASSET
CHANGHYUN KIM* and RICHARD A. BETTIS
Strategy and Entrepreneurship Department, Kenan-Flagler Business School, University of North Carolina, Chapel Hill, North Carolina, U.S.A.
Academics, politicians, and journalists are often highly critical of U.S. firms for holding too much cash. Cash holdings are stockpiled free-cash flow and incur substantial opportunity costs from the perspectives of economics. However, behavioral theory highlights the benefits of cash holdings as fungible slack resources facilitating adaptive advantages. We use the countervailing forces embodied in these two theories to hypothesize and test a quadratic functional relationship of returns to cash measured by Tobin’s q. We also build and test a related novel hypothesis of scale-dependent returns to cash based on the competitive strategy concept of strategic deterrence. Tests for both of these hypotheses are positive and show that returns to cash continue to increase far beyond transactional needs. Copyright2013 John Wiley & Sons, Ltd.
INTRODUCTION
Academics, politicians, and journalists often crit-icize U.S. firms for holding too much cash. For example, in 2006 U.S. public firms had more cash than debt on average, a startling finding (Bates, Kahle, and Stulz, 2009). This is an inherently interesting and important phenomenon. Obviously these levels of cash holdings are much greater than is necessary for transactional needs. The general, social, and political criticism of large cash hold-ings is that firms have an obligation to use this cash to create jobs by making investments.
The economic research-based criticism is largely traceable to Jensen (1986, 1989) and others (Fama, 1980; Leibenstein, 1966), who focused their research on the opportunity costs
Keywords: cash; slack; strategic deterrence; behavioral theory; agency theory
*Correspondence to: Changhyun Kim, Kenan-Flagler Business School, Strategy and Entrepreneurship, McColl 5506, CB #3490, Chapel Hill, NC 27599, U.S.A. E-mail: changhyun_kim@ kenan-flagler.unc.edu
Copyright2013 John Wiley & Sons, Ltd.
of shareholders when firms hold excess cash. Specifically, they examined the incentives and discretion of managers to pursue their own interests instead of maximizing shareholder wealth. Both informal and theoretical criticisms of cash holdings beyond transactional needs can seem compelling. However, strategy scholars, primarily of a behavioral bent, have theorized and identified strategic benefits of holding slack generally, including cash (e.g., George, 2005) or cash at relatively high levels (e.g., O’Brien and Folta, 2009). Generally, they invoke the role of slack, often specifically in the form of cash, as an enabler of risky innovation efforts.
year and industry fixed effects. We then develop a related novel theory of scale advantage for absolute levels of cash holdings based on the strategic concept of competitive deterrence. This strategic deterrence theory is then tested and affirmed by examining the interaction of firm size with cash holdings.
THE VALUE OF HOLDING CASH: COSTS AND BENEFITS
There is substantial theoretical literature on both the costs and the benefits of holding cash. Recent empirical studies have demonstrated that under certain conditions, as cash holdings increase, financial performance continues to increase far beyond the level of cash holdings required to meet transactions needs. In this section we briefly discuss literature on two countervailing forces that together shape the relationship between cash holdings above transactional needs and firm value from a shareholder perspective. Cash can both generate opportunistic managerial behavior and facilitate strategic and adaptive advantages. The underlying trade-off is generally between two theories of managerial behavior—one type based in economic theory of firms and man-agers, and the other based on what is usu-ally referred to as “behavioral theory of the firm.”
Economics describes human behavior as perfectly rational and entirely self-interested. Behavioral theory of the firm describes man-agerial behavior as boundedly rational and emphasizes a process of search for satisfactory solutions (“satisficing”) to problems. It rejects the possibility of optimizing behavior in all but the simplest problems. The two theories are not necessarily mutually exclusive (Levinthal, 2011). Both self-interested behavior and satisficing are often observed in firms.
Economic approach regarding costs of holding cash
Holding cash at the level necessary for transaction needs (required cash payments about to occur), but no more, is generally seen as appropriate optimizing behavior in economics. Holding more cash than necessary for transaction needs is finan-cially wasteful since it earns very low measureable
returns and incurs large opportunity costs. From this perspective cash and slack generally are seen in the finance and economics literature as symp-tomatic of managerial inefficiency or self-serving behavior. This suggests excess cash should either be invested in positive NPV projects or paid to shareholders in the form of dividends or share repurchases so that the cash can be invested in firms with positive NPV projects (see any intro-ductory finance text). The most important for-malization of this is called the free cash flow (FCF) hypothesis. It uses an agency theory model of governance that emphasizes how opportunis-tic (i.e., self-interested) managers with little stake in the financial success of the firm can squander resources (Jensen, 1986). To remedy this behav-ior, Jensen recommended high financial lever-age by substituting debt for most of the equity, thereby engendering strong governance (Jensen, 1989). As a direct consequence, large interest pay-ments will minimize cash available for alloca-tion to value-destroying investments and enforce profit maximization. This negative view of cash is also consistent with earlier work by Leiben-stein (1966) and Williamson (1967). However, as O’Brien and Folta (2009) point out, even financial theory suggests cash may be beneficial to some kinds of firms. Capital market frictions are seen in the finance literature as significant in many cir-cumstances. For example, according to Myers and Majluf (1984), firms with insufficient cash will have to forgo valuable (positive NPV) investment opportunities.
Behavioral approach regarding benefits of holding cash
A broad managerial behavior literature base sup-ports the holding of slack including cash beyond transactional needs. This does not always mean that the results are shown to apply to cash specif-ically instead of slack generally, but it indicates some level of plausibility for the purpose of for-mulating a hypothesis.
Slack in general is a behavioral concept in both origin and development. Behavioral schol-ars starting with Cyert and March (1963) argue that slack allows firms to resolve latent con-flict between competing political coalitions within organizations. In other words, it serves as a buffer that allows side payments, thereby allowing the firm to adapt as a whole. It should be noted
that, although Cyert and March framed their the-ory of slack around “political coalitions,” sub-stantive differences in strategy choices can and often do lie behind the politics. In this regard and others, it is also worth noting that cash is fully fungible. By contrast, there are usually sub-stantial frictions associated with converting among forms of absorbed slack such as excess capacity or personnel. For example, the need for product-development engineers cannot be easily or quickly corrected by transferring slack manufacturing engineers.
Firms face external uncertainty in macroeco-nomic conditions, demand, regulation, legislation, new entrants, energy costs, etc. For example, when a firm faces an uncertain decision such as the choice between two new alternative produc-tion technologies, it can use cash as a buffer to delay a decision until the uncertainty is adequately resolved and then move aggressively or hedge by further developing each technological alternative (e.g., two pilot plants) to gain more information on the comparative advantages and disadvantages (Courtney, 2001, discusses such strategic hedging). Naturally, some firms by virtue of industry char-acteristics constantly face relatively high levels of uncertainty. In terms of uncertainty, probably the most salient industries involve those in fast-moving innovative contexts such as pharmaceu-ticals, computers, and consumer electronics. This has naturally produced a large literature relating cash and slack generally to adaptation in R&D-intensive industries (Hill and Snell, 1988; O’Brien, 2003; Teece, 1986).
Bourgeois (1981) notes that slack allows the pursuit of innovations because it protects the orga-nization from the uncertainty of success. O’Brien and Folta (2009), after reviewing the benefits of holding cash that financial and behavioral theo-ries see for R&D-intensive firms, examine this issue in the context of an interesting transaction cost–based theory. They find that R&D-intensive firms can have high returns to holding cash if proper governance mechanisms are present, and this effect is amplified with increasing uncer-tainty. Slack encourages innovation by facilitat-ing the pursuit of risky projects that cannot be justified by internal return hurdles but that are strongly supported by champions such as engi-neers and scientists (Levinthal and March, 1981). Such a use of slack is consistent with the broad evidence supporting serendipitous discovery and
invention and with behavioral theory (e.g., Cyert and March, 1963; March, 2006). Interestingly, Nohria and Gulati (1996) found that both too much and too little slack may be detrimental to innova-tion (inverted “U” shape). However, risk aversion of managers above (but not far above) the refer-ence point leads to the emergrefer-ence of accumulated slack. The “cushion effect” (Jeffrey, Onay, and Larrick, 2010) formalizes the behavioral role of slack in innovation as providing a cushion for fail-ure and thereby motivating risk taking in the form of innovation and other activities. Furthermore, MacCrimmon and Wehrung (1986) and Bromiley (1991) found that managers are more likely to take risks when the firm has high levels of wealth or slack. Conversely, managers become risk averse and conservative when there is no room for fail-ure (March and Shapira, 1987), thereby damping innovation.
Hypothesis on overall returns to cash
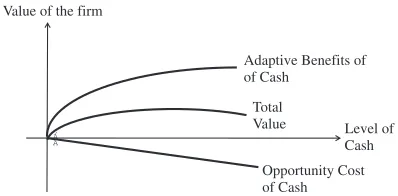
The arguments so far suggest countervailing forces regarding returns to cash, as shown in Figure 1. The combination of low returns and opportunity cost embodied in the economic approach are con-tinuously increasing beyond the level of cash necessary to meet transactional needs. By con-trast, the adaptive benefits of holding increasing cash with regard to uncertainty, risk taking, and innovation are likely to become asymptotic as such profitable opportunities are exhausted. Fur-thermore, Bromiley (1991) suggests that holding excess cash may insulate the firm from the envi-ronment, thereby frustrating adaptation. Mathe-matically, the net result of increasing cost with asymptotic benefit is as, one would expect, a quadratic relationship for returns to cash with a negative squared term, as shown in Figure 1.
Value of the firm
Level of Cash Adaptive Benefits of of Cash
Opportunity Cost of Cash Total Value
Hypothesis 1: The relationship between cash holdings and firm value takes the form of a quadratic function with a positive original term and a negative squared term.
Such a quadratic relationship is often referred to in the literature as an inverted “U” functional form. We have chosen to use the technically correct term “quadratic relationship” since “inverted U” implies that the peak lies with the valid range of the dataset, which may or may not be true. Estimation significantly beyond the valid range of the data cannot be justified.
Regarding the first hypothesis there are two related but quite different empirical studies. Tan and Peng (2003) tested and confirmed an inverted “U” relationship (their characterization) between slack and firm performance measured by total pre-tax profits in a sample of 1,532 Chinese firms over a two-year period.1 Nohria and Gulati (1996), using survey data, also found that both too much and too little slack may be detrimental to innovation.
Competitive strategy and absolute cash economics hypothesis
Much has been written about the ability of smaller firms to move more quickly than larger firms to exploit emerging opportunities (Christensen, 1997; Christensen and Bower, 1996; Schumpeter, 1934). However, such analyses often ignore the high rates of failure among small firms, suffer from survivor bias, and overstate the innovative inertia of incumbent firms (Danneels, 2004). On the other side, in industries where economies of scale come into play (e.g., global oil exploration, commodity chemicals, and heavy manufacturing) the scale advantages of size are often obvious and large (Schumpeter, 1950; Teece, 1986). In this section we develop a hypothesis built on scale economies of cash based on a competitive advantage of
1Tan and Peng (2003) used only age and size as profit controls but did not control for industry effects and could not control for several other firm characteristics critical to profit, although Schmalensee (1985), Rumelt (1991), and McGahan and Porter (1997) found industry and firm characteristics to be significant and substantial using variance components analysis. Tan and Peng (2003) also used highly nonstandard measures for unabsorbed slack, including ‘loan,’ depreciation, accounts payable, and retained earnings, but surprisingly did not include cash.
large firms over small firms with regard to higher absolute levels of cash holding. Such advantages derive largely from the theory of defensive strategy and from the fungible nature of cash.
Defensive strategy (Chapter 14 of Porter, 1985, provides a summary) deals with the inevitable attacks of competitors trying to reposition or gain other competitive advantages such as scale economies or threats from potential new entrants into the industry. As Porter (1985) puts it, “Defen-sive strategy aims to lower the probability of attack, divert attacks to less threatening avenues or lessen their intensity” (p 482). A major com-ponent of defensive strategy is competitive deter-rence. Deterrence both increases the uncertainty of success for an attacker and lowers the expected return. In much of the literature on deterrence, this involves the commitment of costly and risky hard asset–based strategies such as building capacity ahead of demand (Ghemawat, 1984, is a classic discussion) to preempt competitors. However, such large, irreversible asset commitments intended to deter competitors from making similar commit-ments can backfire (Ghemawat and Sol, 1998). This leads logically to the consideration of hold-ing the capacity for preemptive assets in a flexi-ble form that can be deployed relatively quickly in a variety of ways depending on how competi-tive uncertainties unfold and are resolved. In other words, cash can be and often is a highly flexi-ble form of crediflexi-ble threat to deter competitors. It both decreases the expected value of a competi-tor’s investment (possibility of a matching or larger investment) and increases uncertainty (unknow-able probability of whether the credible threat rep-resented by cash will be executed). This raises the two issues of commitment and deterrence.
As Ghemawat and Sol (1998) point out, once slack resources are committed to firm-specific uses (e.g., capacity), the firm loses response flexibility. Depending on the credibility posed by an attacker, it may be necessary to make such irreversible commitments at a suitable time. However, cash is the most flexible form of slack a firm can have since it can be converted at any time for any purpose. As Caves and Porter (1977) put it, “Other forms of excess capacity (broadly conceived) effectively enlarge a firm’s retaliatory power. Funds can be retained in more liquid forms or invested in more saleable types of fixed assets that allow their retrieval in the event of price warfare (or other predatory conflict)” (p 245). Hence, the
fully fungible nature of cash allows firms facing uncertain future competitor investments to defer their own decisions regarding counter investments until uncertainty can be adequately resolved. At the same time, they can make very credible specific threats (perhaps in the form of bluffs) regarding actions they “intend to take.” In itself such a capability engendered by cash can deter the actions of competitors with lower levels of cash and higher dependence on the capital markets for financing.
In this sense, cash represents a latent ability to deter a variety of threats from both known and unknown potential competitors but not a commitment to any particular specific use at any particular time. This option-like property of cash increases with the absolute level of cash holdings rather than with cash holdings relative to the size of the firm. Effectively preempting competitor strategic investments usually depends on the absolute cost of the appropriate asset. Future competitive uses such as efficient scale plants, new technology, or advertising campaigns display absolute scale economies, not economies that are scaled to the relative size of the firm. Moreover, larger firms may find it easier to accumulate larger cash holdings and thus to create economic value from competitive deterrence due to various forms of monopoly power (e.g., production economies of scale and scope) that size embodies. In other words, the value of deterrence represented by absolute level of cash will increase with firm size. As a simple example, consider two firms for which total assets are $10 and $100 respectively. If each holds 20 percent of their assets in cash, this will correspond to $2 and $20 dollars respectively. The latter firm has an obvious scale advantage in absolute cash holdings, which could not be matched even by the former firm being composed only of cash, a foolish possibility.
In summary, if strategic deterrence is indeed one of the main benefits of cash, then firm size will moderate the relationship between cash holdings and firm value to shareholders. This leads directly to the following hypothesis:
Hypothesis 2: The interaction of cash holdings with firm size is positively related to firm value.
Furthermore, this means that there is a higher probability that smaller firms will have to disclose competitively valuable strategic information in
the process of obtaining external financing when making investments comparable to those of a larger firm or a division of a larger firm (Bettis, 1983). In contrast, a larger competitor with large absolute cash reserves can often protect such information, thereby increasing the competitive uncertainty for smaller competitor. Finally, if the smaller competitor needs to take on debt, then financial leverage will increase, resulting in more sensitivity of earnings to environmental turbulence.
METHODS AND DATA
Most of the variables in our sample come from the CRSP-COMPUSTAT merged database. Initially we began with all 18,128 firms (and 157,174 firm-year observations) listed in the database between the years 1987 and 2009. Following standard data-screening processes used by Villalonga (2004b) and Brush, Bromiley, and Hendrickx (2000), we excluded (1) firm-year observations whose assets are below US$ 10 million in all years;2 (2) those with missing data for standard industrial classification (SIC) codes or key variables; (3) those with SIC codes between 6000 and 6999 (financial institutions), between 9100 and 9199 (government, excluding finance), or between 9900 and 9999 (nonclassifiable establishments); and (4) those with an R&D ratio (R&D expense divided by sales) or advertising ratio (advertising expense divided by sales) higher than 1.3 As a result of using one-year lags, the dependent variable starts in 1988 instead of 1987. Our final sample contains 8,900 firms and 63,103 firm-year observations from 1987 to 2009. Summary statistics for the final sample are shown in Table 1.
T
We use Tobin’s q as the dependent variable, as did O’Brien and Folta (2009) in their study of returns to cash in R&D-intensive firms. Using a market-based measure as a dependent variable is more appropriate to gauge opportunity costs and benefits accruing to shareholders. Opportunity costs concern the discrepancy that cash holdings create between actual output and maximum output. If the level of cash holding is not the best use of the assets and incurs opportunity costs, capital markets would impose a penalty on the excess cash, even though actual accounting-based profitability could still be improving. Furthermore, it is shareholders who bear the opportunity costs. Tobin’s q is a well-established measure to meet the conditions necessary to measure opportunity costs that shareholders must bear (Villalonga, 2004b).4
In estimating Tobin’s q, the market value of the firm is divided by total assets (AT). Following Brush et al. (2000), market value is the sum of calendar-year end5 values of the firm’s common stock (PRCC_C × CSHO), market value of the firm’s preferred stock (PSTK), book value of the firm’s long-term debt (DLTT), and book value of the firm’s short-term debt with a maturity less than 1 (DD1).
Explanatory variables
We use the cash and short-term investments (CHE) as our measure for cash holdings. Cash stock is appropriate from the perspective of agency theory. In the finance literature, cash stock is recognized as stockpiled free cash flow (FCF) because additions to cash reserves occur when managers accumulate free cash flow rather than spending it immediately through dividends or share repurchases (Harford, 1999). Indeed, Jensen (1986, 1989) focused on the cumulative cash balance rather than the yearly free cash flow when he characterized managerial misbehavior. All things considered, cash stock
4For robustness, we conducted Winsorization by excluding firm-year observations that fall in the bottom one percent or top one percent. There is no significant change in terms of interpreting main results of this paper.
5In our econometric model, we use year fixed effect. Therefore, we use calendar-year end values of the firm’s common stock (Brush et al., 2000). We also run a regression model based on fiscal-year end values of the firm’s common stock. This treatment does not affect the interpretation of the main results of this paper.
nicely embraces the aspects covered by both slack arguments based on behavioral theory and free cash flow arguments based on agency theory. In this paper, cash stock is measured by cash and short-term investments (CHE) divided by total assets (AT).6
To test the interaction effect of firm size and cash holdings and to control for the size of firms, we use the natural logarithm of the number of total employees (Ocasio, 1994; Villalonga, 2004a). Using the number of total employees as the proxy for a firm’s size has an advantage over using sales or total asset. Having already used total assets to scale Tobin’s q, using total assets again as the proxy for size may introduce a spurious statistical relation between Tobin’s q and size (Titman and Wessels, 1988).7 A similar issue may arise when we use sales as the proxy for size. The use of the number of total employees does not suffer from this issue.
Control variables
We control for a variety of variables that are standard controls when Tobin’s q is the dependent variable. We also control for other variables that relate specifically to the impact of cash holdings on the value of the firm.
We follow Lehn and Poulsen (1989) and define
undistributed cash flowas operating income before depreciation (OIBDP), minus total income taxes (TXT), minus the changes in deferred taxes from the previous year to the current year (changes in TXDITC), minus gross interest expenses on total
6The operationalized measure for cash holdings within firms (cash and short-term investments divided by total assets) ranges from 0 to 1 because it is scaled by total assets. The issue arises that the squared term of this measure is mathematically always smaller than the original term. This issue may lead researchers to misinterpret the changes in the value of the firm as firms increase the cash ratio to total assets. With other ways of constructing the variable where the variable goes beyond 1, researchers would find the value of the firm decreases abruptly after a certain threshold. With a measure ranging from 0 to 1, however, researchers would find the value of the firm maintained after the threshold due to the design of the variable. To address this issue, we multiplied extant measure of cash ratio by 3 and squared the newly calculated measure. We then ran regressions and checked the results. We don’t find any substantial differences between two ways of construction, which means that the trajectory we find stems from the given distribution of data points, not from the confinements resulted from variable construction.
7We ran a regression with the size variable measured by natural log of sales. We found a similar interaction effect between cash and firm size in terms of significance and sign.
debt (XINT), minus the total amount of preferred dividend requirement on cumulative preferred stock and dividends paid on noncumulative pre-ferred stock (DVP), minus the total dollar amount of dividends declared on common stock (DVC). Cash flow is scaled by total assets (AT). This mea-sure functions as a control forprofitability.8
We include the leverage ratio, LR, to control for the effect of debt on firm value. LR is defined as the firm’s total debt (DLTT+DLC) divided by total assets (AT).
Prior research has shown that research and
advertising intensity are highly correlated with market measures of firm value (Hall, 1993). We follow prior literatures and scale research and development expenditure (XRD) and advertising expenditure (XAD) by net sales (SALE) (e.g., Chatterjee and Singh, 1999; Lee and Lieberman, 2010). A problem in studies using R&D and advertising is the substantial amount of missing data for both of these variables from most com-pany databases. Following Hall (1993), we assume that missing values are equal to 0. To control for the impact of growth on the value of the firm, we follow Brush et al. (2000) and define growth rate, as ln(SALEJ,T/SALEJ,T-1). In addition, we include capital expenditures (CAPX) divided by total assets (AT) as an obvious determinant of firm value.
Sales and general administration costs (XSGA) divided by sales (SALE) and net working capital (Working capital – Cash) divided by total assets (AT) are used to measure absorbed slack. These are standard measures of absorbed slack and enable us to compare the impact of absorbed slack on the firm value with the impact of unabsorbed slack (cash).
We take year fixed effects to account for unobservable macroeconomics effects. We control for industry fixed effects by using three-digit SIC codes.
Statistical models
The use of panel data has some important advan-tages but is also prone to potential problems such
as autocorrelation, heteroskedasticity, and contem-poraneous correlation (Greene, 2003).
We detected heteroskedasticity using the Breusch-Pagan test. We also tested for first-order autocorrelation using the Breusch-Godfrey LM test and confirmed the existence of this problem. Given these problems, we followed Beck and Katz (1995) and used the Prais and Winsten (1954)9approach with robust standard error. Also, analysis of variance inflation factors revealed that multicollinearity was not a problem in any of the reported models except the (expected) correlation of first-order terms with their products and squares. However, it has no meaningful effect on the estimation or interpretation of regression equations that contain these terms (Edwards, 2008). We centered these terms, which show higher variance inflation factors due to squared or interaction term, at their means and ran a regression. There was no change in the coefficient of squared term or interaction term.
RESULTS
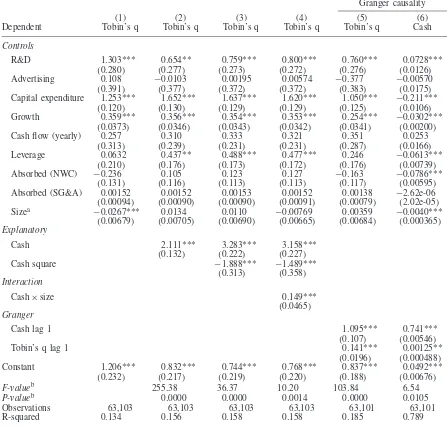
Descriptive statistics are provided in Table 1. The nested results of the four models of the impact of cash on firm value are shown in Table 2. The first model contains only control variables. The second model adds cash. The third model adds cash squared to test the existence of decreasing marginal return of cash. The fourth model deals with the interaction terms between size and cash for the second hypothesis.10
Across the models, several control variables have positive and significant effects on Tobin’s q. Higher R&D, capital expenditure, sales growth rate, and leverage contribute to higher Tobin’s q of firms, conforming to our expectations. Other measures for absorbed slack resources, net work-ing capital, and SG&A do not show significant impact on the value of firm statistically or econom-ically. This result conforms to prior research, Tan and Peng (2003) and George (2005), where unab-sorbed slack resources significantly contribute to
9We also tried a dynamic fixed-effect model with one-year-lagged dependent variables. There is no substantial difference in terms of interpreting main results of this paper.
10To address the issue of an alternative explanation that high growth firms tend to hold more cash, we used a Granger (1969) causality test. Results of Granger causality are provided in models 5 and 6.
firm performance while absorbed slack resources show insignificant impact on firm performances.
Our first hypothesis is supported. The coefficient of cash is significant and positive across all the models. For the cash-squared term, the coefficients in models 3 and 4 are negative and significant as predicted. A Granger causality (Granger, 1969) test also shows evidence that the direction of causality goes from cash to firm performance, not vice versa.
Not only is the combined impact of cash and cash squared significant, but it is also substantial. Holding other variables constant, the increase of cash holdings from 7 percent, the median value of our sample, to 15 percent, the mean value of our sample, leads to a 22 percent increase of Tobin’s q.11 As the level of cash holdings increases, the marginal effects of the increase of cash holdings decrease until the cash holding ratio approaches to 70 percent where it becomes almost flat. Actually, the cash holding ratio of Google (51%), MS (52%), or Apple (60%) in 201212 is close to this critical level. However, notice that most of firm years hold less cash than 20 percent of their total asset (75% of total firm years) and that the Tobin’s q of firm years with more than 20 percent of cash holdings are driven by highly successful firms.
Given the observed coefficients of cash and cash squared, the calculated optimal point of cash holdings (around 0.89 of total assets) is substantially higher than common sense dictates or the statistics justify. This is far outside the valid range of the data. Estimates near the ends of the sample regarding cash holdings have wide confidence intervals and results are meaningless beyond what is justified by the presence of adequate data as we move toward extreme values of any variable (see any textbook on regression). The estimate of the optimal level of cash is obviously beyond the point where it can be justified by enough (or any) data at high levels of cash holdings. Furthermore, it is unlikely that many firms have any experience with cash levels this high since they would likely engender very low stock prices and be the immediate object of a takeover.
11The difference in the mean and median points to a power distribution of cash, where there is a long right tail for cash holdings.
12Actually, these firms may have higher cash holding ratios than appeared here, because these firms often locate a substantial amount of cash outside of the United States for tax purposes.
Table 2. Regression results
Granger causality
(1) (2) (3) (4) (5) (6)
Dependent Tobin’s q Tobin’s q Tobin’s q Tobin’s q Tobin’s q Cash
Controls
R&D 1.303*** 0.654** 0.759*** 0.800*** 0.760*** 0.0728***
(0.280) (0.277) (0.273) (0.272) (0.276) (0.0126)
Advertising 0.108 −0.0103 0.00195 0.00574 −0.377 −0.00570
(0.391) (0.377) (0.372) (0.372) (0.383) (0.0175)
Capital expenditure 1.253*** 1.652*** 1.637*** 1.620*** 1.050*** −0.211***
(0.120) (0.130) (0.129) (0.129) (0.125) (0.0106)
Growth 0.359*** 0.356*** 0.354*** 0.353*** 0.254*** −0.0302***
(0.0373) (0.0346) (0.0343) (0.0342) (0.0341) (0.00200)
Cash flow (yearly) 0.257 0.310 0.333 0.321 0.351 0.0253
(0.313) (0.239) (0.231) (0.231) (0.287) (0.0166)
Leverage 0.0632 0.437** 0.488*** 0.477*** 0.246 −0.0613***
(0.210) (0.176) (0.173) (0.172) (0.176) (0.00739)
Absorbed (NWC) −0.236 0.105 0.123 0.127 −0.163 −0.0786***
(0.131) (0.116) (0.113) (0.113) (0.117) (0.00595)
Absorbed (SG&A) 0.00152 0.00152 0.00153 0.00152 0.00138 −2.62e-06
(0.00094) (0.00090) (0.00090) (0.00091) (0.00079) (2.02e-05)
Sizea −0.0267*** 0.0134 0.0110 −0.00769 0.00359 −0.0040***
(0.00679) (0.00705) (0.00690) (0.00665) (0.00684) (0.000365)
Explanatory
Cash 2.111*** 3.283*** 3.158***
(0.132) (0.222) (0.227)
Cash square −1.888*** −1.489***
(0.313) (0.358)
Interaction
Cash×size 0.149***
(0.0465)
Granger
Cash lag 1 1.095*** 0.741***
(0.107) (0.00546)
Tobin’s q lag 1 0.141*** 0.00125**
(0.0196) (0.000488)
Constant 1.206*** 0.832*** 0.744*** 0.768*** 0.837*** 0.0492***
(0.232) (0.217) (0.219) (0.220) (0.188) (0.00676)
F-valueb 255.38 36.37 10.20 103.84 6.54
P-valueb 0.0000 0.0000 0.0014 0.0000 0.0105
Observations 63,103 63,103 63,103 63,103 63,101 63,101
R-squared 0.134 0.156 0.158 0.158 0.185 0.789
( ) is standard error of coefficient. Standard errors are robust to heteroskedasticity and autocorrelation. Estimated coefficients for year and industry dummy variables not reported.
***p<0.01; **p<0.05. NWK: net working capital.
aNatural Log of the number of total employees.
bF-value/P-value in Models 2, 3, 4, 5, and 6 are the value of cash, cash squared, the interaction between cash and size against Model 1 (the base model), cash lag 1, and Tobin’s q lag 1 respectively.
The second hypothesis is also supported. The coefficient of the interaction term between cash and size in model 4 is positive and significant.13
13We also checked the interaction between size and cash squared. The coefficient of the interaction term is positive and significant. Hence, the hypothesis still holds in this case.
DISCUSSION
The evidence from the test of Hypothesis 1 in this study runs counter to recent (and previous) crit-icisms by many academics, politicians, and jour-nalists. Shareholders can benefit from high levels of cash holdings way beyond those required for transactional needs. This has obvious implications for managers and investors. However, it ignores the political debate that focuses on the potential of firms to use these cash holdings at their dis-cretion to create jobs and thereby benefit the U.S. economy as a whole. Obviously there is a clash of values and assumptions between this direct job-creation viewpoint and the potential share-holder benefits of holding cash that could lead to more investment and subsequent job growth. One group generally favors government intervention or encouragement to limit cash holdings (buttressed interestingly by Jensen’s free cash flow hypothe-sis), while another generally favors allowing firms to function primarily under the governance mech-anisms of the capital market without government intervention on this issue. We cannot comment fur-ther than what the data allow—that unexpectedly high levels of cash holdings are not a problem from a shareholder point of view.
We hope others will run similar multyear studies in different regions of the world. For example, there are reasons to suggest that managers in Europe may have different beliefs about the proper role of accumulated cash from U.S. firms. In particular, EU firms and governments often have assumed or mandated goals including social goals, and these may bear on the issue of direct job creation versus shareholder returns as a driver of job creation.
The test of Hypothesis 2 provides evidence of a deterrence effect of cash that generally favors the larger firms in an industry. However, it should be noted that this is only one effect and must be balanced against various other advantages and disadvantages of size. That said, it argues for managers in larger firms of an industry to combine substantial cash reserves with other defensive measures to preserve their strong competitive positions. It also suggests, not surprisingly, that smaller firms in an industry should consider difficult to imitate strategic moves, rather than easily matched investments.
In terms of future research with respect to the results of Hypothesis 2, longitudinal studies of
the dynamics of cash accumulation and strategic deployment among different relative-size firms with industries could put better bounds on the appropriate level of cash accumulation.
ACKNOWLEDGEMENTS
We appreciate the insightful guidance from Asso-ciate Editor Kulwant Singh and the construc-tive comments from two anonymous reviewers. We also thank Atul Nerkar, Hugh O’Neill, Scott Rockart, Larry Chavis and the seminar participants at University of North Carolina at Chapel Hill and University of California at Irvine.
REFERENCES
Bates TW, Kahle KM, Stulz RM. 2009. Why do U.S. firms hold so much more cash than they used to?
Journal of Finance 64(5): 1985–2021.
Beck N, Katz JN. 1995. What to do (and not to do) with time-series cross-section data.American Political Science Review 89(3): 634–647.
Bettis RA. 1983. Modern financial theory, corporate strat-egy and public policy: three conundrums.Academy of Management Review 8(3): 406–415.
Bourgeois LJ III. 1981. On the measurement of organi-zational slack.Academy of Management Review 6(1): 29–39.
Bromiley P. 1991. Testing a causal model of corporate risk taking and performance.Academy of Management Journal 34(1): 37–59.
Brush TH, Bromiley P, Hendrickx M. 2000. The free cash flow hypothesis for sales growth and firm performance. Strategic Management Journal 21(4): 455–472.
Caves RE, Porter ME. 1977. From entry barriers to mobility barriers: conjectural decisions and contrived deterrence to new competition.The Quarterly Journal of Economics91(2): 241–261.
Chatterjee S, Singh J. 1999. Are tradeoffs inherent in diversification moves? A simultaneous model for type of diversification and mode of expansion decisions.
Management Science 45(1): 25–41.
Christensen CM. 1997.The Innovator’s Dilemma: When New Technologies Cause Great Firms to Fail. Harvard Business School Press: Boston, MA.
Christensen CM, Bower JL. 1996. Customer power, strategic investment, and the failure of leading firms.
Strategic Management Journal 17(3): 197–218. Courtney H. 2001.20/20 Foresight: Crafting Strategy in
an Uncertain World. Harvard Business School Press: Boston, MA.
Cyert RM, March JG. 1963.A Behavioral Theory of the Firm. Blackwell Business: Cambridge, MA.
Danneels E. 2004. Disruptive technology reconsidered: a critique and research agenda. Journal of Product Innovation Management 21(4): 246–258.
Edwards JR (ed). 2008.Seven Deadly Myths of Testing Moderation in Organizational Research. Erlbaum: Mahwah, NJ.
Fama EF. 1980. Agency problems and the theory of the firm.Journal of Political Economy 88(2): 288–307. George G. 2005. Slack resources and the performance of
privately held firms.Academy of Management Journal
48(4): 661–676.
Ghemawat P. 1984. Capacity expansion in the titanium dioxide industry. Journal of Industrial Economics
33(2): 145–163.
Ghemawat P, Sol P. 1998. Commitment versus flexibil-ity?California Management Review 40(4): 26–42. Granger CWJ. 1969. Investigating causal relations
by econometric models and cross-spectral methods.
Econometrica37(3): 424–438.
Greene WH. 2003.Econometric Analysis. Prentice Hall: Upper Saddle River, NJ.
Hall BH. 1993. The stock market’s valuation of R&D investment during the 1980’s. American Economic Review 83(2): 259–264.
Harford J. 1999. Corporate cash reserves and acquisitions.
Journal of Finance54(6): 1969–1997.
Hill, Charles WL, Scott A. Snell. 1988. External control, corporate strategy, and firm performance in research-intensive industries.Strategic Management Journal 9: 577–590.
Jeffrey SA, Onay S, Larrick RP. 2010. Goal attainment as a resource: the cushion effect in risky choice above a goal.Journal of Behavioral Decision Making 23(2): 191–202.
Jensen MC. 1986. Agency costs of free cash flow, corporate finance, and takeovers.American Economic Review 76(2): 323–329.
Jensen MC. 1989. Eclipse of the public corporation.
Harvard Business Review67(5): 61–74.
Lang LHP, Stulz R, Walkling RA. 1991. A test of the free cash flow hypothesis: the case of bidder returns.
Journal of Financial Economics 29(2): 315–335. Lee GK, Lieberman MB. 2010. Acquisition vs. internal
development as modes of market entry. Strategic Management Journal 31(2): 140–158.
Lehn K, Poulsen A. 1989. Free cash flow and stockholder gains in going private transactions.Journal of Finance
44(3): 771–787.
Leibenstein H. 1966. Allocative efficiency vs. “X-efficiency”. American Economic Review 56(3): 392–415.
Levinthal DA. 2011. A behavioral approach to
strategy—what’s the alternative? Strategic Manage-ment Journal 32(13): 1517–1523.
Levinthal D, March JG. 1981. A model of adaptive organizational search.Journal of Economic Behavior & Organization2(4): 307–333.
MacCrimmon KR, Wehrung DA. 1986.Taking Risks: The Management of Uncertainty. Free Press: New York. March JG. 2006. Rationality, foolishness, and adaptive
intelligence. Strategic Management Journal 27(3): 201–214.
March JG, Shapira Z. 1987. Managerial perspectives on risk and risk taking. Management Science 33(11): 1404–1418.
McGahan AM. 1999. The performance of U.S. corpo-rations: 1981–1994.Journal of Industrial Economics
47(4): 373–398.
McGahan AM, Porter ME. 1997. How much does indus-try matter, really? Strategic Management Journal, (Special Issue: Organizational and Competitive Inter-actions)18: 15–30.
Myers SC, Majluf NS. 1984. Corporate financing and investment decisions when firms have information that investors do not have.Journal of Financial Economics
13(2): 187–221.
Nohria N, Gulati R. 1996. Is slack good or bad for innovation? Academy of Management Journal 39(5): 1245–1264.
O’Brien JP. 2003. The capital structure implications of pursuing a strategy of innovation. Strategic Manage-ment Journal 24(5): 415–431.
O’Brien JP, Folta TB. 2009. A transaction cost perspec-tive on why, how, and when cash impacts firm per-formance.Managerial and Decision Economics30(7): 465–479.
Ocasio W. 1994. Political dynamics and the circulation of power: CEO succession in U.S. industrial corpo-rations, 1960–1990.Administrative Science Quarterly
39(2): 285–312.
Porter ME. 1985. Competitive Advantage: Creating and Sustaining Superior Performance. Free Press: New York.
Prais SJ, Winsten CB. 1954. Trend estimators and serial correlation. Cowles Commission Discussion paper 383. Cowles Foundation: New Haven.
Rumelt RP. 1991. How much does industry matter?
Strategic Management Journal 12(3): 167–185. Schmalensee R. 1985. Do markets differ much?American
Economic Review 75(3): 341–351.
Schumpeter JA. 1934.The Theory of Economic Develop-ment: An Inquiry into Profits, Capital, Credit, Inter-est, and the Business Cycle. Harvard University Press: Cambridge, MA.
Schumpeter JA. 1950.Capitalism, Socialism, and Democ-racy. Harper: New York.
Tan J, Peng MW. 2003. Organizational slack and firm performance during economic transitions: two studies from an emerging economy. Strategic Management Journal 24(13): 1249–1263.
Teece DJ. 1986. Profiting from technological inno-vation: implications for integration, collaboration, licensing and public policy. Research Policy 15(6): 285–305.
Titman S, Wessels R. 1988. The determinants of capital structure choice.Journal of Finance43(1): 1–19. Villalonga B. 2004a. Diversification discount or
pre-mium? New evidence from the business infor-mation tracking series. Journal of Finance 59(2): 479–506.
Villalonga B. 2004b. Intangible resources, Tobin’s q, and sustainability of performance differences. Jour-nal of Economic Behavior & Organization 54(2): 205–230.