CHANGES IN FISHING PATTERN FROM SURFACE TO DEEP LONGLINE FISHING
BY THE INDONESIAN VESSELS OPERATING IN THE INDIAN OCEAN
Lilis Sadiyah1), Natalie Dowling2), and Budi Iskandar Prisantoso1)
1) Researcher at Research Center for Fisheries Management and Conservation, Ancol-Jakarta
2) Researcher at CSIRO Marine and Atmospheric Research, Tasmania-Australia Received April 26-2011; Received in revised form May 20-2011; Accepted May 31-2011
ABSTRACT
To understand the historical catch and effort trends of Indonesian commercial tuna longline fishery, the (P.T. Perikanan Samodra Besar) data are a valuable source, since they are the longest time series of catch and effort data available from the fishery. This paper aimed to interpret the spatial and temporal catch and effort trends to the extent possible and to reconcile apparent changes in targeting practices against the actual catch. Catch and effort data collected by P.T. Perikanan Samodra Besar from its Benoa-based longliners during 1978-1995 were summed to obtain annual catch, effort, and catch per unit of effort trends. To generate spatial distributions of catch and effort, catch and effort data were aggregated by 5-degree squares. The data showed that P.T. Perikanan Samodra Besar vessels commenced deep longlining in 1983, i.e. 56% of the total sets in 1983 using 10 or more hooks between floats. Prior to that, P.T. Perikanan Samodra Besar vessels used 6 hooks between floats, which resulted in a larger amount of yellowfin tuna (Thunnus albacares) as well as overall tuna catch. However, bigeye tuna (Thunnus obsesus) catch per unit of effort only increased from 1992. The increase in big eye tuna catch per unit of effort coincided with a reduced fishing range and concentration within an area where P.T. Perikanan Samodra Besar had not previously experienced high big eye tuna catches, as opposed to focusing their effort on areas where they had historically caught big eye tuna. In the absence of supplementary information, and assuming that the switch to deep longlining in 1983 was done to target big eye tuna, the analysis suggests that the outcome of P.T. Perikanan Samodra Besar fishing activities between 1983 and 1991were inconsistent with their objectives.
KEYWORDS: longline tuna fishery, deep longline, surface longline, Indian Ocean
INTRODUCTION
The Indonesian industrial longline tuna fishery commenced in the early 1960s (Simorangkir, 1982, Proctor et al., 2003) which was introduced by Japan in the 1930s (Ishida et al., 1994). In the 1930s, test fishing was conducted by Japanese longline vessels in Indonesian waters; however, the first commercial fishing did not occur until 1952 (Ishida et al., 1994). In 1972, a state owned company, P.T. Perikanan Samodra Besar (P.T. Perikanan Samodra Besar known as P.T. Perikanan Nusantara since 2007), was established (Marcille et al., 1984; Proctor et al., 2003) and has been collecting catch and effort data since 1973 (Marcille et al., 1984). P.T. Perikanan Samodra Besar is the oldest tuna fishing company that is still active (Pet-Soede & Ingles, 2008) and is the only fishing company, to our knowledge, that has kept a long term record of catch and effort data. Such that, the P.T. Perikanan Samodra Besar data are the longest time series of catch and effort data available from the Indonesian industrial longline fishery. Therefore, to understand the historical catch and effort trends of Indonesian commercial tuna longline fishery, the P.T. Perikanan Samodra Besar data are a valuable source.
Previous studies on the P.T. Perikanan Samodra Besar data set have been conducted by Marcille et al. (1984); Gafa et al. (2000); Eddrisea et al. (2008). Marcille et al. (1984) conducted analysis of the P.T. Perikanan Samodra Besar data collected between 1973-1981. P.T. Perikanan Samodra Besar vessels only used surface longlines during 1973-1981 (the period of Marcille et al.’s (1984) study), however, investigations into the number of hooks between floats have never been undertaken. Thus, in this paper, an investigation on how the P.T. Perikanan Samodra Besar fleet has been changing, in terms of fishing tactics and gear setting practices, as a response to their catch and their target species, was conducted, in order to determine to what extent the P.T. Perikanan Samodra Besar data can assist in quantifying the impact of the Indonesian tuna fishery on Indian Ocean tuna stocks.
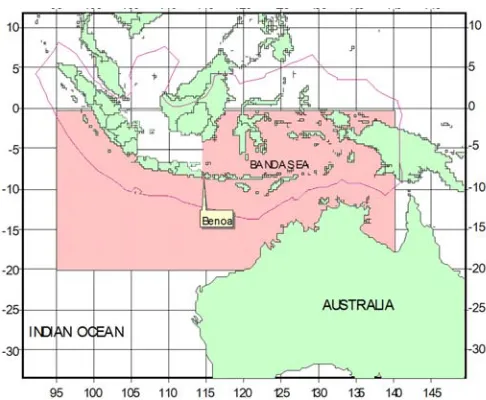
these were primarily data summaries with less emphasis on interpretation of the results. Both studies either summarised spatial and temporal catch and effort trends (including catch composition and catch per unit of effort) by gear type (deep vs surface longlines) (Gafa et al., 2000) or mapped (by 1-degree squares) the annual average catch, catch composition, catch per unit of effort, and effort data by gear types (deep vs surface longlines), by 5 years and by quarter (Eddrisea et al., 2008). The study conducted by Gafa et al. (2000) was limited to data corresponding to fishing operations in the Indian Ocean, and in the data up to 1995 P.T. Perikanan Samodra Besar vessels fished both the Indian Ocean and the Banda Sea. This paper attempted to interpret the spatial and temporal catch and effort trends (including those from the Banda Sea as well as those from the Indian Ocean) to the extent possible and to reconcile apparent changes in targeting practices against the actual catch.
MATERIALS AND METHODS
Data Overview
Historical catch and effort data collected by P.T. Perikanan Samodra Besar from its Benoa based longliners during 1978-1995 (noting that no data were available for 1986) were analysed. Additional data were collected post 1995; however, the post 1995 P.T. Perikanan Samodra Besar data are yet to be processed, as some skipper symbols still need to be translated. The lack of data in 1986 was associated with a lack of fishing activity by the P.T. Perikanan Samodra Besar vessels in the first nine months in
1986 (Simorangkir, 1988; Gafa et al., 2000) due to a fuel price increase (Gafa et al., 2000). The P.T. Perikanan Samodra Besar fleet recommenced fishing operations in October 1986 with only 5 (Gafa et al., 2000) or 6 of 22 vessels active (Simorangkir, 1988) for the last 3 months of that year. However, no effort data are available for those vessels during that period.
Within the data set, catch (number of fish) and effort information (including number of hooks, hooks between floats, number of baskets and setting position) were recorded for each set. Catch information was reported by species, including the four tuna species (big eye tuna, albacore, Thunnus alalunga, yellow fin tuna and southern bluefin tuna, Thunnus maccoyii), and the main bycatch species (i.e. black marlin, Makaira indica, Indo-Pacific blue marlin, Makaira mazara, striped marlin, Tetrapturus audax, swordfish, Xiphias gladius, Indo-Pacific sailfish, Istiophorus platypterus, white marlin, Makaira spp. and other marlin, Makaira spp.). No information is available on bait type or gear configuration (other than numbers of hooks and baskets).
Data Cleaning
From 35,687 recorded sets, 8.22% were excluded due to obvious errors regarding effort information (e.g. recording 1 hooks between floats). In addition, some records reported locations corresponding to land. The mistakes could have happened either during the recording process by the skippers, or during the data entry process. As the errors could not be corrected, these records were excluded from analysis.
116 sets incorrectly recorded hooks between floats and numbers of baskets under the opposite categories, i.e. the hooks between floats were recorded as more than 30 up to 140, whereas the numbers of baskets were recorded as between 9 and 18. These sets were corrected by swapping the data recorded for the hooks between floats and the numbers of baskets categories.
Exploratory Analysis
Catch and effort data were summed to obtain annual catch, effort, and catch per unit of effort trends. To generate spatial distributions of catch and effort, the data were aggregated by 5-degree squares.
Longline gear was arbitrarily classified based on the number of branch lines or hooks between floats (Suzuki et al., 1977; Marcille et al., 1984; Lee & Nishida, 2002; Lee et al., 2005), as the latter is considered an index of the maximum fishing depth (Bach et al., 2000; Ward & Hindmarsh, 2007). Note that the number of branch lines and hooks between floats are used interchangeably. Suzuki et al. (1977); Marcille et al. (1984) defined deep longlining as equating to at least 10 hooks between floats, and surface longlining as equating to 4-6 hooks between floats. Lee & Nishida (2002) classified deep longlining as 11d”HBFd”20 and surface (regular) longlining as 6d”HBFd”10. In addition, Lee & Nishida (2002) defined deep longlining as HBFe”11 and surface longlining as HBFd”10. A different longline classification was adopted by Gafa et al. (2000); & Eddrisea et al. (2008), where surface longlining was defined as 6 hooks between floats and deep longlining as 9d”HBFd”11 (Gafa et al., 2000) or surface longline as having HBF<6 and deep longline as having HBF>7 (Eddrisea et al., 2008). The classification of longline gear by Suzuki et al. (1977);Marcille et al. (1984) was used in that the surface gear classification was extended to include hooks between floats between 7 and 10. Thus, the classification of 10 or less hooks between floats for surface sets and more than 10 hooks between floats for deep longline sets was used to investigate what impact the change from surface to deep longlining
adopted by P.T. Perikanan Samodra Besar vessels had on catch composition and catch rate.
RESULTS AND DISCUSSION
Catch and Effort Trends
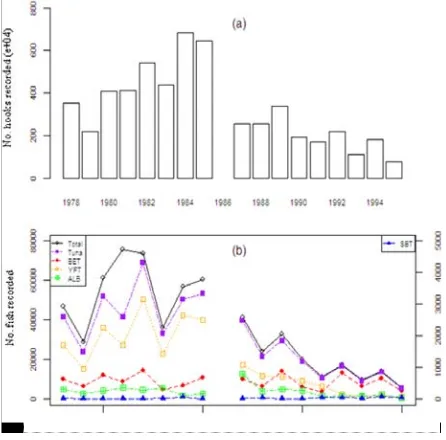
Annual effort, as described by the number of hooks, started to increase in 1982 from less than 6 million to a maximum of ~7 million hooks in 1984 (Figure 2a). This was followed by a small decrease in 1985 by about 5% of that in 1984. Since 1987, the reported effort dropped to less than half of that in 1985 (less than 4 million hooks per year) (recall that no hooks were reported in 1986).
The number of total fish reported decreased from more than 40,000 fish in 1978 to ~500 fish in 1995 (Figure 2b), however, there was a large increase in 1979 to a maximum level in 1981. Since 1990, the total fish recorded has never exceeded the lowest level observed between the late 1970s and 1980s (i.e. 20,000 fish per year).
In the period between 1978 and 1995, the annual temporal trend in the total number of tuna (big eye tuna, yellow fin tuna, albacore, and southern bluefin tuna) was consistent with that of the total catch, whereby tuna comprised at least 80% of the total fish reported (Figure 2b). The maximum number of tuna reported was in 1982, and this equated to 13% of all tuna caught during 1978-1995.
more than 80% of the total catch from 1992-1995. From 1978-1995, big eye tuna formed the minority of tuna catch (0.1% on average) (Figure 2b).
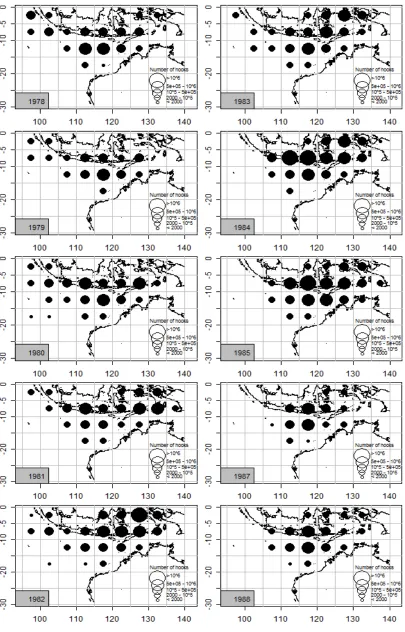
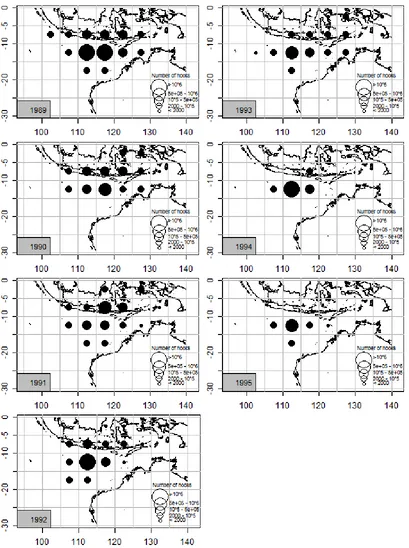
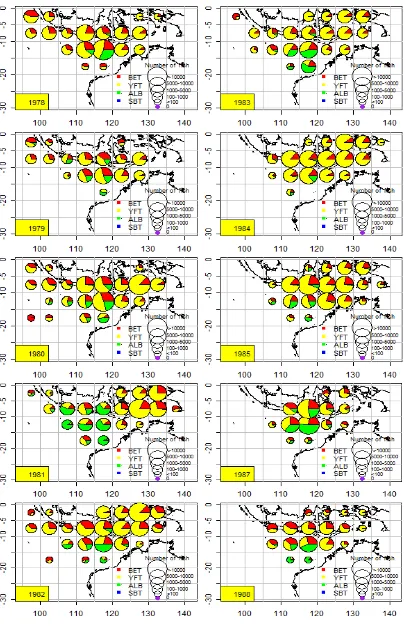
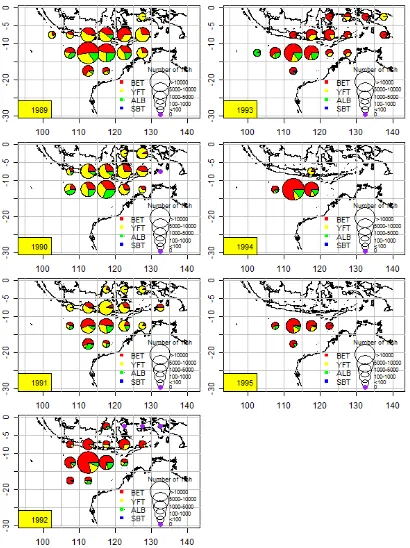
To further investigate any spatial changes associated with known changes in setting practices by P.T. Perikanan Samodra Besar vessels (from surface to deep setting), the P.T. Perikanan Samodra Besar spatial; effort and catch data were plotted by year (Figure 3 and 4). P.T. Perikanan Samodra Besar effort occurred in the range 0°-20° S and 95°-140° E in the 1980s (Figure 3). Consistent with the results of Marcille et al. (1984), the P.T. Perikanan Samodra Besar data showed that the majority of P.T. Perikanan Samodra Besar effort occurred in the Banda Sea in 1981. Fishing grounds remained predominantly in the Banda Sea until 1982. In 1987, P.T. Perikanan Samodra Besar effort began to decline (to 39% of that in 1985). From 1992, P.T. Perikanan Samodra Besar effort decreased further and became localised between 10°-15° S and 110°-115° E where limited fishing had previously occurred. This was consistent with the results of Eddrisea et al. (2008), who stated that P.T. Perikanan Samodra Besar effort occurred in smaller area between 0° and 20° S and between 105° and 135° E during this time. Prior to the 1990s, P.T. Perikanan Samodra Besar had experienced higher catches of yellow fin tuna in this area whereas big eye tuna were predominantly caught in the area between 0°-5° S, <105° E (Figure 4). In the 1990s, P.T. Perikanan Samodra Besar spatial catch composition showed that big eye tuna were the predominant species caught in any given 5-degree block.
Between 1978 and 1980, there was minimal spatial difference in the relative yellow fin tuna catch, as yellow fin tuna was the predominant catch species in almost all 5-degree squares (Figure 4). An exception was between 1984 and 1985, where yellow fin tuna again dominated the catch in all 5-degree areas, irrespective of latitude (Figure 4). From 1992, when effort was localised in the Indian Ocean south of 10° S, yellow fin tuna catch was less than a quarter of
the big eye tuna catch in almost all 5-degree blocks (Figure 4).
The relationship between catch and effort is summarised for total and species specific catch using linear regression (Figure 5). Within this data set, species specific effort was unable to be assigned. Annual total, tuna and yellow fin tuna catches were all significantly positively correlated with the aggregated number of hooks per year (r²>0.7, p<0.01) (Figure 5). In contrast, there was no significant linear correlation between big eye tuna, albacore, southern bluefin tuna, or bycatch, and effort (p>0.1). As only yellow fin tuna catch was significantly positively correlated with effort, this is consistent with the notion of yellow fin tuna being the main target species, whilst southern bluefin tuna had almost a negative correlation with effort, reflecting its very low catch levels and its status as a non target species.
Figure 4. Spatial distribution of tuna catch composition reported by the P.T. Perikanan Samodra Besar vessels.
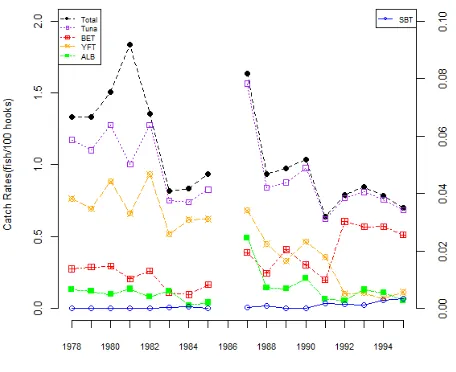
below 1 fish/100 hooks until 1985. Tuna catch per unit of efforts peaked above 1.5 fish/100 hooks in 1987 before dropping to less than 1 fish/100 hooks thereafter. Although the number of hooks increased from 1982-1985 (Figure 2a), nominal catch rates of total catch, tuna catch, yellow fin tuna, and big eye tuna decreased (from ~1.8 to ~1 fish/100 hooks, from ~1.3 to ~0.8 fish/100 hooks, from ~1 to 0.6 fish/100 hooks, and from ~0.3 to ~0.2 fish/100 hooks, respectively) (Figure 6).
Within the first eight years of the data set, the nominal yellow fin tuna catch per unit of efforts were much higher than (more than double) those of the other three tuna species (Figure 6). Between 1987 and 1991, yellow fin tuna catch per unit of efforts remained higher (except in 1989) than the other three tuna species. However, yellow fin tuna catch per unit of effort s subsequently decreased from ~0.7 fish/100 hooks in 1987 to ~0.1 fish/100 hooks in 1995 and even from 1992, big eye tuna catch per unit of efforts were at least three times higher than those for yellow fin tuna. These catch per unit of effort trends for yellow fin tuna and big eye tuna were consistent with results found by Gafa et al. (2000). This study showed inconsistent results with Gafa et al. (2000) in that
between 1978 and 1991 yellow fin tuna catch per unit of effort decreased and big eye tuna catch per unit of effort was relatively stable, respectively. In addition, this study showed a relatively constant trend between 1992 and 1995 for yellow fin tuna catch per unit of efforts, which was different from that suggested by Gafa et al. (2000). However, both analyses revealed a decreasing pattern for big eye tuna catch per unit of efforts between 1992 and 1995. The different results suggested by this study from that of Gafa et al. (2000) might be either due to different gear classification used or to different areas covered (Gafa et al.’s (2000) study was limited to P.T. Perikanan Samodra Besar data collected from the Indian Ocean).
Between 1978 and 1995, nominal catch per unit of efforts for yellow fin tuna and big eye tuna averaged around 0.49 and 0.32 fish/100 hooks, respectively (Figure 6). Compared to big eye tuna and yellow fin tuna, catch per unit of efforts between 1978 and 1995 were generally lower for albacore (0.13 fish/100 hooks on average), with the exception of a peak in 1987. Nominal catch per unit of efforts were consistently lowest for southern bluefin tuna, being less than 0.001 fish/100 hooks on average.
Total
Multiple R-squared: 0.7096, Adjusted R-squared: 0.6902, F-statistic: 36.65 on 1 and 15 DF, p-value: 2.207e-05
Tuna
Multiple R-squared: 0.7759, Adjusted R-squared: 0.761, F-statistic: 51.95 on 1 and 15 DF, p-value: 3.036e-06
BET
Multiple R-squared: 0.1287, Adjusted R-squared: 0.07062, F-statistic: 2.216 on 1 and 15 DF, p-value: 0.1573
YFT
Multiple R-squared: 0.8414, Adjusted R-squared: 0.8308, F-statistic: 79.57 on 1 and 15 DF, p-value: 2.197e-07
ALB
Multiple R-squared: 0.01939, Adjusted R-squared: -0.04599, F-statistic: 0.297 on 1 and 15 DF, p-value: 0.594
SBT
Multiple R-squared: 0.01722, Adjusted R-squared: -0.0483 F-statistic: 0.263 on 1 and 15 DF, p-value: 0.6157
Bycatch
Multiple R-squared: 0.1451, Adjusted R-squared: 0.0882 F-statistic: 2.547 on 1 and 15 DF, p-value: 0.1314
Figure 6. Time series of annual nominal catch per unit of effort (fish/100 hooks) for combined tuna catch and for the four main tuna species (big eye tuna, yellow fin tuna, albacore, and southern bluefin tuna).
Sources: This figure was presented in Sadiyah et al., 2011 (in prep.)
P.T. Perikanan Samodra Besar vessels devoted an increasing amount of effort to catching more yellow fin tuna by using surface longline gear with 6 branch lines (6 hooks) per basket between 1978-1982, which resulted in a larger amount of yellow fin tuna as well as overall tuna catch (peaking in 1982). Subsequently, in 1983 the P.T. Perikanan Samodra Besar vessels began to use deep longlines, 56% of the total sets in 1983. In 1984, the P.T. Perikanan Samodra Besar fleet tried to increase their effort and use more deep longliners (the proportion of the fleet using deep set gear increased to 63%) without any significant change in their fishing area. However, the increase in effort in 1984 resulted in reduced catch of both yellow fin tuna and big eye tuna compared to 1982. This indicates that further increases in effort were unlikely to have increased the nominal catch rates of big eye tuna and yellow fin tuna. In 1987, a large decrease in effort (total number of hooks deployed) by P.T. Perikanan Samodra Besar vessels occurred (effort declined to about 50% of that in 1985), and in subsequent years the number of hooks remained less than half of those in 1985. It seems that the P.T. Perikanan Samodra Besar vessels attempted to increase or at least recover
Yellow fin tuna were predominantly caught between 1978 and 1991 (except in 1989), suggesting the tuna catch pattern in these years was driven by yellow fin tuna. yellow fin tuna catch was most strongly correlated with P.T. Perikanan Samodra Besar effort, suggesting vessels were actively targeting yellow fin tuna. This is supported by higher nominal yellow fin tuna catch per unit of efforts during that period (except in 1989). However, from 1992, big eye tuna catch and nominal catch per unit of effort were higher than yellow fin tuna, albacore, and southern bluefin tuna. Catch and nominal catch per unit of effort were generally lower for albacore (except in 1987) and consistently the lowest for southern bluefin tuna.
Targeting Practices
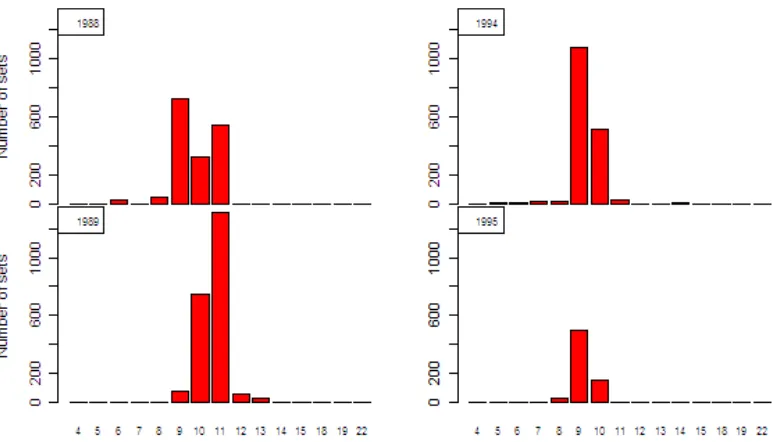
In terms of targeting, the P.T. Perikanan Samodra Besar data show that P.T. Perikanan Samodra Besar vessels used surface longline (6 hooks between floats) until 1982 and then switched to deep longlines in 1983 (presumably to target big eye tuna) by using 10 or more hooks between floats in about 56% of reported sets during 1983 (Figure 7). In contrast, Eddrisea et al. (2008) suggested that deep longline began before 1980 and Soepriyono (pers comm., 2006) indicated that P.T. Perikanan Samodra Besar started deep longlining in order to target big eye tuna in 1991. Prior to 1983, P.T. Perikanan Samodra Besar vessels only used 6 hooks between floats. In the next two years, the maximum number of hooks between floats was 11 hooks per basket (Figure 7). In 1987, the number of hooks between floats showed higher variability, from 5 hooks per basket (0.2% of the 1987 reported sets) to 18 hooks per basket (0.1% of the 1987 reported sets), with around 41% of the 1987 recorded sets using at least 10 hooks between floats. In the following years, the maximum number of hooks between floats never exceeded 13, whereas after 1992, the number of hooks between floats increased to more than 15.
have affected the big eye tuna and/or yellow fin tuna catch rates. From 1992, fishing grounds were predominantly located in the Indian Ocean (Figure 3) and big eye tuna was the dominant species caught during this time (Figure 6). However, the same area of the Indian Ocean had also been fished by deep longliners prior to 1992 and had resulted in higher nominal catch and catch per unit of effort of yellow fin tuna relative to big eye tuna. This indicates that the contraction of effort towards the Indian Ocean was not the only factor influencing catch composition. As there was a shortage of information on length of main line after 1991, assessing the effects of main line length on catch rates and composition prior to and from 1992 was not possible. Unfortunately, any information related to other gear modifications was not recorded within the P.T. Perikanan Samodra Besar data set, as there was no information on gear specification.
Figure 7. Frequency of P.T. Perikanan Samodra Besar sets by number of hooks per basket (hooks between floats), by year. Note that the period 1978-1982 is not illustrated as only 6 hooks between floats were used in these years.
CONCLUSION
P.T. Perikanan Samodra Besar data showed that P.T. Perikanan Samodra Besar vessels using 6 hooks between floats until 1982, which resulted in a larger amount of yellow fin tuna as well as overall tuna catch (peaking in 1982). Subsequently, in 1983 the P.T. Perikanan Samodra Besar vessels began to use deep longlines (56% of the total sets in 1983). However, big eye tuna catch per unit of efforts only increased from 1992. The increase in big eye tuna catch per unit of effort coincided with a reduced fishing range and concentration within an area where P.T. Perikanan Samodra Besar had not previously experienced high big eye tuna catches, as opposed to focusing their effort on areas where they had historically caught big eye tuna. In the absence of supplementary information, and assuming that the switch to deep longlining in 1983 was indeed done to target big eye tuna, the analysis suggests that the outcome of P.T. Perikanan Samodra Besar’s fishing activities between 1983 and 1991were inconsistent with their objectives.
ACKNOWLEDGEMENTS
The authors wish to thank Indonesia’s tuna fishing
for their funding through research collaboration in the project FIS/2002/074: Capacity development to monitor, analyse, and report on Indonesian tuna fisheries. In addition, I would like to thank Craig Proctor and Retno Andamari for their comments and suggestions. Last but not least, the Observer team, without whom this research would not have been possible, we are extremely grateful.
REFERENCES
Bach, P., L. Dagorn, & C. Misselis. 2000. The role of bait type on pelagic longline efficiency. ICES Annual Science Conference Theme Session J: Efficiency, Selectivity, and Impacts of Passive Gears. Brugge. Belgium. CM 2000/J:01.
Eddrisea, F., D. Nugroho, S. Fujiwara, K. Itoh, & T. Nishida. 2008. Atlas of Tuna Fisheries and Resources in Indonesia (Indian Ocean) OFCF Tuna Atlas Project in the IOTC Waters: Atlas Series No.2 Indonesia.
Ishida, K., T. Yamamoto, & B. Gafa. 1994. Development of Fisheries for Tuna and Tuna Like Fish in Indonesia with Particular Reference to the Jakarta-Based Tuna Longline Fishery. IPTP/94/ WP/26.
Lee, Y. C. & T. Nishida. 2002. Some Considerations to Separate Taiwanese Regular and Deep Longliners. Fourth Session of the IOTC Working Party on Tropical Tunas, Shanghai, People’s Republic of China, 3-11 June 2002. IOTC-2002-WPTT-19.
Lee, Y. C., T. Nishida, & M. Mohri. 2005. Separation of the Taiwanese regular and deep tuna longliners in the Indian Ocean using bigeye tuna catch ratios. Fisheries Science. 71: 1,256-1,263.
Marcille, J., T. Boely, M. Unar, I. G. S. Merta, B. Sadhotomo, & J. C. B. Uktolseja. 1984. Tuna Fishing in Indonesia, Paris, I’ORSTOM. Institute Francais de Recherche Scientifique Pour le Developpement en Cooperation.
Proctor, C. H., I. G. S. Merta, M. F. A. Sondita, R. I. Wahju, T. L. O. Davis, J. S. Gunn, & R. Andamari. 2003. A review of Indonesia’s Indian Ocean tuna fisheries. ACIAR Country Status Report. 106 pp.
Pet-Soede, L. & J. Ingles. 2008. Getting off the hook: reforming the tuna fisheries of Indonesia and considerations for ecosystem based management. WWF Report. 228 pp.
Suzuki, Z., Y. Warashina, & M. Kishida. 1977. The comparison of catches by regular and deep tuna
longline gears in the Western and Central Equatorial Pacific. Bull. Far Seas Fish. Res. Lab. 15: 51-89.
Skud, B. E. 1978. Factors affecting longline catch and effort: I. General review. Scientific Report No. 64. Seattle, Washington, International Pacific Halibut Commission.
Simorangkir, S. 1982. Perikanan tuna long line di Indonesia. In Simorangkir, S. (Ed.) Perikanan Indonesia. Bali, Indonesia, Bali Post. 17-28.
Simorangkir, S. 1988. Eksport ikan basah terobosan BUMN perikanan yang merugi. In Simorangkir, S. (Ed.) Perikanan Indonesia. Bali, Indonesia, Bali Post. 179-185.
Sadiyah, L., N. Dowling, B. I. Prisantoso, R. Andamari, C. Proctor, & L. A. Barmuta. 2011. Characterising Indonesia’s Indian Ocean Tuna Longline Fishery, Based on Newly Established Sources of Information. Manuscript sumbitted for publication.
Ward, P. & S. Hindmarsh. 2007. An overview of historical changes in the fishing gear and practices of pelagic longliners, with particular reference to Japan’s Pacific fleet. Reviews in Fish Biology and Fisheries. 17: 501-516.