Bird Flu Outbreak
Prediction via
Satellite Tracking
Yuanchun Zhou and Mingjie Tang, Chinese Academy of Sciences Weike Pan, Hong Kong Baptist University
Jinyan Li, University of Technology, Sydney
Weihang Wang, Jing Shao, Liang Wu, and Jianhui Li, Chinese Academy of Sciences Qiang Yang, Huawei Noah’s Ark Lab
Baoping Yan, Chinese Academy of Sciences
Converting wild bird
migratory paths into
graphs helps achieve
H5N1 outbreak
prediction. A mining
algorithm discovers
weighted closed
cliques in the graphs,
and a learning
algorithm then
predicts potential
H5N1 outbreaks.
algorithm HELEN-p then uses for accurate
H5N1 outbreak prediction.Background
The H5N1 virus outbreaks in poultry in 2003, 2004, and 2009 had an unprecedented
geographical impact in Asia.1–3 The H5N1
virus is a highly pathogenic avian influenza that has emerged in southern China in the mid-1990s. A large number of wild birds died as a result of the highly pathogenic virus in Qinghai Lake, China, in 2005. The number of protected bar-headed geese had decreased 5 to 10 percent worldwide due to the epizo-otic disease, as estimated in 2009.4
The spread of H5N1 is believed to be closely related to wild-bird migration across the globe.
However, effective tracking systems and data analysis tools have been lacking for a long time in China. The study on the relationship be-tween the spread of the H5N1 virus and the bird-migration network wasn’t conducted on a large scale. This situation is greatly improved now; we’ve collected about 1 million migra-tion records from March 2007 to December 2009 by using a satellite tracking system and special GPS devices that ecologists attached to birds (see Figure 1). The GPS devices continu-ously transmitted tracking signals to the satel-lite, and the US Geological Survey processing unit distributed the data to researchers.
Biologists found that bird migration routes in a small area are best viewed as graph
patterns like cliques5 rather than simple
A
vian bird flu has been an ongoing topic of international concern.
Here, we transform the bird-migration data analysis problem into
a high-weight closed clique mining problem, and we propose a novel,
High-wEight cLosed-cliquE miNing (HELEN) algorithm, which our prediction
role that migratory birds play in the ecology and transmission patterns of H5N1 by integrating data on habitats, seasonal movement chronology, routes, dates, and locations of H5N1 outbreak events. Recently, several studies have shown that H5N1 viruses in Qinghai Lake spread with the bird migration patterns.4 Most of these analyses were
conducted at a relatively coarse level of granularity (for example, between countries) and the methods for discov-ering the correlations of bird migration routes have limited predictive power.
Here, we mine the bird-movement pattern data and learn the relation-ship between graphical clique patterns and virus propagation. In particular, we use vertex weights to evaluate the seriousness of H5N1 virus transmis-sion. Weights are differently defined by using the degree of a habitat or vertex (the frequency that birds fly among hab-itats), the time that birds stay at a cer-tain habitat, or the density of the birds in a particular habitat. These weighted graph features can make the virus pre-diction model more accurate because we can use them to better estimate the cor-relations among the habitats. As a result, our prediction algorithm HELEN-p can help accurately predict future H5N1 outbreak from the migration graphs.
In our previous work, we analyzed bird virus outbreaks via mining bird mi-gration data such as sequence rule3 and
subgraph mining.6 In this article, we
fo-cus on how to predict future possible bird virus outbreak locations with ma-chine learning methods. Specifically, our prediction method is based on mined high-weight closed cliques,6 some newly
developed habitat correlation crite-ria, and two machine learning algo-rithms (k-nearest neighbor, or kNN, and Laplacian-based regularized
least-square, or LapRLS7). More
impor-tantly, with LapRLS we generalized the
idea of label propagation in manifold-based, semisupervised learning to H5N1 spreads in the bird migration network.
Algorithm
In this section, we first introduce the ba-sic concepts and principles of weighted graphs, and then describe the high-weight closed clique mining and H5N1 virus outbreak prediction algorithms.
Mining High-Weight Closed Cliques
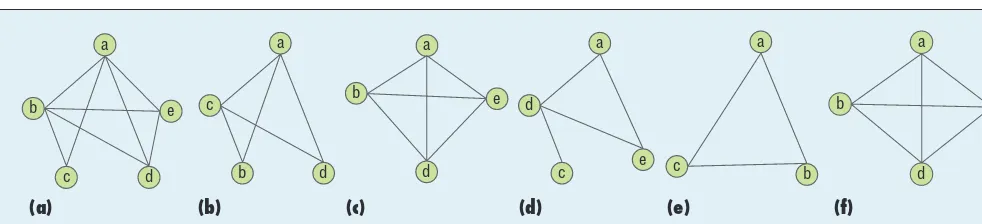
In our graph-based model, a bird habi-tat is denoted by a node (vertex) and a migration route is denoted by an edge. A clique C is a graph with fully connected edges. If a graph G contains a clique C, then G is said to be a support graph of C. For example, graph G1 in Figure 2 is
a support graph of clique C1= “abc.”
Definition 1. The frequency-support of a clique C is defined as the ratio of the number of support graphs over the total number of graphs in a database D,
supportf C G
I C G
( )
=⊆
(
)
∈
∑
DD ,
where
G∈ I C G
∑
(
⊆)
D is the number
of support graphs of clique C, and
|D| is the number of graphs in the
database.
Given a support threshold qf,
a clique C is a frequent clique if
supportf(C) ≥ qf. In addition, if there doesn’t exist another clique C′ satisfying C⊆C′ and supportf(C′) = supportf(C), C is a frequent closed clique. Closed cliques are impor-tant since they greatly reduce the number of child cliques with the same support level. Frequent-closed-clique mining finds all frequent closed cliques from a graph data-base. Given the graph database in
Figure 2 and qf = 0.5, “abc” and
“abde” are two frequent and closed cliques.
The weight of a vertex v is
de-noted by weight(v). We consider three weighting ideas in this work:
• Wfrequency, which measures how
fre-quently a bird flies among different habitats;
• Wtime = tarrive - tleave, which
A I A N D E P I D E M I O L O G Y
tleave are the bird’s arrival and
de-parture times; and
• Wdensity, which measures bird density in
the habitat, and is calculated by using the habitat’s area size divided by the number of migration records received by the satellite tracking system from that habitat.
The weight of a graph G is given by weight(G) =Σv∈Gweight(v).
Definition 2. The weight-support of a clique C is defined as a normalization term. Given a support threshold qw, a clique C is a high-weight-support clique if high-weight-supportw(C) ≥ qw. In addition, if no other clique C′ exists that satisfies C ⊆C′and supportw(C′) ≥ supportw(C), then C is a high-weight-support closed clique (HWCC). We wish to find all frequent and closed cliques from graph database D with respect to
the vertex weight. For example, given the graph database in Figure 2, we have supportw(“abc”) = (15 × 2)/(49 + 29 + 47 + 43) = 0.18, supportw(“abde”) = (47 × 2)/(49 + 29 + 47 + 43) = 0.56. If qw = 0.5, the clique “abde” is a high-weight closed clique.
Definition 3. The graph-weight-support of a clique C is defined as
support graphs of clique C in
data-base D, and the denominator G∈
∑
Dweight
( )
G is again for norma li zation. Given a support threshold qg, a cliqueC is a high-graph-weight-support
clique if supportg(C) ≥ qg. In addi-tion, if there doesn’t exist a clique C′ satisfying C ⊆ C′ and supportg(C′) = supportg(C), C is a high-graph-weight-support closed clique (HGWCC).
The downward-closure property (or anti-monotone property), which has been widely used to acceler-ate pattern-mining algorithms, stacceler-ates that any child pattern (for example, a subset of vertices) of a frequent pat-tern is also frequent. Hence, if no k- 1-patterns are frequent, we don’t need to explore k-patterns. However, we observe that the downward-closure property doesn’t hold true in HWCC mining. For example, in Figure 2, supportw(“abde”) = 0.56, supportw (“abd”) = 0.32. If we set the sup-port threshold qw= 0.5, then “abd” is a low-weight clique, while its
par-ent -graph “abde” is a high-weight
clique. So, this causes difficulties for mining algorithms. If it can be proved that if any k- 1-clique C[k-1]
isn’t a high-graph-weight-support clique, then k-clique C[k] isn’t either.
This downward-closure property is useful in the process of enumerating cliques. If we know that a k- 1-clique
C[k-1] isn’t a high-graph-weight-
support clique, there’s no need to enumerate any k-clique. It can be also proved that if qw= qg, then HWCC ⊆ HGWCC.
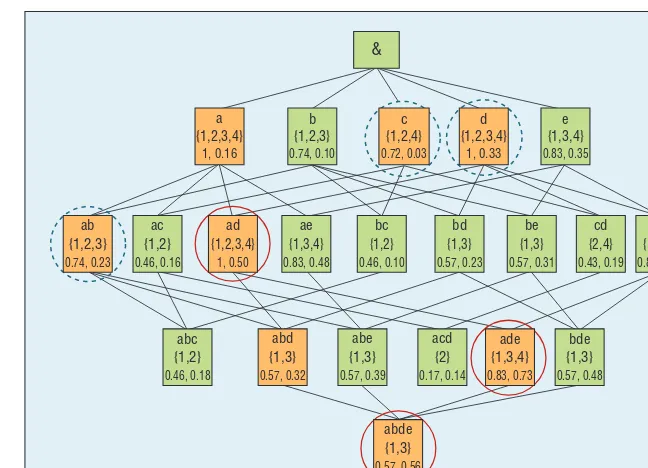
The main idea of the HELEN al-gorithm is to search over a clique lattice, as Figure 3 shows. The algo-rithm’s pseudocodes cover three ma-jor computational steps.
Input: Graph database D and
ver-tex weight, threshold qg and qw;
Output: HWCC.
1. Calculate the graph weight using
D and vertex weight.
2. Search the lattice and obtain
HGWCC using D, vertex weight,
and qg.
3. Check the HGWCC and obtain
HWCC using D, vertex weight,
and qw.
The mined HWCCs from the illus-tration data are marked with red circles in Figure 3.
Calculating Habitat Correlation
Our prediction method also involves two types of habitat correlations: location- and clique-based.
Definition 4. For any two habitats i and j, the location-based corre-lation is defined by the distance c
dij of the two habitats, calculated is a normalization term to make the correlation in the range of [0, 1].
We consider two types of distance in our correlation estimation:
• The Euclidean distance dijec=
(φi−φj)2+(λi−λj)2, where (fi, li) and (fj, lj) are the latitude and
longitude of habitats i and j,
respectively.
• The great-circle distance8 d
ij sin sin cos cos cos
φ λ
Definition 5. For any two habitats i and j, the clique-based correlation is defined by using the weighted supports of closed cliques to which i and j belong: notes the summation of the weighted support of the closed cliques to which the habitats i and j belong.
We take the following pseudocodes in the prediction of H5N1 virus outbreaks:
Input: Graph database D, vertex
weight, threshold qg and qw, positive instance p, number of predicted habi-tats k;
Output: A ranked list of k predicted habitats.
1. Call the HELEN algorithm to ob-tain HWCC.
2. Calculate the correlations of any two habitats according to Equations 3 or 4 using the mined HWCC. 3. Run the kNN or LapRLS algorithm
to find the top k likely outbreak habitats.
The problem setting of our predic-tion task is transductive learning rather than inductive learning, where the in-put includes one positive instance (that is, labeled training data), many un-labeled instances (that is, unun-labeled test data), and correlations among the instances. A common supervised machine learning method trains a pre-diction model using labeled training data only, for which one single positive instance (that is, training data in our problem) isn’t sufficient.
The two machine learning methods
kNN and LapRLS are explained as
follows. We hypothesize that a H5N1 outbreak is highly correlated with the migration network, which is reflected in the mined high-weight closed cliques. We verify this hypothesis in the experimental section later in the article. Given a habitat with an
H5N1 outbreak (Habitatp) and the
habitat correlation (cipec, cip
gc
, or cipw),
we can rank the remaining habitats
Figure 3. A clique lattice with the graphs from Figure 2. Each rectangle contains a clique (for example, “ab”), a corresponding set of graphs to which the clique belongs (for example, {1, 2, 3}), a graph-weight-support (for example, supportg(C) = 0.74 via Equation 2), and a weight-support (for example, supportw(C) = 0.23 via Equation 1). The rectangles in yellow denote the depth-first search space with qg = 0.5, and the search order is “a,” “ab,” “abd,” “abde,” “ad,” “ade,” “c,” and “d.” The rectangles with circles are high-graph-weight-support closed cliques with qg
= 0.5, among which the rectangles
with solid red circles are the final high-weight-support closed cliques with qw
A I A N D E P I D E M I O L O G Y
and obtain the top k habitats with the largest correlation based on the
kNN method. For example, if “a”
in Figure 3 is taken as a positive habitat, we have the ranking list of “d,” “e,” “b,” and “c” according to the correlations. We denote the corresponding HELEN-p variant as
HELEN-p(kNN).
Under a kernel-learning approach, we take the originating habitat of the H5N1 outbreak as a single posi-tive instance. We predict other out-break habitats by using the LapRLS method, where the normalized La-placian matrix L is calculated based
on a habitat correlation matrix W =cijw∈Rn n×,
L=I -D−1/2WD−1/2,
where D= diag(W1),
where I is an identity matrix and 1 is the vector with all entry values of 1.
Then, we apply the LapRLS objective function with a single positive instance,
min , Frobenius norm, and a is the tradeoff parameter. Hence, the final obtained score vector f can be used to rank the
remaining habitats and find the top k
habitats with the highest probability of an H5N1 outbreak. We denote the corresponding HELEN-p variant as HELEN-p(LapRLS).
Compared with the HELEN-p(kNN)
method, HELEN-p(LapRLS) has the potential of bridging two habitats be-yond k-nearest neighbors, because it can propagate the label via local connec-tions,7,9 which is also supported by our
experimental results.
Experiments
In this section, we first describe the real-world bird migration data and then show our mining and prediction results.
Data Collection
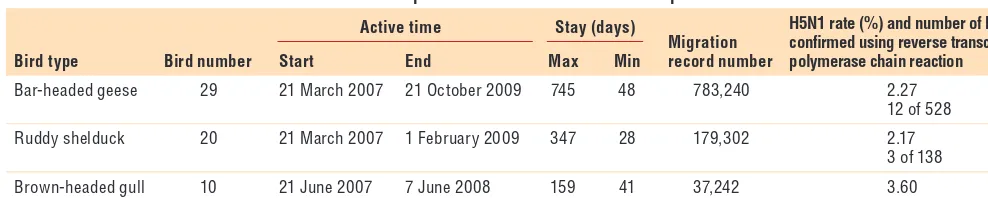
We conducted our on-site studies at the Qinghai Lake National Nature Reserve, Qinghai Province, China, between March 2007 and December 2009. Ecologists randomly captured 59 birds from different flocks and tied a battery-powered GPS device to each of them. Table 1 presents more details of the data. We collected nearly 1 mil-lion migration records of the 59 birds by 25 December 2009. We selected 29 bar-headed geese for our subsequent analysis of the same type of birds. The 29 bar-headed geese correspond to 29 graphs (one for each bird) in our algorithms, and each graph con-tains the same 103 nodes correspond-ing to 103 habitats.
We used the reverse transcrip-tion-polymerase chain reaction tech-nique (see www.who.int/influenza/ resources/documents/RecAIlabtest-sAug07.pdf) to confirm whether a bird is or isn’t infected with the vi-rus, and hence to determine the prev-alence of H5N1 in Qinghai Lake. We tested 1,055 samples (birds). The experiments confirmed that 12
bar-headed geese, three ruddy shel-ducks, and 14 brown-headed gulls are positive for an H5N1 subtype. These data are compared to the total numbers of birds of the three types (see the last column of Table 1), and it can be seen that the prevalence of H5N1 in Qinghai Lake was high. To obtain the relationship between mi-gratory birds and H5N1 outbreaks, we extracted information about H5N1 outbreaks from the Ministry of Agri-culture of the People’s Republic of China Database and the World Org-anization for Animal Health (OIE) Database for the period of February 2004 to May 2009.
Summary of Experimental Results
We conduct empirical studies of H5N1 outbreak analysis and prediction us-ing the mined cliques in the followus-ing two subsections.
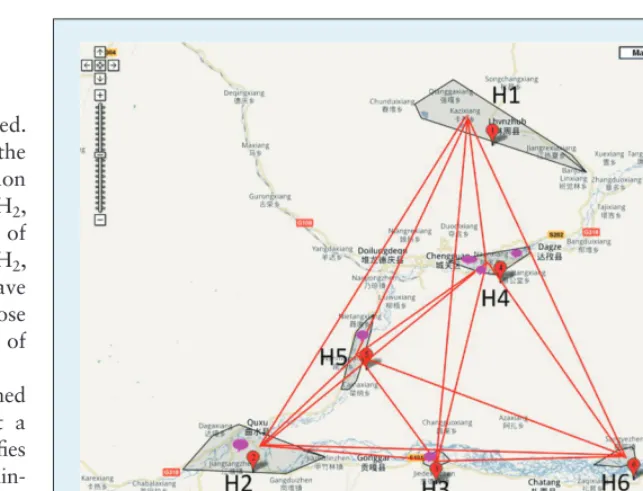
H5N1 outbreak analysis using mined cliques. We applied the HELEN algo rithm to those 29 graphs to extract cliques. Figure 4 shows one high-weight clique C15. If we only consider its
fre-quency support (supportf= 3/29), C
15
would be pruned. However, this clique has a weight of 0.13, 0.16, and 0.052, respectively, according to Wfrequency,
Wtime, and Wdensity weighting
strate-gies, and it contributes to more than 5.2 percent of the total time of the birds’ spring migration time. Table 2 shows that the migration network has a strong relationship with H5N1 outbreaks. For example, while birds prefer to stay at habitat 4 (H4), three Table 1. Description of the data used in the experiments.
Bird type Bird number
Active time Stay (days)
Migration record number
H5N1 rate (%) and number of birds confirmed using reverse transcription-polymerase chain reaction
Start End Max Min
Bar-headed geese 29 21 March 2007 21 October 2009 745 48 783,240 2.27
12 of 528
Ruddy shelduck 20 21 March 2007 1 February 2009 347 28 179,302 2.17
3 of 138
Brown-headed gull 10 21 June 2007 7 June 2008 159 41 37,242 3.60
habitat H4 has a strong correlation
with its neighboring habitats (H1, H2,
H3, and H5) under the high weight of
Wdensity. Interestingly, habitats (H2,
H3, and H5) are also reported to have
H5N1 outbreaks. The weight of those habitats does reflect the possibility of virus transmission.
A total of 24 percent of our mined cliques have a low frequency but a high weighted support. This magnifies the importance of weight clique min-ing, because otherwise, these low-frequency cliques would be pruned by the traditional frequent-closed-clique mining algorithms. High-weight closed-clique mining can help bio-logical professionals make better de-cisions, for example, by pointing out some high-weighted cliques. More mining results can be found at www. qinghailake.csdb.cn/qhlakesdm/page/ paper/link1.htm.
H5N1 outbreak prediction using mined cliques. Our algorithm mined 245 cliques from the 29 graphs and 103 habitats (qg = 0, qw= 0), where each clique has four different weights Wfrequency, Wtime, Wdensity, and
sup-portf. Among those 103 habitats, 16
had one or more cases of H5N1 out-breaks—that is, they’re positive habi-tats. In each prediction test, we take one positive habitat out of those 16 habitats, and report the averaged re-sults over the 16 times. To gain more insights on HWCC and the effect of
the support threshold qw, we first
study the prediction performance
when qw = 0, and then increase its
value gradually to 0.05, 0.1, and 0.15. Table 3 shows the prediction
re-sults when qw = 0. We can see two
important points: the approach of us-ing clique-based correlation is much better than that of using the habitats’ geometric information, confirming the
usefulness of the bird satellite track-ing system or migration network in habitat correlation estimation; and although the clique-based correlation might fail to build connections be-tween two habitats that never appear in any of the same cliques, as shown
by the results of HELEP-p(kNN),
HELEN-p(LapRLS) can complement this weakness via label propagation (or H5N1 spread). More empirical
stud-ies of HELEN-p(kNN) and
HELEN-p(LapRLS) can be found at www. qinghailake.csdb.cn/qhlakesdm/page/ paper/link3.htm, from which we can see that HELEN-p(LapRLS) improves the prediction performance and beats kNN in all cases.
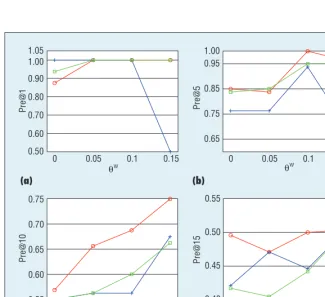
Figure 5 shows the prediction performance of HELEN-p(LapRLS)
with different values of qw. We can
see that using a relatively larger threshold improves prediction per-formance in most cases. This obser-vation can be explained by the fact that a reduction of noise in the clique weights can result in a better cor-relation estimation in Equation 4. However, using a too-large threshold could reduce the prediction perfor-mance, which makes sense because the correlation between two habitats might not appear when using too-few selected closed cliques. There-fore, we can conclude that using a relatively higher threshold is better
Figure 4. A mined high-weight closed clique, C15, with low frequency support (supportf
= 3/29).
Table 2. Detailed information of the habitats and weight of clique C15.
Habitat Wfrequency Wtime Wdensity Outbreak cases
H1 18 100 800 N/A
H2 34 140 130 1
H3 35 109 103 1
H4 31 173 270 3
H5 48 9 69 1
A I A N D E P I D E M I O L O G Y
in prediction, which supports our
assumption that H5N1 spreads via high-weight closed cliques.
I
n this article, we’ve developed anovel H5N1 outbreak prediction algorithm (HELEN-p) that makes use of the mined cliques and machine
learning methods. Our assumption that H5N1 spreads via high-weight closed cliques and frequent cliques is also supported by our experimen-tal results (see www.qinghailake. csdb.cn/qhlakesdm/page/paper/link1. htm and www.qinghailake.csdb.cn/ qhlakesdm/page/paper/link2.htm for more information). For future work,
we’ll explore more sophisticated algo-rithms to integrate different weighting strategies and contextual constraints.10
Some preliminary results using linear combinations have been obtained (see www.qinghailake.csdb.cn/qhlakesdm/ page/paper/link4.htm and www. qinghailake.csdb.cn/qhlakesdm/page/ paper/link5.htm).
Acknowledgments
We thank the Natural Science Foundation of China (grants 61003138 and 91224006) and the Strategic Priority Research Program of the Chinese Academy of Sciences (grants X-DA06010202 and XDA05050601) for their support. Qiang Yang thanks Hong Kong Research Grants Council (grants 621211 and 620812) for its support.
This paper is extended from our previous work.6 Jianhui Li is the corresponding
au-thor for this work.
References
1. H. Chen et al., “Avian Fu: H5N1 Virus Outbreak in Migratory Waterfowl,” Na-ture, vol. 436, July 2005, pp. 191–192. 2. J. Liu et al., “Highly Pathogenic H5N1
Influenza Virus Infection in Migratory Birds,” Science, vol. 309, no. 5738, 2005, p. 1206.
3. M. Tang et al., “Exploring the Wild Birds’ Migration Data for the Disease Spread Study of H5N1: A Clustering and Association Approach,” Knowledge and Information Systems, vol. 27, May 2011, pp. 227–251.
4. Z. Kou et al., “The Survey pf H5N1 Flu Virus in Wild Birds in 14 Provinces of China from 2004 to 2007,” PLOS ONE,
Table 3. The H5N1 outbreak prediction performance of the HELEN-p using habitat correlation estimated from geometric locations and migration data of the bird satellite tracking system.*
Evaluation metric
Geometric locations Using bird satellite tracking system
HELEN-p(kNN) HELEN-p(kNN), c
ij
w HELEN-p(LapRLS), c
ij w
cijgc cijec Wfrequency Wtime Wdensity supportf Wfrequency Wtime Wdensity supportf
Pre@1 0.13±0.34 0.31±0.48 0.63±0.50 0.56±0.51 0.63±0.50 0.63±0.50 0.88±0.34 1±0 0.94±0.25 0.88±0.34
Pre@5 0.10±0.13 0.20±0.18 0.58±0.28 0.56±0.26 0.56±0.28 0.56±0.23 0.85±0.27 0.76±0.08 0.84±0.13 0.85±0.15
Pre@10 0.15±0.09 0.15±0.12 0.44±0.13 0.45±0.12 0.45±0.12 0.44±0.13 0.57±0.05 0.55±0.05 0.55±0.05 0.56±0.05
Pre@15 0.14±0.08 0.14±0.08 0.37±0.09 0.38±0.09 0.37±0.09 0.35±0.08 0.50±0.04 0.42±0.03 0.42±0.03 0.48±0.04
* Note that Pre@k=#positive habitat k , threshold q
w = 0 and a = 1.
Figure 5. The H5N1 outbreak prediction performance of HELEN-p(LapRLS) with different values of pw on evaluation metrics (a) Pre@1, (b) Pre@5, (c) Pre@10, and (d) Pre@15.
0 0.05 0.1 0.15 0.50
0.60 0.70 0.80 0.90 1.00 1.05
θw
Pre@1
Wfrequency Wtime Wdensity
0 0.05 0.1 0.15 0.65
0.75 0.85 0.95 1.00
θw
Pre@5
0 0.05 0.1 0.15 0.55
0.60 0.65 0.70 0.75
θw
Pre@10
0 0.05 0.1 0.15 0.40
0.45 0.50 0.55
θw
Pre@15
(a) (b)
vol. 4, no. 9, 2009; doi:10.1371/journal. pone.0006926.
5. Y.-S. Hou et al., “Distribution and Diver-sity of Waterfowl Population in Qinghai Lake National Nature Reserve,” Acta Zootaxonomica Sinica, vol. 34, no. 1, 2009, pp. 184–187.
6. M. Tang et al., “Birds Bring Flues? Mining Frequent and High Weighted Cliques from Birds Migration Net-works,” Proc. 15th Int’l Conf. Database Systems for Advanced Applications, vol. 2, 2010, pp. 359–369.
7. M. Belkin P. Niyogi, and V. Sindhwani, “Manifold Regularization: A Geometric Framework for Learning from Labeled and Unlabeled Examples,” J. Machine Learning Research, vol. 7, Nov. 2006, pp. 2399–2434.
8. T. Vincenty, “Direct and Inverse Solu-tions of Geodesics on the Ellipsoid with Application of Nested Equations,”
Survey Review, vol. 23, no. 176, 1975, pp. 88–93.
9. X. Ling et al., “Spectral Domain-Transfer Learning,” Proc. 14th Ann. ACM SIG-KDD Int’l Conf. Knowledge Discovery and Data Mining, 2008, pp. 488–496. 10. Q. Yang, “A Theory of Conflict
Resolu-tion in Planning,” Artificial Intelligence, vol. 58, nos. 1–3, 1992, pp. 361–392.
at the Computer Network Information Center, Chinese Academy of Sciences. His research interests include bid data mining, cloud computing, and data-intensive computing. Zhou has a PhD in computer science from the Institute of Computing Technology, Chinese Acad-emy of Sciences. Contact him at [email protected].
Mingjie Tang is a graduate student at Purdue University. His research interests in-clude databases, Big Data analysis, and data mining. Tang has an MS in computer sci-ence from the Graduate University of Chinese Academy of Scisci-ences. Contact him at [email protected].
Weike Pan is a lecturer with the College of Computer Science and Software Engineer-ing, Shenzhen University. He’s also the information offi cer of ACM Transactions on In-telligent Systems and Technology. His research interests include transfer learning, recom-mender systems, and statistical machine learning. Pan has a PhD in computer science and engineering from the Hong Kong University of Science and Technology. Contact him at [email protected].
Jinyan Li is an associate professor and core member at Advanced Analytics Institute and Center for Health Technologies, Faculty of Engineering and IT, University of Technology, Sydney. His research interests include fundamental data mining algorithms, machine learn-ing, gene expression data analysis, structural bioinformatics, and information theory. Jinyan has a PhD in computer science from the University of Melbourne. Contact him at Jinyan. [email protected].
Weihang Wang is a PhD student at Purdue University. Her research interests include dis-tributed systems, cloud computing, and networks. Wang has an MS in computer science from the Graduate University of Chinese Academy of Sciences. Contact her at wang1315@ purdue.edu.
Jing Shao is an engineer at the Computer Network Information Center, Chinese Academy of Sciences. His research interests include moving object mining, Big Data mining, and data analysis. Shao has an MS in computer science from the Graduate University of Chinese Academy of Sciences. Contact him at [email protected].
Liang Wu is a master’s student at the Computer Network Information Center, Chinese Academy of Sciences. His research interests include data mining and machine learning. Wu has a BS in computer science from Beijing University of Posts and Telecommunications. Contact him at [email protected].
Jianhui Li is a professor at the Computer Network Information Center, Chinese Acad-emy of Sciences. His research interests include Big Data mining, large-scale distrib-uted database management and integration, semantic-based data integration, data-in-tensive computing, and scientific applications. Li has a PhD in computer science from the Institute of Computing Technology, Chinese Academy of Sciences. Contact him at [email protected].
Qiang Yang is the head of Huawei Noah’s Ark Lab, Hong Kong. He’s also a professor in the Department of Computer Science and Engineering, Hong Kong University of Sci-ence and Technology. His research interests include data mining and artifi cial intelligSci-ence. Yang has a PhD in computer science from the University of Maryland, College Park. His research teams won the 2004 and 2005 ACM KDD CUP competitions on data mining. He was the vice chair of ACM Sigart, the founding editor in chief of the ACM Transactions on Intelligent Systems and Technology, an AAAI Fellow, IEEE Fellow, International Associa-tion of Pattern RecogniAssocia-tion (IAPR) Fellow, and ACM Distinguished Scientist. Contact him at [email protected].
Baoping Yan is a professor and chief engineer at the Computer Network Information Cen-ter, Chinese Academy of Sciences. Her research interests include computer network sys-tems, industrial automation and CIMS (computer integrated manufacturing system) net-work technology, ATM-based net-workstation cluster systems, large-scale netnet-works and system integration, and Internet/intranet comprehensive information management systems. The Chinese government has granted her a special allowance for her outstanding contributions. Contact her at [email protected].