EFFECTS OF ORGANIC AND CHEMICAL FERTILIZER INPUTS ON BIOMASS
PRODUCTION AND CARBON DYNAMICS IN A MAIZE FARMING ON ULTISOLS
Maswar *) and Yoyo Soelaeman Indonesian Soil Research Institute
Jl. Tentara Pelajar No. 12, Cimanggu, Bogor 16114, West Java Indonesia *) Corresponding author E-mail: [email protected]
Received: June 24, 2015/ Accepted: April 22, 2016
ABSTRACT
An effort to increase the yield and reduce carbon loss from maize farming practices on Ultisols largely depend on fertilizer inputs and in situ crop residual management. The experiment aimed to estimate yields, biomass production and carbon dynamics of several management fertilization on maize farming practice on Ultisols has been conducted from March to July 2013 in Taman-bogo Experimental Farm, East Lampung. The experiment was set up as a randomized complete blockdesign, consisted of 6 treatments namely: 5 t ha-1 of cattle manure, 5 t ha-1 of dried sludge manure, and its combination with 200 kg urea ha-1 + 125 kg SP36 ha-1 + 50 kg KCl ha-1 (50% of recommended dose of inorganic fertilizers “RDIF”) and 75% of RDIF. The experimental results revealed that application of combined organic with inorganic fertilizers increased the biomass production, carbon fixation, and grain yield signi-ficantly. More than 50% of produced biomass and fixed carbon (grain, maize cob, maize husk, stems and leaves) were removed from maize farming. The use of organic fertilizer combined with NPK fertilizer at 50% of RDIF can be applied to increase the biomass production, organic carbon fixation and maize grain yield in sustain-able ways.
Keywords: biomass; carbon; fertilizer; maize INTRODUCTION
Ultisols belongs to the largest area of marginal soil in Indonesia and cover about 45.8 million hectares or 25% of land area of Indonesia (Subagyo et al., 2004), and has a great potential for maize intensification or extensification. Unfortunately, the main constraints of Ultisols for maize farming was low in soil pH (acidic),
nutrients content, organic matter and cation exchange capacity as a presence of high in aluminium (Al), iron (Fe) and manganese (Mn) content (Adiningsih and Sudjadi, 1993; Soepardi, 2001; Fageria and Baligar, 2008; ISRI, 2012). A high in Al and/or Fe concentration causes to the high P fixation so that the P nutrient in the soil was unavailable for crops growth (Widjaja-Adhi, 1985; Singh et al., 2003).
Kasryno and Haryono (2012) suggest that the upland farming in Indonesia was dominated by food crops with the use of fertilizers that tend to be higher. The intensive use of high level of inorganic fertilizers has led to soil degradation, environmental pollution and the levelling of crop productivity. According to Sharma and Mitra (1991) the use of inorganic fertilizer alone is not helpful under intensive agriculture because it aggravates soil degradation. Therefore, combination of inor-ganic fertilizers with lime and orinor-ganic fertilizer application in Ultisols have been recognized and used as the main practice for ameliorating strong acidity which curtails the availability of nutrients required at high amounts in soils for maximum yields (Fageria and Baligar, 2008; Ayodele and Shittu, 2014).
Leaving crops residue on the soil surface after planting gives benefits to prevent the “mud
splash” during a rain storm, and to reduce the water run off. In addition, by returning of crops residue sand manure into the soil may reduce the inorganic fertilizer use and to reduce the production cost. Indeed, even when all crop residues are returned, the biomass input into soil ecosystem can be still insufficiently due to soil erosion and SOM mineralization (Mann et al., 2002). Whereas, removing crops residue can negatively impacts to soil physical, chemical and biological properties. According to Karlen et al. (1994), 10 years of crops residue removal under no-till continuous corn resulted in deleterious Cite this as: Maswar and Y. Soelaeman. 2016. Effects of organic and chemical fertilizer inputs on biomass production and carbon dynamics in a maize farming on ultisols. AGRIVITA Journal of Agricultural Science. 38(2): 133-141. Doi: 10.17503/agrivita.v38i2.594
Accredited : SK No. 81/DIKTI/Kep/2011
changes in many biological indicators of soil quality, including lower soil carbon, microbial activity, fungal biomass and earth worm popula-tions compared to normal or double rates of residue return.
Although the upland Ultisols has several problems but the land productivity can be im-proved if the soil organic matters can be maintained and increased through application of manures and/or by returned back of crops residues into the soil. Soil organic matter, as the product of on-site biomass decomposition affects the chemical, physical and biological properties of the soil and its overall health. Organic matter affect the soil structure and porosity, the water infiltration rate, and moisture holding capacity of soils, the diversity and biological activity of soil organisms, and plant nutrient availability (Bot and Benites, 2005). Decomposition of organic material can also supply the macro and micro nutrients and has the ability to improve the efficiency of fertilizers and water used by plant and reducing the dose of inorganic fertilizer.
The objective of the study was to determine the amount and distribution of produces biomass and fixed carbon in maize crops and to calculate the possible returning of carbon to the soil ecosystem in managing the soil carbon of Ultisols in sustainable ways.
MATERIALS AND METHODS
A field study was conducted from March to July 2013 at the Tamanbogo Experimental Farm. The site is located at East Lampung District, Lampung Province (N 05000’ 16,4” S and E 1050
29’ 23,1”), at an altitude of about 300 m above sea levels, it belongs to C2 type climate (Oldeman et al., 1979) with 5-6 of wet months and 2-3 of dry months. The main characteristic of soil chemical properties were low in pH, N, K2O, P2O5, soil organic C and cation exchangeable capacity (CEC). The physical properties criterion of the soil was high in soil bulk density (BD), low in total pores space, permeability and available water.
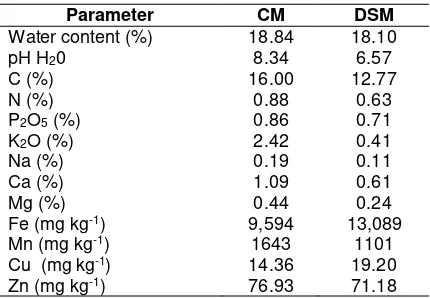
The experiment was set up as randomized block design, consisted of 6 treatments and provided with four replications. Those treatment were as follows: T1 = 5 t ha-1 of cattle manure processing because the DSM that originally comes out from the biogas digester outlet has been decomposed perfectly. It also produced CH4, CO2, N, CO, O, hydrogensulfide, ammonia and nitrogen oxides, so that the C and nutrient content of the DSM were lower (Table 1).
Table 1. Chemical composition of cattle manure and dried sludge manure
Remarks: Soil Chemical Laboratory of Indonesian Soil Research Institute, year 2013
The unit of plot size was 4 m x 5 m and the treatments were randomly distributed to the plot. Cattle manure (CM) and also DSM were mixed with soil taken from the plot and it was spread evenly on the plots and lightly mixed with the soil using hoe a day before planting. The inorganic fertilizer was applied two times, one third dose of Urea and full dose of SP36 and KCl fertilizers were drilled into the hole at 5 cm distance from the seed at planting time and covered with the soil to avoid contact of the seed with the fertilizers. The remaining part of urea fertilizer (2/3 part) was applied on 30th day after planting.
75 cm x 25 cm, 2 seeds hole-1. The plant was thined to 1 plant hole-1 at 1 week old so that the total population was 100 plants plot-1 or or 50,000 plants ha-1. Weeding, thinning, irrigation and pesticide applications were done as and when necessary.
The maize plants were harvested at 110 days after planting and the data of biomass and carbon weight were collected and calculated based on the weight of 5 crop samples for each plots of the treatments. All the samples of fresh maize biomass were separated into the roots, stalks, grains, leaves, cobs and husks and it was weighed separately.
The water content of biomass was determined by heating the sample in an oven at a temperature of 70oC for 48 hours. The dry weight of the biomass was calculated using the formula:
DW s
Total DW = --- x Total FW s…..(Equation 1) FW s
Where:
DW = dry weight
DW s = dry weight of the sample FW s = fresh weight of the sample
Organic matter content of the biomass was determined by the method of Loss on Ignition (LOI) (Nelson and Sommer, 1996), i.e. by burning off about 2 grams of oven DW sample in the oven furnace at a temperature of 550oC for 6 hours. Sample weight lost during the combustion process is the amount of organic matter contained in the biomass materials, which was calculated by the formula:
W100oC–W550oC
% OM = --- x 100% ……(Equation 2) W100oC
Where:
OM = organic matter content is assumed equal to LOI
W100oC = weight of biomass after heatingat 100oC
W550oC = the remaining weight of biomass after ignition at 550oC
To convert the percentage of organic matter (OM) into the percentage of carbon in the biomass materials from the LOI method was calculated by the formula:
1
% C = --- x % OM …………..….(Equation 3) 1.724
Where:
% C = carbon contents in the biomass % OM = the percentage of biomass lost in the
process of LOI
1.724 = conversion factor to convert the percentage of organic material into the percentage of organic C based on the assumption that the organic material contain 58% organic C (Nelson and Sommers, 1996; Pribyl, 2010).
The total carbon stored in the biomass was calculated by the formula:
Total C = % C x total DW of the biomass………..
……….………...(Equation 4)
The weight of each part of maize biomass and carbon were statistically analyzed using the SAS System for Linear Models (Littell et al., 1991) and the weight of biomass and carbon that was returned back into the soil and moved out from the farm was calculated according to the farmers habitual in maize farming.
RESULTS AND DISCUSSION
Table 2. Dry weight of harvested biomass as affected by organic fertilizers at different dose of inorganic fertilizers
Treatment (t haRoots -1)
Stalks (t ha-1)
Leaves (t ha-1)
Cobs (t ha-1)
Husks (t ha-1)
Grains (t ha-1)
Total biomass (t ha-1)
T1 0.23 b 0.39 b 0.36 b 0.25 b 0.19 b 1.34 b 2.77 b T2 0.18 b 0.34 b 0.37 b 0.24 b 0.17 b 1.15 b 2.46 b T3 0.69 a 1.29 a 1.02 a 0.93 a 0.69 a 3.69 a 8.31 a T4 0.66 a 1.15 a 1.14 a 0.99 a 0.79 a 3.88 a 8.61 a T5 0.71 a 1.10 a 1.06 a 0.92 a 0.79 a 4.10 a 8.68 a T6 0.73 a 1.09 a 0.98 a 0.99 a 0.91 a 3.85 a 8.56 a
Remarks: Mean followed by the same letter at the same columns is not significantly different (P < 0.05)
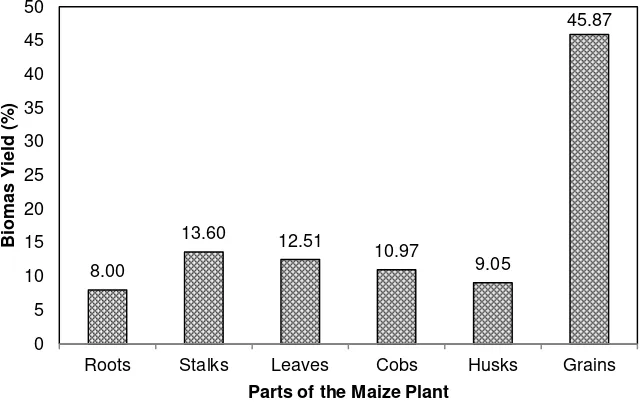
Figure 1. Distribution of maize biomass yields of treated plot with CM and DSM at different dosage of inorganic fertilizers accompanied with 50-75% of RDIF at Tamanbogo Experimental Farm, East Lampung (n = 120 plants)
Cattle manure (CM) and DSM application accompanied by NPK fertilizers at dose of 50 and 75% of RDIF (T3, T4, T5 and T6) could increase the weight of each parts of maize plants and the total biomass significantly (Table 2), so that the total weight of biomass increased from 2.46-2.77 t ha-1 to 8.31-8.68 t ha-1. There were no significant differences weight of each part of maize crop and the total biomass between the treatment of 50% of RDIF and 75% of RDIF (T3, T4, T5 and T6). These results indicated that the optimal biomass yield with minimum input of inorganic fertilizers were gained by the combination of CM or DSM with 50% of RDIF (T3 and T5), e.i. 8.31 t ha-1 and 8.68 t ha-1. Although between the treatments of T and T were not significantly different, the
(2010) mentions that the DSM is a high quality organic fertilizer since the chemical forms of N and P in residue are easier to be utilized by plants in short time than those in other manure management system, such as CM which is produced b y dry decomposition process.
Dry weight distribution of P27 biomass yields that was treated with 5 t ha-1 of organic fertilizers (CM and DSM) along with inorganic fertilizer (NPK) at a dose of 50-75% of RDIF showed proportional variation in each part of the plant (Figure 1). Most of the maize biomass was accumulated in the grains (45.87%), while the rest were spread almost evenly on the roots (8.00%), stalks (13.60%), leaves (12.51%), cob (10.97%) and husk (9.05%).
8.00
13.60 12.51
10.97
9.05
45.87
0 5 10 15 20 25 30 35 40 45 50
Roots Stalks Leaves Cobs Husks Grains
Biom
a
s
Yie
ld
(%
)
Carbon Fixation
The percentage of ash and carbon on each part of P 27 maize biomass (Table 3) was calculated by the formula of equation 2 and equation 3. It showed that the highest concen-tration of ash in the maize biomass was in the roots and leaves (11.04% and 12.72%, respec-tively), but only a small proportion are in the maize grains, stalks, cobs and husk. Based on the data of ash (% ash) and carbon (% C) content can be calculated the amount of carbon fixation in the crop biomass by multiplying the biomass dry weight with carbon percentage (% C) as mentioned on equation 4.
Table 3. The ash and carbon content of harvested maize part
Parts of Maize Crop Ash (%) C (%)
Roots 11.04 51.60
Stalks 3.87 55.76
Grains 1.51 57.13
Leaves 12.72 50.63
Cobs 1.9 56.90
Husks 3.49 55.98
The carbon fixation in each part of maize biomass and the total carbon fixed by P27 maize in each treatment (Table 4) showed that the combination of CM or DSM with 50% and 75% of RDIF were significantly increased the fixation of carbon in the biomass compared to the using CM or DSM only.
There was no significant increase in carbon fixation between application of CM and DSM with 50% of RDIF and 75% of RDIF. The research results indicated that the best carbon fixation with the use of lower dosage of inorganic
fertilizers was achieved in the treatment of CM or DSM at a dose of 5 t ha-1 along with inorganic fertilizers at a dose of 50% of RDIF. The amount of carbon fixation was in line with the weight of maize biomass that has been shown in Table 2.
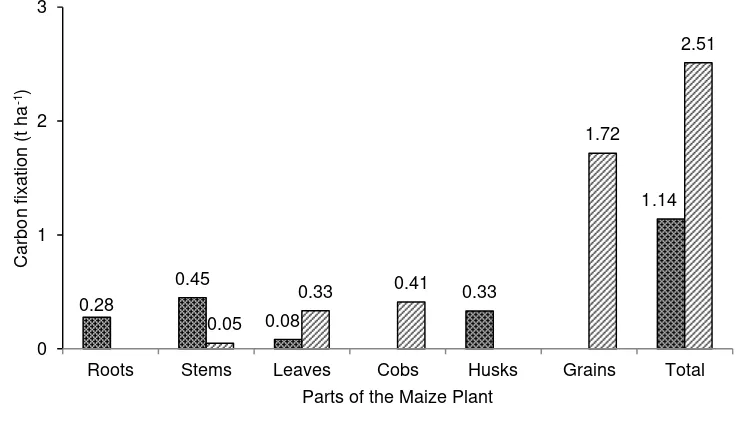
Figure 2 indicated that the distribution of carbon fixation in the P27 maize biomass is in line with the maize biomass weight distribution as has been shown in Figure 1. The majority of carbon in the P27 maize biomass accumulated in the grains (47.07%) while the rests are spread almost evenly on the other parts of maize plant such as on the maize roots (7.59%), on the stalks (13.67%), on the leaves (11.43%), on the cobs (11.29%) and on the husk (9.10%).
Carbon Balance of Maize Farming
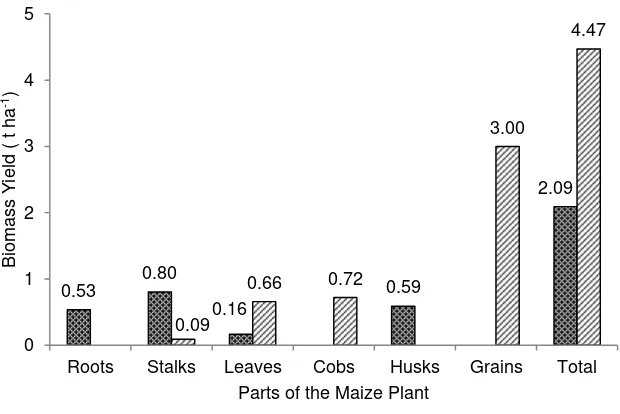
Figure 3 showed that the maize stalk was the largest biomass returned back to the soil while the grain was the largest biomass moved out from the farm. All of the roots (0.53 t ha-1), maize husks (0.59 t ha-1), 90% of the stalks and 20% of the leaves were returned back into the soil.
All parts of maize grains and cobs were move out from the farm. The grains were sold to obtain income and the cobs were used as firewood in cooking or burned at farm yards garden. As many as 10% of the maize stalks and 80% maize leaves were cut before harvest and brought from the land for animal feed (fodder). The cage of ruminants/cattle shed was generally located beside the farmhouse, while the farmland was located relatively far from the farmhouse. Therefore, the manure produced was generally used to manage the farm yards garden.
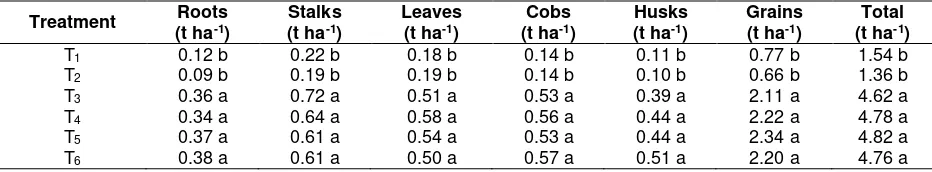
Table 4. The carbon fixation in plant biomass as affected by organic fertilizers at different dosage of inorganic fertilizers
Treatment (t haRoots -1)
Stalks (t ha-1)
Leaves (t ha-1)
Cobs (t ha-1)
Husks (t ha-1)
Grains (t ha-1)
Total (t ha-1)
T1 0.12 b 0.22 b 0.18 b 0.14 b 0.11 b 0.77 b 1.54 b T2 0.09 b 0.19 b 0.19 b 0.14 b 0.10 b 0.66 b 1.36 b T3 0.36 a 0.72 a 0.51 a 0.53 a 0.39 a 2.11 a 4.62 a T4 0.34 a 0.64 a 0.58 a 0.56 a 0.44 a 2.22 a 4.78 a T5 0.37 a 0.61 a 0.54 a 0.53 a 0.44 a 2.34 a 4.82 a T6 0.38 a 0.61 a 0.50 a 0.57 a 0.51 a 2.20 a 4.76 a
Figure 2. Average distribution of fixed carbon of treated plot with CM and DSM at different dosage of inorganic fertilizers accompanied with 50-75% of RDIF at Tamanbogo Experimental Farm, East Lampung (n = 120 plants)
Figure 3. Biomass recycling and removal of maize cultivation at Tamanbogo Experimental Farm, East Lampung District
7.59
13.67
11.43 11.29
9.10
47.07
0 5 10 15 20 25 30 35 40 45 50
Roots Stalks Leaves Cobs Husks Grains
Carbo
n
Fi
x
a
tio
n
(%
)
Parts of the Maize Plant
0.53 0.80
0.16
0.59
2.09
0.09
0.66 0.72
3.00
4.47
0 1 2 3 4 5
Roots Stalks Leaves Cobs Husks Grains Total
Bi
o
m
a
s
s
Y
ie
ld
(
t
h
a
-1)
Parts of the Maize Plant
Figure 4. The balance between recycled and removed of carbon in maize soil in Tamanbogo Experimental Farm, East Lampung District
Pioneer 27 produced as much as 6.56 t ha-1 of biomass, but only 31.9% (2.09 t ha-1) were returned back to the soil and as much as 68.1% (4.47 t ha-1) moved out from the farm (Figure 3). It indicates that the majority of the harvest residue were not returned back into the soil to main-tain/improve soil productivity. Cattle manure (CM) treatment with a dose of 5 t ha-1 + 50% of RDIF (T3) and DSM with a dose of 5 t ha-1 + 50% of RDIF (T5) gave the highest grains yield that were 3.69 t ha-1 and 4.10 t ha-1 respectivelly, but more than 50% of biomass produced was brough out from the farm.
The research results of carbon fixation by P27 in Figure 4 showed that as many as 31.27% of the carbon produced in P27 maize biomass was returned back to the soil, while the remaining parts of 68.73% was moved out from the farm. It means that the farm management carried out by the farmers in East Lampung District is not an efficient carbon farming system.
CONCLUSION AND SUGGESTION
The combination of CM or DSM with 50% and 75% of RDIF were significantly increased the total maize biomass and carbon fixation
compared to the using of CM or DSM only. The application of CM or DSM in combination with minimum input of inorganic fertilizer (50% of RDIF) gave the best total maize biomass (8.31 t ha-1 and 8.68 t ha-1) and fixed carbon (4.62 t ha-1 and 4.82 t ha-1). Most of the maize biomass (45.87%) and carbon (47.07%) were accumulated in the grains while the rest were spread almost evenly on the roots, stalks, leaves, cob and husk. The highest concentration of ash in the maize biomass was in the roots and leaves (11.04% and 12.72%, respectively), but only small proportions were in the maize grains, stalks, cobs and husk.
The P27 produced as much as 6.56 t ha-1 of biomass, but only 31.9% (2.09 t ha-1) were returned back to the soil and as much as 68.1% (4.47 t ha-1) moved out from the farm.The maize stalk was the largest biomass returned back to the soil while the grain was the largest biomass moved out from the farm. Most of the biomass and carbon were removed from maize farming system and it indicated that carbon balance in maize farming in Lampung was not manage efficiently. Returning crops residue or manure into the soil may reduce the chemical fertilizer use and allow the small farmers minimize their production cost.
0.28
0.45
0.08
0.33
1.14
0.05
0.33 0.41
1.72
2.51
0 1 2 3
Roots Stems Leaves Cobs Husks Grains Total
Carb
o
n
fi
x
a
ti
o
n
(t
h
a
-1)
Parts of the Maize Plant
ACKNOWLEDGMENT
The authors would like to thank God for making all of this possible, and families for un-limited supply of unconditional support. The au-thors express deepest gratitude to the Indonesian Soil Research Institute that has provided research funding through APBN of fiscal year 2013. Many thanks were also delivered to Mr. Subandi for good cooperation in the procces of data collection.
REFERENCES
Adiningsih, J.S. and M. Sudjadi. 1993. Role of alley cropping in increasing soil fertility of acidic arid soils (in Indonesian). Proceed-ings of the Soil and Agroclimate Seminar. Bogor: Indonesian Soil and Agro-climate Research Center.
Ayodele, O.J. and O.S. Shittu. 2014. Fertilizer, lime and manure amendments for ultisols formed on coastal plain sands of southern Nigeria. Agriculture, Forestry and Fisheries 3 (6): 481-488. doi: 10.11648/j.aff.2014 0306.1
Bot, A. and J. Benites. 2005. The importance of soil organic matter: Key to drought-resistant soil and sustained food and production. FAO Soils Bulletin 80. p. 95. Fageria, N.K. and V.C. Baligar. 2008. Chapter 7:
Ameliorating soil acidity of tropical oxisols by liming for sustainable crop production. Advances in Agronomy 99: 345-399. doi: 10.1016/S0065-2113(08)00407-0 Guo, L.G. 2010. Potential of biogas production
from livestock manure in China: GHG emission abatement from manure-biogas-digestate system. Master’s Thesis. Depar-tment of Energy and Environment, Division of Energy Technology. Göteborg: Chal-mers University of Technology. p. 96. ISRI. 2012. Annual report 2012: Soil
manage-ment research based on carbon efficiency to support land and crops productivity (in Indonesian). Indonesian Soil Research Institute. Bogor: Indonesian Center for Agricul-tural Land Resources Research and De-velopment.
Karlen, D.L., N.C. Wollenhaupt, D.C. Erbach, E.C. Berry, J.B. Swan, N.S. Eash and J.L. Jordahl. 1994. Crop residue effects on soil quality following 10-years of no-till corn. Soil and Tillage Research 31 (2-3): 149-167. doi: 10.1016/0167-1987(94) 90077-9
Kasryno, F. and H. Soeparno. 2012. Dryland agriculture as a solution to achieve future food independence (in Indonesian). In: Prospects of dryland agriculture to support food security. Jakarta: Indonesian Agency for Agricultural Research and Develop-ment. pp. 11-34.
Littell, R.C., R.J. Freund and P.C. Spector. 1991. SAS system for linear models, Third Edition: SAS series in statistical applica-tions. North Carolina: SAS Institute. p. 352.
Mann, L., V. Tolbert and J. Cushman. 2002. Potential environmental effects of corn (Zea mays L.) stover removal with emphasis on soil organic matter and erosion. Agriculture, Ecosystems and Environment 89 (3): 149-166. doi: 10. 1016/S0167-8809(01)00166-9
Nelson, D.W. and L.E. Sommers. 1996. Total carbon, organic carbon, and organic matter. In: Methods of soil analysis. Part 3 - Chemical methods. D.L. Sparks, A.L. Page, P.A. Helmke, R.H. Loeppert, P.N. Soltanpour, M.A. Tabatabai, C.T. John-ston and M.E. Sumner (eds.). Madison: Soil Science Society of America. pp. 961-1010.
Oldeman, L.R., I. Las and R.N. Darwis. 1979. An agroclimatic map of Sumatra. Bogor: Central Research Institute for Agriculture. p. 35.
Pribyl, D.W. 2010. A critical review of the conventional SOC to SOM conversion factor. Geoderma 156 (3-4): 75-83. doi: 10.1016/j.geoderma.2010.02.003 Sharma, A.R. and B.N. Mittra. 1991. Effect of
Singh, U., P.W. Wilkens, J. Henao, S.H. Chien, D.T. Hellums and L.L. Hammond. 2003. An expert system for estimating agronomic effectiveness of freshly applied phosphate rock. In: Direct application of phosphate rock and related appropriate technology - latest developments and practical experiences. S.S. Rajan and S.H. Chien (eds.). Proceedings of an International Meeting, July 16-20, 2001. Kuala Lumpur. pp. 214-224.
Soepardi, G.H. 2001. Agribusiness farming strategy based on land resources (in Indonesian). Proceedings of the National Land Re-source Management and Fertilizer, Book I. October 30-31, 2001. Bogor: Indonesian
Agency for Agricultural Research and Develop-ment. p. 35-52.
Subagyo, H., N. Suharta and A.B. Siswanto. 2004. Agricultural lands in Indonesia (in Indonesian). In: Indonesia’s land resources and their management. A. Adimihardja, L.I. Amien, F. Agus and D. Djaenudin (eds.). Bogor: Indonesian Center of Soil and Agro-climate Research and Develop-ment. p. 21-66.