* Corresponding author. e-mail: [email protected]
INTRODUCTION
Soil testing using a single-nutrient soil analysis in Indonesia has been developing since 1970. However, due to limited research funds, soil testing has not been programmed continuously and recommendation of location speci! c fertilization based on soil family has also not yet been established (Al-Jabri, 2007). Correlation studies for soil P testing have been conducted for rice (Nursyamsi et al., 1993) and corn (Kasno et al., 2001), however it has not been conducted for horticultural crop especially for vegetable crops.
The basic purpose of soil fertility evaluation is to provide information on the nutrient status of the soil and to predict the relative responses to the added nutrients. The Crop Nutrient Requirement (CNR) value is the amount of various nutrients needed to produce optimum, economical yields from a fertilization standpoint. It is important to remember that these nutrient amounts are supplied to the crop from both soil and fertilizer application. Phosphorus (P) fertilizer will only be applied when a properly calibrated
soil test indicates very small extractable amounts of this nutrient in the soil.
The nutrient status of cultivated soils varies and is continually changing due to the in" uence of fertilizer addition, nutrient losses by leaching or removal, and overall management. Site-speci! c estimation of the nutrient fertility status of soil are, therefore, very important for rational fertilizer use. Reliable site-speci! c information can only be accomplished through an orderly program of soil fertility evaluation in which proper attention is given to the following: 1) Techniques of soil sampling; 2) methods of soil analysis; 3) systems for correlating soil analysis results and crop responses; 4) model for interpretation of fertilizer response in ! eld trials, and 5) procedure for preparing economically sound fertilizer recommendation.
Phosphorus is an essential component for many physiological processes related to proper energy utilization in plants. Phosphorus is used in several energy transfer compounds in the plants. A very important function of P is as an important element of nucleic acids, the building blocks for the genetic code material in plant cells. Plants derive their P needs from soil, and uptake P mostly in the orthophosphate form. Native soil P levels are often low enough to limit crop production. Both inorganic P
Fertilizer Recommendation: Correlation and Calibration Study of Soil P Test
for Yard Long Bean (Vigna unguilata L.) on Ultisols in Nanggung-Bogor
Anas Dinurrohman Susila1*, Juang Gema Kartika1, Tisna Prasetyo1, and Manuel Celiz Palada2
1Department of Agronomy and Horticulture, Faculty of Agriculture, Bogor Agricultural University,
Jl. Meranti Kampus IPB Darmaga 16680, Indonesia
2Crop and Ecosystems Management Unit, AVRDC-World Vegetable Center,
P.O. BOX, Shanhua,Tainan 74199, Taiwan
Received 14 Mei 2010/Accepted 8 July 2010
ABSTRACT
Yard long bean (Vigna unguilata L.) 777 was grown in Ultisols, which typically have low pH and high P-! xation, to determine the best correlation of soil extraction methods for soil P with yields, and to develop soil P response categories. The research was conducted at SANREM base camp in Hambaro Village, Nanggung, Bogor, Indonesia from April to August 2008. Treatments were arranged in a Split Plot Design with three replications. The main plots were treatments with soil P status of 0X, ¼X, ½X, ¾X and X, where is X = 1,590.5 kg SP-36 ha-1 (36% P
2O5) applied once a month before planting. The
subplots were P application rate of 0, 75, 150, 225 and 300 kg P2O5 ha-1. Yard long beans were planted in double rows per
bed, 60 cm between rows and 25 cm within rows, 2 seeds per hole, with plot size of 1.5 m x 5 m. Coef! cient correlation (r) of extraction reagents Olsen, Bray-1, HCl 25%, and Mechlich-1 were 0.772, 0.765, 0.755, and 0.732, respectively. Based on Olsen soil testing methods, soil response categories of very low, low, medium, and high were (ppm P2O5) # 18.40, 18.40 < P < 117.27, 117.27 < P < 267.04, and $ 267.04 extracted-P, respectively. Based on Bray-1 soil testing methods, soil response categories for low, medium, and high were # 87.81, 87.81 < P < 233.78, and $ 233.78 extracted-P (ppm P2O5), respectively. Fertilizer recommendation based on the Olsen soil test for low response category was 185.75 kg P2O5 ha-1, and for the medium
soil category was 175.97 kg P2O5 ha-1. The Bray-1 soil test for the low response category was 184.31 kg P 2O5 ha
-1
, and for the
medium soil category was 161.39 kg P2O5 ha-1 .
fertilizers (treated rock phosphate) and organic P sources (animal manures) are equally adequate at supplying the orthophosphate ion and correcting P de! ciencies in soil (Daniels et al., 2008; Hochmuth, 2008).
Phosphorus fertilization is a key component in increasing soil productivity and in maximizing yield of crops. However, inputs of fertilizer and manure in excess of crop requirements might lead to a build-up of soil P levels and increased P runoff from agricultural soils. Phosphorus loss in runoff from agricultural ! elds has been identi! ed as an important contributor to eutrophication (Dobermann et al., 2002; Daverede et al., 2003).
Soil P tests are fundamental analytical tools for assessing the P nutrient status of the soil. Normally, the plants can utilize only a small percentage of the total soil P, such a quantity being strictly correlated to the labile soil P (portion of P relatively loosely bound to the soil colloids). Soil test P is not an indication of total P in the soil but of how much is available for plant use. Soil testing is the key component for determining the need for P fertilization. Also, if fertilization is required, soil test results guide the rate of application recommended to optimize production (Sawyer and Mallarino, 1999; Dobermann et al., 2002; Daniels et al., 2008).
Soil extracting reagents like Mechlich-1, Olsen, Bray-1, Morgan Vanema, HCl 25%, Water, Truog, and other extracting reagent have been used in correlation and calibration study of soil analysis and crop response of P in many research project. This is an important consideration as there have been many methods developed to test soils for crop available P. Each can have a widely different interpretation index (Sawyer and Mallarino, 1999). Kidder et al. (2003) used Mechlich-1 to interprete P requirement for environmental horticulture, and divided soil P status into 5 levels: very low (P < 10 ppm), low (P 10-15 ppm), medium (P 16-30 ppm), high (P 31-60 ppm) and very high (P > 60 ppm).
Kelling et al. (1998) described several factor affecting P recommendations, i.e. crop demand level (each crops requires varying level of available P to optimize yield), subsoil fertility (based on the subsoil nutrient supplying power of the soil), the yield potential of the soil and the farmers yield goals. Chang et al. (2004) reported that the best approaches for minimizing recommendation errors were nutrient speci! c. Phosphorus recommendations were improved using multiple years of yield monitor data to develop landscape-speci! c yield goals, sampling old homesteads separately from the rest of the ! eld, and P recommendations. The objective of this study was to build environmentally friendly fertilizer recommendations based on soil analysis for vegetable production in Ultisols. Speci! c objectives of this study were to ! nd out the best soil P extraction methods and response categories of soil-P on yield of yard long bean.
MATERIALS AND METHODS
The research was conducted at SANREM base camp in Hambaro Village, Nanggung, Bogor, Indonesia from April to August 2008. The soils at the location are Ultisols, which typically have low pH and high P-! xation by aluminum. Treatments were arranged in a Split Plot Design with three replications. The main plot treatment was soil P status and the subplot was P rate. Soil P status was developed by application of P at the rates of 0, 45, 90, 135 and 180 kg P2O5 ha-1 from December 2006 to April 2007 for vegetables
production, followed by application of 0X, ¼X, ½X, ¾X and X, where X = 1,590.5 kg SP-36 ha-1 (36% P
2O5) one
month before planting. The subplot treatments were P rates of 0, 75, 150, 225 and 300 kg P2O5 ha-1 applied as pre-plant
applications. Yard long beans, variety 777, were sown in double rows per bed, 60 cm between rows and 25 cm within rows, 2 seed per hole. The total plot number was 25 times 3 replications which is equal to 75 plots with individual plot size of 1.5 m x 5 m.
Lime (CaCO3) was well incorporated (1 ton ha-1)
into the beds two weeks before planting. Furrow irrigation was carried out at one-week intervals and weeding was performed when necessary. Fertilizer rates for N and K were 135 kg K2O ha-1 and 100 kg N ha-1, respectively. Phosphorus
rates were applied based on treatment. Fifty percent of N and K were applied pre-plant and the remaining applied in two side dressings of 25 % each at 3 and 6 weeks after transplanting. First pod harvesting was carried out at seven weeks after planting, every 3-4 days. Soil samples for the correlation test were taken two days before planting or 4 weeks after P status treatments were applied. Phosphorus soil extracting reagents that had been evaluated were Bray-1 (HCl 0.025 N + NH4F 0.03 N), Truog [H2SO4 0.002 N + (NH4)2SO4; pH 3], Olsen (NaHCO3 0.50 N; pH 8.5), HCl 25%, Water, Mechlich-1 (HCl 0.05 N and H2SO4 0.025 N), Morgan Vanema (NH4-OAc 1 M; pH 4.8) .
RESULTS AND DISCUSSION Plant Growth and Yield
The effect of soil P status on plant height and stem diameter was not signi! cant except on plant height at 2 weeks after planting. Application of P fertilizer to build up soil P status from 0 to X = 1,590.5 kg SP-36 ha-1 (36%
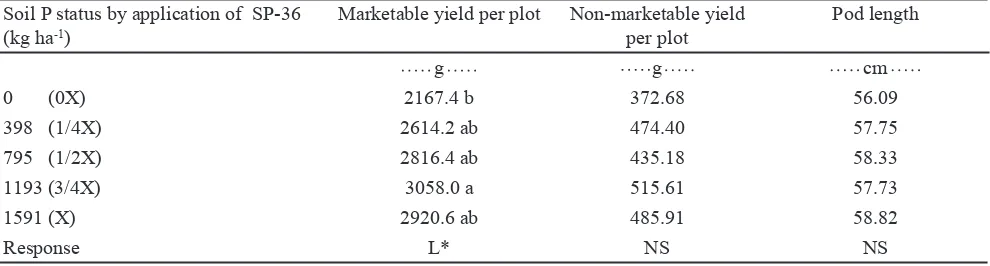
P2O5) increased linearly for plant height from 2 weeks after planting (Table 1). The same response was obtained on marketable yield per plot (Table 2). Soil P status from 0 to 1,591 g SP-36 ha-1 increased marketable yield per plot
linearly from 2,167.4 to 2,920.6 g plot-1. However, there
was no signi! cant effect on non-marketable yield per plot and pod length. These results indicated that the range of soil P status in the research site was wide enough to build a correlation study between soil P status and yield response of yard long bean.
Correlation between Soil Extracted-P and Yield
Five different soil-P extraction methods resulted in different soil-P indices. The strongest extracting reagents to
the weakest were HCl 25% (521–1,565 ppmP2O5) followed by Mechlich-1 (30–841 ppm P2O5), Truog (13-489 ppm P2O5), Olsen (43–417 ppm P2O5), Bray-1 (23-414 ppm P2O5), Morgan Vanema (1–18 ppm P2O5), and water (0.1–1.6 ppm P2O5). Extracted-P by different extraction methods on different P-application rates on Ultisols is presented in Table 3. The strongest extraction methods was not necessarily be the best solution for soil P extraction. The ideal soil test has the following characteristics: 1) the extracting reagent is effective for most, if not all plant mineral nutrients, and for all soil types, 2) the procedure accurately measures the plant-availability of the nutrient, and 3) the test is simple, inexpensive, quick, reproducible, and sensitive to all soil factors controlling nutrient availability (Skogley, 1994).
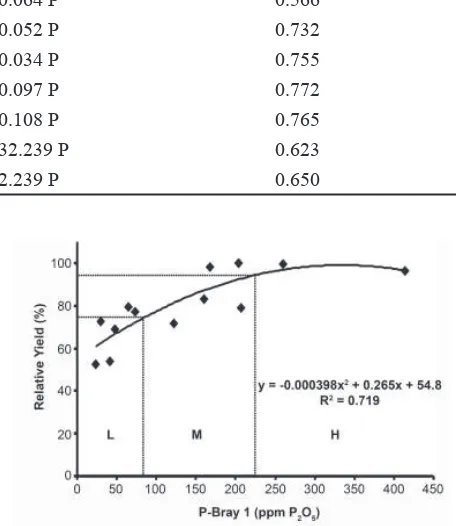
In order for a soil test to be useful, there must be a positive correlation between the index and the crop response (yield). The best extraction method will mimic how the plant root extracts P from the soil, therefore it will have good correlation with plant yield. The highest coef! cient correlation to the lowest was Olsen (0.772), Bray-1 (0.765), HCl 25% (0.755), Mechlich-1 (0.732), Morgan Vanema (0.650), Water (0.623), and Truog (0.266) (Table 4). For an extracting reagent to be effective, it requires that a low index
Table 2. The effect of soil P status on marketable yield, non-marketable yield and pod length of yard long bean
Soil P status by application of SP-36 (kg ha-1)
Marketable yield per plot Non-marketable yield per plot
Pod length
g g cm
0 (0X) 2167.4 b 372.68 56.09
398 (1/4X) 2614.2 ab 474.40 57.75
795 (1/2X) 2816.4 ab 435.18 58.33
1193 (3/4X) 3058.0 a 515.61 57.73
1591 (X) 2920.6 ab 485.91 58.82
Response L* NS NS
Note: * = Signi! cant on 5% F test; NS = Not Signi! cant; L = Linear Soil P status by application
of SP-36 (kg ha-1)
Plant height Stem diameter
(weeks after planting) (weeks after planting)
2 3 4 2 3 4
cm cm
0 (0X) 17.54b 42.67 123.68 0.317 0.413 0.485
398 (1/4X) 18.88a 51.54 140.57 0.364 0.440 0.498
795 (1/2X) 18.58a 48.64 135.13 0.387 0.449 0.505
1193 (3/4X) 19.28a 49.01 135.91 0.349 0.459 0.534
1591 (X) 19.53a 53.47 139.88 0.411 0.467 0.524
Response L** NS NS NS NS NS
Table 1. The effect of soil P status on plant height and stem diameter of yard long bean at 2, 3, and 4 weeks after planting
Extraction reagent Linear equation Coef! cient correlation
Truog RY= 70.563 + 0.064 P 0.566
Mechlich-1 RY= 66.673 + 0.052 P 0.732
HCl 25% RY= 47.280 + 0.034 P 0.755
Olsen RY= 61.548 + 0.097 P 0.772
Bray-1 RY= 64.248 + 0.108 P 0.765
Water RY= 67.724 + 32.239 P 0.623
Morgan Vanema RY= 66.465 + 2.239 P 0.650
Table 4. Correlation between extracted-P by different extraction reagents with yard long bean relative yield on Ultisols, Nanggung, Bogor
be related to reduced growth responses for a crop grown on that soil, and conversely, a high index be related to maximum crops response (Dahnke and Olson, 1990). Soil-P extraction methods with coef! cient correlation > 0.7 (Olsen, Bray-1, HCL 25%, Mechlich-1) can be recommended to test soil P for yard long bean in Ultisols Nanggung, Bogor. However, evaluation of the operational cost and reproducibility of that extraction reagent is still needed.
Calibration of the Soil P Test
Once a good correlation between indices produced by the extracting reagent and crop response is established, soil test indices are usually grouped into response categories so
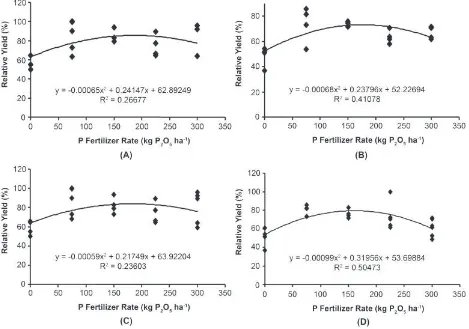
that the indices can be interpreted and become meaningful. By plotting of percent relative yields and corresponding extracted-P, it can be determined plant response categories of that soil. Yard long bean relative yield plotted against extracted-P by Olsen reagent is presented in Figure 1. Extracted-P concentration # 18.40 ppm resulted in # 50% crop relative yield and therefore was termed “very low”. A “low” response category result of 50% to 75% of relative yield was obtained where soil extracted-P was > 18.40 to < 117.27 ppm. A “medium” response category result of 75% to 100% of relative yield was obtained where soil extracted-P was > 117.27 to < 267.04 ppm, while a “high” response category result of $ 100% of relative yield was obtained for soil extracted-P $ 267.04 ppm.
Soil P status by application of SP-36 (kg ha-1)
Truog Mechlich-1 HCl 25% Olsen Bray 1
(P2O5 ppm) Water
Morgan Vanema
-- Extracted-P
[image:4.595.43.539.276.392.2]---0 (---0X) 54 ± 35.55 51 ± 27.59 613 ± 114.18 62 ± 17.35 34 ± 1290 0.2 ± 0.10 2 ± 0.00 397,625 (1/4X) 58 ± 54.22 94 ± 29.57 704 ± 129.00 118 ± 100 60 ± 16.65 0.13 ± 0.06 2.3 ± 1.53 795,250 (1/2X) 77 ± 61.29 182 ± 91.76 742 ± 165.77 126 ± 43.41 108 ± 60.78 0.33 ± 0.23 5.3 ± 3.06 1,192,875 (3/4X) 314 ± 151.84 487 ± 309.02 1317 ± 303.04 324 ± 95.04 263 ± 132.22 0.37 ± 0.15 10.7 ± 6.66 Table 3. Extracted-P by various extraction methods from different P fertilizer rates on Ultisols, Nanggung, Bogor
Figure 1. Plot of relative yield and corresponding extracted-P using Olsen extraction method in Ultisols, Nanggung, Bogor. VL = Very Low, L = Low, M = Medium, H = High
[image:4.595.41.538.444.565.2] [image:4.595.305.533.467.730.2]Plots of extracted-P by Bray-1 reagent with yard long bean relative yield can be seen in Figure 2. There was no “very low” response category obtained by Bray-1 soil P test from this study. A “low” response category result (# 75% of relative yield) was obtained with soil extracted-P # 87.81 ppm, a “medium” response category result (75 % to 100 % relative yield) was obtained with soil extracted-P between < 87.81 to < 233.78 ppm, while a “high” response category result of $ 100% of relative yield was obtained with soil extracted-P $ 233.78 ppm. The Olsen and Bray-1 soil test calibration for yard long bean in Ultisols, Nanggung, Bogor can be seen in Table 5.
Fertilizer Recommendation
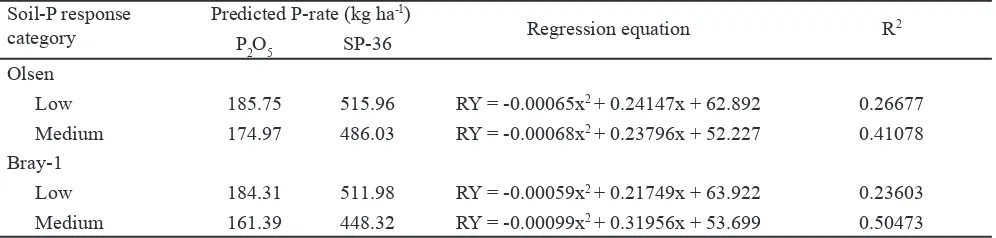
The objectives of grouping soil test indices into responses categories are to recommend the quantity of fertilizer required for those sites to produce maximum yield. The relationship between P-fertilizer rate and relative yield of yard long bean on Ultisols, Nanggung, Bogor, based on response category determined by different extraction methods, can be seen in Figure 3. Based on Olsen extraction methods, under “low” soil response category the regression equation was RY = -0.00065x2 + 0.24147x + 62.89249, R2
= 0.26677. From this regression model, optimum predicted P-fertilizer rate was 185.75 kg P2O5 ha-1 or equal to 515.96
kg SP-36 ha-1 (36% P
2O5). Under “medium” soil response
category the regression equation was RY = -0.00068x2 +
0.23796x + 52.22694, R2 = 0.41078. Optimum predicted
P-fertilizer rate for “medium” soil P response category was 174.97 kg P2O5 ha-1 or equal to 486.03 kg SP-36 ha-1 (36%
P2O5). Predicted P-fertilizer recommendation rate based on soil-P response category can be seen in Table 6.
Based on Bray-1 extraction method, under “low” soil response category the regression equation was RY = -0.00059x2 + 0.21749x + 63.92204, R2 = 0.23603. From
this regression model, optimum predicted P-fertilizer rate was 184.31 kg P2O5 ha-1 or equal to 511.98 kg SP-36 ha-1
(36% P2O5). Under “medium” soil response category the regression equation was RY = -0.00099x2 + 0.31956x +
53.69884, R2 = 0.50473. Optimum predicted P-fertilizer
rate for “medium” soil P response category was 161.39 kg P2O5 ha-1 or equal to 448.32 kg SP-36 ha-1 (36% P
2O5).
Although there were differences in soil P category values between Olsen and Bray-1 extraction methods, the predicted P fertilizer recommendation were similar for the same soil P category responses.
CONCLUSION
From this study it can be concluded that Olsen, Bray-1, HCl 25%, and Mechlich-1 soil test can be used to determine soil-P for yard long bean production in Ultisols-Nanggung. The coef! cient correlation (r) of extraction reagent Olsen, Bray-1, HCl 25%, and Mechlich-1 were 0.772, 0.765, 0.755, and 0.732, respectively. With the Olsen soil test, Ultisols-Nanggung can be divided into very low, low, medium and high soil response category. However with the Bray-1 soil test they only can be divided into low, medium, and high soil response categories.
ACKNOWLEDGEMENT
This publication was made possible through support provided by the United States Agency for International Development and the generous support of the American People (USAID) for the Sustainable Agriculture and Natural Resources Management Collaborative Research Support Program (SANREM CRSP) under terms of Cooperative Agreement Award No. EPP-A-00-04-00013-00 to the Of! ce of International Research and Development (OIRED) at Virginia Polytechnic Institute and State University (Virginia Tech).
REFERENCES
Al-Jabri, M. 2007. Perkembangan uji tanah dan strategi program uji tanah masa depan di Indonesia. J. Litbang Pertanian 26:54-66.
Chang, J., D.E. Clay, C.G. Carlson, C.L. Reese, S.A. Clay, M.M. Ellsbury. 2004. De! ning yield goals and management zones to minimize yield and nitrogen and phosphorus fertilizer recommendation errors. Agron. J. 96:825–831.
Dahnke, W.C, R.A. Olson. 1990. Soil test correlation, calibration, and recommendation. p. 45-57. In R.L. Westerman (Ed.) Soil testing and plant analysis, 3 rd. ed. SSA No 3. Soil Sci. Soc. Amer. Inc., Madison.
Daniels, M.,T. Daniel, K. Van Devender. 2008. Soil Phosphorus Levels: Concerns and Recommendations. The University of Arkansas Cooperative Extension Service. http://www.uaex.edu.
Daverede, I.C., A.N. Kravchenko, R.G. Hoeft, E.D. Nafziger, D.G. Bullock, J.J. Warren, L.C. Gonzini. 2003. Phosphorus runoff: effect of tillage and soil phosphorus levels. J. Environ. Qual. 32:1436-1444.
Dobermann, A., T. George, N. Thevs. 2002. Phosphorus fertilizer effects on soil phosphorus pools in acid upland soils. Soil Sci. Soc. Am. J. 66:652–660.
Hochmuth, G.J. 2008. Fertilizer Management for Greenhouse Vegetables-Florida Greenhouse Vegetable Production Handbook, Vol 31. IFAS Extention, University of Florida.
Kasno, A., S. Adiningsih, Sulaiman, Nurjaya, Asmin. 2001. Kalibrasi uji tanah hara P tanah Oxisols, Sulawesi Soil-P response
category
Predicted P-rate (kg ha-1)
Regression equation R2
P2O5 SP-36
Olsen
Low 185.75 515.96 RY = -0.00065x2 + 0.24147x + 62.892 0.26677
Medium 174.97 486.03 RY = -0.00068x2 + 0.23796x + 52.227 0.41078
Bray-1
Low 184.31 511.98 RY = -0.00059x2 + 0.21749x + 63.922 0.23603
Medium 161.39 448.32 RY = -0.00099x2 + 0.31956x + 53.699 0.50473
Table 6. Predicted P-fertilizer recommendation rate for yard long bean in Ultisols, Nanggung , Bogor, based on soil-P response category
Response category Relative yield (%) Extracted-P (ppm P2O5)
Olsen Bray I
Very low # 50 # 18.40
-Low > 50 - < 75 > 18.40 - < 117.27 # 87.81
Medium > 75 - < 100 > 117.27 - < 267.04 < 87.81 - < 233.78
High $ 100 $ 267.04 $ 233.78
Tenggara untuk tanaman jagung. hal. 397-417. Dalam Prosiding Seminar Nasional Reorientasi Pendayagunaan Sumberdaya Tanah, iklim, dan Pupuk.
Kelling, K.A., L.G. Bundy, S.M. Combs, J.B. Peters. 1998. Soil test recommendation for ! eld, vegetable, and fruit crops. Cooperative Extention-University of Wisconsin-Extention.
Kidder, G., E.A. Hanlon, T.H. Yeager, G.L. Miller. 2003. IFAS Standardized Fertilization Recommendations for Environmental Horticulture Crops1. IFAS Extension, University of Florida.
Nursyamsi, D., D. Setyorini, I.P.G. Widjaja-Adhi. 1993. Penentuan kelas hara P terekstrak dengan metode
analisis keragaman yang dimodi! kasi. hal. 217-235. Dalam Prosiding Pertemuan Teknis Penelitian Tanah dan Agroklimat Bidang Kesuburan Tanah dan Produkstivitas Tanah. Bogor 18-21 Februari 1993.
Sawyer, J.E., A.P. Mallarino. 1999. Differentiating and understanding the Mehlich 3, Bray, and Olsen soil phosphorus tests. Presented at the 19th Annual Crop Pest Management Short Course, University of Minnesota, November 22, 1999, St. Paul, MN.