ISSN: 2339-076X, Volume 3, Number 1 (October 2015): 447 - 452
DOI:10.15243/jdmlm.2015.031.447
Research Article
Effects of arbuscular mycorrhiza inoculation on growth and yield of
tomato (Lycopersicum esculentum
Mill.) under salinity stress
D.R.R. Damaiyanti
1*, N. Aini
2, R. Soelistyono
21
Postgraduate Programme, Faculty of Agriculture, Brawijaya University, Jl. Veteran, Malang 65145, Indonesia.
2
Department of Agronomy, Faculty of Agriculture, Jl. Veteran, Malang 65145, Indonesia.
* corresponding author: [email protected]
Abstract :
Objective of the research was to study the effect mycorrhiza on growth and yield of tomato. The experiment was conducted in screen house 14 m x 10.5 m, in Pasuruan on November 2013 until March 2014, The experiment was conducted as a factorial randomized complete design. The first factor was dose of mycorrhiza (without mycorrhiza, 5 g mycorrhiza, 10 g mycorrhiza, and 20 g mycorrhiza). The second factor was the salinity stress level (without NaCl, 2500 ppm NaCl, 5000 ppm NaCl, and 7500 ppm NaCl). The results showed that salinity stress at the level 7500 ppm decreased the amount of fruit by 30.84% and fresh weight per hectare decreased by 51.72%. Mycorrhizal application was not able to increase the growth and yield in saline stress conditions; it was shown by the level of infection and the number of spores on the roots of tomato plants lower the salinity level 5000 ppm and 7500 ppm. But separately, application of 20 g mycorrhiza enhanced plant growth, such as plant height, leaf area, leaf number and proline. Application of 20 g mycorrhiza increased the yield by 35.99%.Keywords:mycorrhiza, salinity, tomato
Introduction
The demand of tomato keeps increasing due to the nutrient content of tomato and it is good for health. Productivity of tomato decreased about 3.34% in 2014, which was followed by the decreasing production about 9.83% and decreasing harvested area about 6.13%. Potential production of tomato should be enhanced to increase productivity of the tomato. Salinity occurs when the soluble salt accumulates in the soil and it frequently creates some problems in the development of lowland agriculture. One of the salinity causes is the increasing global temperature, which causes high evaporation. The loss of water from the soil, as a result of evapotranspiration, causes the salts to accumulate in the soil. Besides that, the increasing intensive application of chemical fertilizer has decreased quality of the soil due to salts and heavy metals, such as Cu, Al, and Cd that have accumulated in the soil (Cassman et al., 1996). Excessive saline solution in the soil will poison the plants (Yuniati, 2004). Tomato is moderately sensitive to salinity at all stages of growth, including germination,
vegetative and reproductive growth, which can reduce both yield and quality of the tomato under salinity stress. Therefore, high salinity as a result of plasmolysis can easily cause cell damages. The application of arbuscular mycorrhiza is one of efforts to reduce cell damages under salinity stress.
diverse mechanisms. Objectives of this study were to elucidate the effects of mycorrhizal inoculation on increasing resistance and growth of tomato under salinity stress.
Materials and Methods
The research was conducted from November 2013 to March 2014 at the plastic house on the area of 14 m x 10.5 m in Pasuruan at the altitude of + 56 m above sea level and the temperature range of 28-30oC. Materials used for this study were tomato seeds of F1 Betavila Hybrid, polybag, NPK inorganic fertilizer, cow manure, NaCl and inoculums of arbuscular mycorrhiza.
The study applied a factorial randomized complete design comprising of two factors with three replications. The first factor was dose of mycorrhiza M0 = without mycorrhizal treatment (0 spore), M1 = 5 g mycorrhiza (75 spores), M2 = 10 g mycorrhiza (150 spores), and M3 = 20 g mycorrhiza (300 spores) The second factor was the salinity stress which included S0 = without salinity stress, S1 = salinity stress of 2500 ppm, S2 = salinity stress of 5000 ppm, and S3 = salinity stress of 7500 ppm. The observations included plant height, leaf area, number of fruits, infected roots, number of spores, proline content in fresh
weight of leaf and fresh weight of fruits. The proline content was measured using Ninhidrin method (Bates et al., 1973). Number of spores was counted by sieving and decanting (Brundrett et al., 1996) and the infected roots was counted using Kormanik’s and Mc. Graw’s methods. The obtained data of observation were analyzed using analysis of variance (F-test) at the level of 5% followed by comparative test among treatments using Honestly Significant Difference (HSD) at the level of 5%.
Results and Discussion
Plant height and leaf area
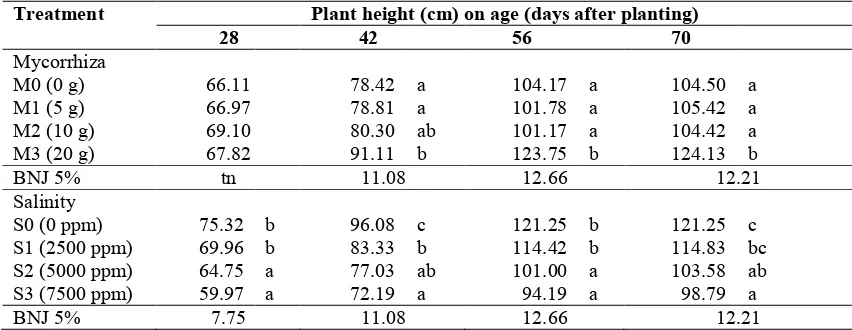
The height tomato plants had increased from early growth to the age of 70 dap (days after planting). In comparison with no mycorrhizal treatment, application of 20 g mycorrhiza increased plant height by 16.19%, 18.80%, and 18.78% at 42, 56, and 70 dap, respectively (Table 1). The plant height, however, has reduced along with the increasing salinity level. Under salinity level of 7500 ppm, the plants’ height at 28 dap, 42 dap, 56 dap, and 70 dap were lower for about 20.38%, 24.87%, 22.31%, and 18.52%, respectively, in comparison without any salinity treatment.
Table 1. Height of the tomato’s plant by the application of arbuscular mycorrhiza under salinity stress.
Treatment Plant height (cm) on age (days after planting)
28 42 56 70
Mycorrhiza
M0 (0 g) 66.11 78.42 a 104.17 a 104.50 a
M1 (5 g) 66.97 78.81 a 101.78 a 105.42 a
M2 (10 g) 69.10 80.30 ab 101.17 a 104.42 a
M3 (20 g) 67.82 91.11 b 123.75 b 124.13 b
BNJ 5% tn 11.08 12.66 12.21
Salinity
S0 (0 ppm) 75.32 b 96.08 c 121.25 b 121.25 c
S1 (2500 ppm) 69.96 b 83.33 b 114.42 b 114.83 bc
S2 (5000 ppm) 64.75 a 77.03 ab 101.00 a 103.58 ab
S3 (7500 ppm) 59.97 a 72.19 a 94.19 a 98.79 a
BNJ 5% 7.75 11.08 12.66 12.21
Notes: number followed by the same letter at the same age shows insignificant difference based on HSD (Honestly Significant Difference) test of 5%
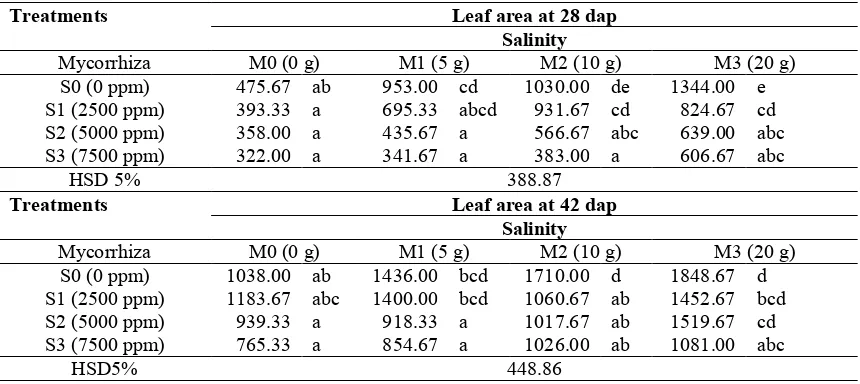
Results of the observation on leaf area at 28 dap and 42 dap showed that under salinity level of 7500 ppm, the application of 20 g mycorrhiza had insignificant difference on leaf area in comparison treatments of without mycorrhiza, 5 g mycorrhiza, and 10 g mycorrhiza (Table 2). Results of observation on leaf area at 56 dap showed that under salinity treatment of 0 ppm, leaf area was
mycorrhizal treatment, leaf area of the tomato plant was higher than under mycorrhizal treatments of 0 g, 5 g, and 10 g. Results of this study conformed to the study of Rahmawati et al. (2012) that plant growth decreased along with the application of NaCl for about 5000 ppm and 7500 ppm. Result of the research by Suwignyo et al. (2010) showed that salinity treatment could reduce the plant’s height, chlorophyll of the leaf, and total dry weight of the plant. According to Yamashita and Matsumoto (1997), under salinity stress, growth and development of the plants would be inhibited due to over accumulation of
Na and Cl in cytoplasm, which caused the metabolism change within the cells. Salt has inhibited the enzyme activities. Such condition caused partial dehydration within the cells due to decreasing potential water in the cells. Therefore, the plants become to die or reduce its productivity. Rajendran et al. (2009) stated that under salinity stress, the plant is under osmotic stress phase that may inhibit the emergence of leaf and leaf enlargement, as well as accelerate the leaf aging due to accumulation of the excessive toxic ions.
Table 2. Leaf area of the tomato plant by the application of arbuscular mycorrhiza under salinity stress at 28 and 42 days after planting (dap).
Treatments Leaf area at 28 dap Salinity
Mycorrhiza M0 (0 g) M1 (5 g) M2 (10 g) M3 (20 g)
S0 (0 ppm) 475.67 ab 953.00 cd 1030.00 de 1344.00 e
S1 (2500 ppm) 393.33 a 695.33 abcd 931.67 cd 824.67 cd
S2 (5000 ppm) 358.00 a 435.67 a 566.67 abc 639.00 abc
S3 (7500 ppm) 322.00 a 341.67 a 383.00 a 606.67 abc
HSD 5% 388.87
Treatments Leaf area at 42 dap Salinity
Mycorrhiza M0 (0 g) M1 (5 g) M2 (10 g) M3 (20 g)
S0 (0 ppm) 1038.00 ab 1436.00 bcd 1710.00 d 1848.67 d
S1 (2500 ppm) 1183.67 abc 1400.00 bcd 1060.67 ab 1452.67 bcd
S2 (5000 ppm) 939.33 a 918.33 a 1017.67 ab 1519.67 cd
S3 (7500 ppm) 765.33 a 854.67 a 1026.00 ab 1081.00 abc
HSD5% 448.86
Notes: number followed by the same letter at the same age shows insignificant difference based on HSD (Honestly Significant Difference) test of 5%
Under salinity treatment of 7500 ppm, leaf area of the tomato’s plant was smaller than under lower salinity treatment. It conformed to Syakir et al. (2008) that in general, the salinity stress could reduce the plant’s growth as a result of reduced leaf area and numbers of leaf. On leaf that having salinity stress, it will show some symptoms, such as browning leaf, and then dried and leaf tip roll. Rujito et al. (2010) stated that symptoms of having NaCl poison are leaf tip roll and difficult to open, browning leaf tip, drying, and then falling down. Levitt (1980) stated that the decreasing number of leaf and leaf area were due to less availability of nutrient and water, as well as high accumulation of Na and Cl ions within the plant’s tissues, which would inhibit the cellular differentiation process at the growing point of total leaf area are the most influential variables rather than other growth’s parameters, so that drastic decreasing leaf area shows high sensitivity
of the leaf’s growth toward salinity. The decrease of plant height and leaf area along with the increasing level of salinity resulted in the decreased numbers of fruit and fresh weight of fruit (Table 3)
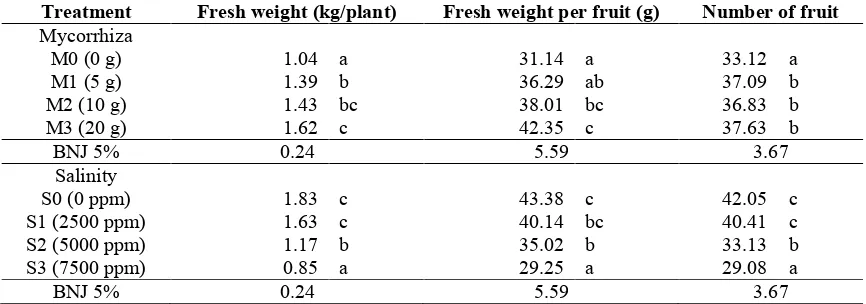
Fresh weight of fruits and number of fruits
comparison with the control. Under salinity treatments of 5000 ppm and 7500 ppm, the yields decreased for about 46.66% and 52.46%, respectively, in comparison with without salinity treatment. Results of observation on number of fruits showed that the application of 5 g, 10 g and 20 g mycorrhiza increased numbers of tomato for about 11.99%, 11.20%, and 13.62% in comparison with no mycorrhiza treatment. The increased salinity level of above 2500 ppm reduced the yield of tomato. The application of salinity treatment of 5000 ppm reduced the yield
of tomato for about 21.21% in comparison with the plant without salinity treatment. Along with the application of mycorrhiza by dosage of 10 g, the fresh weight of fruit per fruit was about 22.06% and by dosage of 20 g, the fruit weight per fruit would increase 35.99% in comparison with the plant without mycorrhiza treatment. Under salinity levels of 5000 ppm and 7500 ppm, fresh weight of fruit per fruit has reduced for about 19.27% and 32.57%, respectively, in comparison with without salinity treatment.
Table 3. Fresh weight of fruit and number of fruit by the application of arbuscular mycorrhiza under salinity stress.
Treatment Fresh weight (kg/plant) Fresh weight per fruit (g) Number of fruit
Mycorrhiza
M0 (0 g) 1.04 a 31.14 a 33.12 a
M1 (5 g) 1.39 b 36.29 ab 37.09 b
M2 (10 g) 1.43 bc 38.01 bc 36.83 b
M3 (20 g) 1.62 c 42.35 c 37.63 b
BNJ 5% 0.24 5.59 3.67
Salinity
S0 (0 ppm) 1.83 c 43.38 c 42.05 c
S1 (2500 ppm) 1.63 c 40.14 bc 40.41 c
S2 (5000 ppm) 1.17 b 35.02 b 33.13 b
S3 (7500 ppm) 0.85 a 29.25 a 29.08 a
BNJ 5% 0.24 5.59 3.67
Notes: number followed by the same letter at the same age shows insignificant difference based on HSD (Honestly Significant Difference) test of 5%
Results of this study conformed to results of the research reported by Gonzáles-Fernández and Cuartero (1993) that 10% decreasing weight of fruit was due to irrigation and 5 - 6 dS/m water, 30% decreasing weight of fruit by 8 dS/m, and for about 40% at higher EC. However, when the water has EC 8 dS/m or more, it could inhibit the growth and sustain yield loss. According to Caro et al. (1991), high EC in tomato plant could reduce yield. Cruz (1990) also reported that the increasing salinity treatment in tomato plant by high EC could reduce the fruit’s size. Application of 20 g mycorrhiza could increase fruit weight for about 35.99% in comparison with the plant without any mycorrhiza treatment. According to Linderman (1994), the application of mycorrhiza could increase growth and yield of the plants by increasing nutritional status of the plants. Smith et al. (2000) added that the application of mycorrhiza could increase tolerance toward abiotic stress, such as drought, salinity, and heavy metals. Mycorrhizal association could change the hosts and the environment through rhizosphere level, affect the soil structures, deposition of carbon in the soil, and microbial variability.
Mycorrhizal infection and amount of spores
species. According to Poss et al. (1985), formation of the mycorrhiza arbuscular fungi will reduce by the increasing level of salinity in the soil. The increasing level of salinity in the soil will reduce the canopy growth and, of course, it will reduce the photosynthetic area of the related plant. As a result, it will inhibit the growth of
plant and fungi by the decreasing availability of photosynthate. Such condition is caused by the effect of water stress or toxic ions toward the plant’s growth. The mycorrhizal fungi in its symbiosis are highly depended on nutrients of carbonate as photosynthetic results of the hosts (Thomson et al., 1990).
Table 6. Root infection and the amount of spores in tomato plant, as well as the application of arbuscular mycorrhiza under salinity stress.
Treatment Root Infection (%)
Amount of spores
Treatment Root Infection (%)
Amount of spores
Mycorrhiza Salinity
M0 (0 g) 0.00 a 0.00 a S0 (0 ppm) 39.17 c 268.50 b
M1 (5 g) 37.71 b 244.08 b S1 (2500 ppm) 38.75 c 266.17 b
M2 (10 g) 39.79 b 275.50 b S2 (5000 ppm) 28.96 b 180.33 a
M3 (20 g) 48.96 c 317.33 b S3 (7500 ppm) 19.58 a 121.92 a
BNJ 5% 9.13 82.33 BNJ 5% 9.13 82.33
Notes: number followed by the same letter at the same age shows insignificant difference based on HSD (Honestly Significant Difference) test of 5%
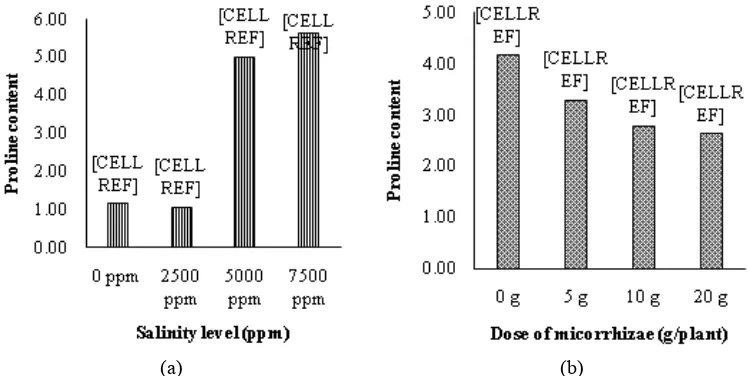
Proline content
Without mycorrhiza treatment, the tomato plant showed higher proline content than with the mycorrhiza treatments by dosages of 5 g, 10 g, and 20 g (Figure 1). Under 5 g mycorrhiza treatment, the tomato plant contained higher proline than the treatments by dosages of 10 g and 20 g, however, treatment by dosage of 10 g showed insignificant difference with the dosage of
20 g. Without salinity treatment, the tomato plant contained lower proline than the plant, which had salinity treatments of 5000 ppm and 7500 ppm, but it had insignificant difference with the treatment of 2500 ppm. Under salinity treatment of 7500 ppm, the proline content was higher than the treatments by dosages of 5000 ppm, 2500 ppm, and 0 ppm.
(a) (b)
Results of this study conformed to the study of Claussen (2005) that the stressed plant would produce higher proline. Maggio (2002) added that accumulated proline was the consequence of the increasing free amino acids, when the plant was under environmental stresses, such as drought stress, high salinity, and low temperature, the plants would actively produce it as metabolite and defensive system to adapt to any environmental stresses. Metabolites, which are produced by the plant under stress condition, include proline, glycine betaine, and manitol.
Conclusion
The salinity stress at the level of 7500 ppm inhibited the height, leaf area, and proline content of tomato plant. The salinity stress at the level of 7500 ppm also reduced the yield of fruit for about 30.84% and fresh weight of fruit per ha for about 51.72%. The application of mycorrhiza was not able to increase growth and yield under salinity stress, as is shown through the root’s infection level and the amount of spores were lower at the salinity level of 5000 ppm and 7500 ppm. However, the separate application of 20 g mycorrhiza increased plant height, leaf area, numbers of leaf, index of chlorophyll, and proline content of tomato plant. Application of 20 g mycorrhiza increased fruit weight by 35.99%.
References
Bates, L.S., Waldren, R.P. and Tear, I.D. 1973. Rapid determination of free proline for water stress studies.Plant and Soil39:205-207.
Brundrett, M., Bougher, N., Dell, B., Grove, T. and Malajczuk, N. 1996, Working with Mycorrhizas in Forestry and Agriculture. ACIAR, Canberra. Caro, M., Cruz, V., Cuartero, J., Estañ, M.T. and
Bolarin, M.C.1991. Salinity tolerance of normal fruited and cherry tomato cultivars.Plant and Soil136: 249-255.
Cassman, K. G., Dobermann, A., Sta Cruz, P.C., Gines, G.C., Samson, M.I., Descalsota, J.P., Alcantara, J.M., Dizon, M.A. and Olk, D.C. 1996. Soil organic matter and the indigenous nitrogen supply of intensive irrigated rice systems in the tropics.Plant and Soil182:267–278.
Claussen, W. 2005. Proline as measure of stress in tomato plants. Plant Science163: 241-248. Cruz, V. 1990. Tolerancia a la salinidad y criterios de
seleccioÂn en Lycopersicum Mill. spp. Ph.D. thesis, Universidad de Maalaga. pp. 484.
Gonzáles-Fernández, J.J. and Cuartero, J.1993. Evolución de la producción de cuatro entradas de tomate cultivadas con sal. Actas de Horticultura
10:1067–1072.
Levitt, J. 1980. Response of Plant to Environmental Stresses. Academic Press.New York.
Linderman, R.G. 1994. Role of VAM fungi in biocontrol. In: Pfleger, F.L. and Linderman, R.G. (eds), Mycorrhizae and Plant Health, APS Press, St. Paul. pp 1-26.
Maggio, A. 2002. Does proline accumulation play an active role in stress induced growth reduction.The Plant Journal21:699-712.
Poss, J. A., Pond, E., Menge, J.A. and Harrell, W.M. 1985. Effect of salinityon mycorrhizal onion and tomato in soil with and without additional phosphate.Plant and Soil88 : 307–319.
Rahmawati, H., Sulistyaning, E. dan Eka Putra, T.S.. 2011. Pengaruh NaCl terhadap Hasil dan Mutu Buah Tomat (Lycopersicum esculentum Mill.). FP Gadjah Mada. Yogyakarta.
Rajendran, K., Tester, M. and Roy, S.J. 2009. Quantifying the three maincomponents of salinity tolerance in cereals. Plant, Cell and Environment
32:237-249.
Rujito, A.S., Hayati, R. dan Mardiyanto. 2010. Toleransi tanaman jagung terhadap salinitas dengan perlakuan stres awal rendah. Jurnal Agrivigor 10 (1): 73-83
Schonbeck, F. 1979. Endomycorrhiza in relation to plant diseases. In:Schippers, B. and Gams, W. (eds),
Soil Borne Plant Pathogens. Academic Press. New York, pp 271-280.
Smith, F.A., Jakobsen, I. and Smith, S.E. 2000. Spatial differences in acquisition of soil phosphate between two arbuscular mycorrhizal fungi in symbiosis with Medicago truncatula. New Phytologist 147:357– 366.
Suwignyo, R.A., Hayati, R. dan Mardiyanto. 2010. Pengaruh Perlakuan Salinitas Awal Rendah terhadap Pertumbuhan dan Toleransi Salinitas Tanaman Jagung. Fakultas Pertanian Universitas Sriwijaya. Sumatera Selatan.
Syakir, M., Maslahah, N. dan Januwati, M. 2008. Pengaruh Salinitas Terhadap Pertumbuhan Produksi Dan Mutu Sambiloto (Andrographis paniculata
Ness).Jurnal Buletin Littro19 (2):129-137. Talaat, N.B. and Shawky, B.T. 2014. Protective effects
of arbuscular mycorrhizal fungi on wheat (Triticum aestivum L.) plants exposed to salinity.
Environmental and Experimental Botany98:20–31. Thompson, J. P. 1990. Soil sterilization methods to
show VA-mycorrhizae aid P and Zn nutritionof wheat in vertisols. Soil Biology and Biochemistry
22:229–240.
Yamashita, K. and Matsumoto, H. 1997. Effect of sodium chloride stress on the plasma membrane ATPase of barley roots: probable cause for decrease in ATPase activity.Journal of Plant Nutrition 20:
233–245.
Yuniati R. 2004. Penapisan galur kedelaiGlycine max