DETECTION AND QUANTIFICATION OF ADULTERATION IN LUWAK COFFEE THROUGH ULTRAVIOLET-VISIBLE SPECTROSCOPY
COMBINED WITH CHEMOMETRICS METHOD
MEINILWITA YULIA1, DIDING SUHANDY2*, SRI WALUYO2AND
CICIH SUGIANTI2
1)
Department of Agricultural Technology, Lampung State Polytechnic, Jl. Soekarno Hatta No. 10, Rajabasa Bandar Lampung, Lampung, Indonesia.
2)
Department of Agricultural Engineering, The University of Lampung, Jl. Soemantri Brojonegoro No. 1 Gedong Meneng Bandar Lampung, Lampung, Indonesia 35145.
*corresponding author:[email protected]
ABSTRACT
Luwak coffee is the most expensive coffee in the world and currently, the authentication of
Luwak coffee has become very important due to the possible adulteration of Luwak coffee
with non-Luwak coffee. In this research, we investigated the potential application of using
ultraviolet-visible (UV-Vis) spectroscopy combined with chemometric techniques (partial
least square/PLS1) for quantification of adulteration in Luwak coffee. The adulterant was
Arabica coffee which was added into Luwak coffee with degree of adulteration in the range
of 10-50%. A number of 30 samples were used. All samples were extracted with distilled
water and filtered. The spectral acquisition was performed with 10 mm of cuvette cell using
a UV - Vis spectrometer (Genesys™ 10S UV-Vis, Thermo Scientific, USA) in the range of
200-500 nm. PLS1 model correlates the actual and UV-Vis estimated values of adulterants
(concentration of Arabica coffee in Luwak coffee) with coefficients of correlation (r) of 0.99
and 0.97 for calibration and validation, respectively. The low RMSECV values of 0.044 gram
could be obtained. The method, therefore, is potential to be used as a rapid method for
quantification of adulterant in Luwak coffee.
Keywords:Luwak coffee, chemometrics, PLS1 regression, calibration, UV-Vis spectroscopy
1. INTRODUCTION
Coffee is one of the most popular beverages in the world (Duarteet al.,2005) with high
consumption level in developed countries; 4 kg per capita in the US and 5 kg per capita in
Europe
(http://www.worldmapper.org/posters/worldmapper_1038_coffee_consumption_ver2.pdf). On
other hand, coffee is mostly produced in several developing countries. Four countries account
Luwak coffee is a name for Arabica or Robusta coffee which has been eaten by Asian
palm civet (Paradoxurus hermaphroditus). The coffee bean which is eaten by Asian palm
civet (Paradoxurus hermaphroditus) is the best and ripest berries. After several hours inside
the civet animal, the best coffee berries passed through the digestive tract of civet animal
resulted in a unique flavour of Luwak coffee. This kind of unique production is a reason why
the production of Luwak coffee is very limited and worldwide it is approximately only
250-500 kg per year (http://www.most-expensive.coffee).
Luwak coffee is one of the most expensive and the rarest coffee in the world. Due to its
commercial importance, detection of adulterated matters has been a constant concern in fraud
verification, especially when it is difficult to percept adulterations with the naked eye in
samples of Luwak roasted coffee ground. The inspection of adulteration materials becomes
more difficult in samples of Luwak powder coffee. In Indonesia, Luwak coffee is adulterated
with other cheaper non-Luwak coffee. Around 70% of Luwak coffee or civet coffee available
at coffee stores and the internet (online store) is not 100% pure Luwak coffee and sometimes
it does not contain anything of the genuine coffee (http://www.most-expensive.coffee).
In order to protect the authenticity of Luwak coffee, it is important to develop a simple
method which can be used to detect and quantify the degree of adulteration. Recently, there is
no internationally accepted method of verifying whether a bean is civet coffee or Luwak
coffee. Traditionally, coffee aroma has been used to characterize coffee quality. Sensory
panel evaluation is commonly used to assess the aroma profile of coffee. However, this
technique has some limitations. For example, it is quite difficult to train the panel effectively
in order to limit subjectivity of human response to flavour and the variability between
individuals (Shilbayeh and Iskandarani, 2004). Human sensory method is also difficult to
verify the authenticity of Luwak coffee when a small amount of adulterated materials such as
cheaper non-Luwak coffee is added. Indonesia, as one of important player in Luwak coffee
production, is now just starting to develop an advanced technology for coffee processing. It is
including a search for a novel inspection system for Luwak coffees characterization.
This technology is very important for coffee industry to protect high expensive
Luwak coffees from any adulteration. In the previous study, Soutoet al.(2010) reported the use
of UV-Visible spectroscopy as an analytical method for the identification of adulterations in
ground roasted coffees (due to the presence of husks and sticks). This analytical method is one of
the most common and inexpensive techniques used in routine analysis and it will be compatible
we attempt to use UV-Visible spectra combined with PLS regression method to detect and
quantify content of adulterant in Luwak- Arabica blend coffee samples.
2. MATERIALS AND METHODS 2.1. Sample preparation
A number of 1 kg ground roasted Luwak coffee (Indonesian palm civet coffee) samples
were collected directly from coffee farmers at Liwa, Lampung, Indonesia (Hasti coffee
Lampung). Another 1 kg ground roasted Arabica coffee samples were also provided for
making Luwak coffee adulteration. All coffee samples were ground using a
home-coffee-grinder (Sayota). Since that particle sizes in coffee powder has significant influence to
spectral analysis, it is important to use same particle size in coffee powder samples (Suhandy
et al.,2016). In this research we use particle size of 420 µm by sieving through a nest of U. S.
standard sieves (mesh number of 40) on a Meinzer II sieve shaker (CSC Scientific Company,
Inc. USA) for 10 minutes. The experiments were performed at room temperature (around
27-29°C). In this research we prepare 30 samples of Luwak-Arabica blend coffee samples which
different content of adulteration. The adulteration content range is 0-50% by adding Arabica
coffee into Luwak coffee samples.
The spectral acquisition of Luwak-Arabica blends coffee samples were done in solution
samples. For this purpose, an aqueous extraction procedure of the coffee samples was
performed as described by Souto et al. (2010). First, 1.0 g of each sample was weighed and
placed in a glass beaker. Then, adding 10 mL of distilled water at 90-98°C then mixed with
magnetic stirring (Cimarec™ Stirrers, model S130810-33, Barnstead International, USA) at
350 rpm for 5 min. Then the samples were filtered using a 25 mm pore-sized quantitative
filter paper coupled with an erlenmeyer. After cooling process to room temperature (for 20
min), all extracts were then diluted in the proportion of 1:20 (mL: mL) with distilled water.
UV-Vis-NIR spectra from the aqueous extracts were acquired using a UV-Vis spectrometer
(Genesys™ 10S UV-Vis, Thermo Scientific, USA).
2.2. Spectral acquisition
The spectral data of coffee blend (Luwak-Arabica) were acquired using UV-Vis
spectrometer (Genesys™ 10S UV-Vis, Thermo Scientific, USA) in the range of 200-450 nm.
This spectrometer is a dual-beam spectrometer equipped with 5 cell sample holder and 1 cell
for blank or reference holder. The wavelength accuracy is 1 nm with dual silicon photodiodes
The absorbance data of Luwak-Arabica coffee blend in solution samples were acquired
in the range of 200-450 nm at room temperature. For this, we put 2 mL of solution samples
into cuvettes. Before the sample measurements step, blank (the same distilled water used in
extraction process) was placed inside reference cell holder to adjust the 100% transmittance signal.
2.3. PLS regression
The correlation between spectral data and content of adulteration (content of Arabica)
was investigated using partial least squares (PLS) regression. The spectral data has many
overlapped information. Some information is important and it has strong relation to the target
response (content of adulteration). However, some information is not related to the target
response. So, the general idea of PLS is to try to extract those information. PLS find several
latent factors which account for most of the variation in the response. For this reason, the
acronym PLS has also been taken to mean ‘‘projection to latent structure.’’ It should be
noted, however, that the term ‘‘latent’’ does not have the same technical meaning in the
context of PLS as it does for other multivariate techniques. In particular, PLS does not yield
consistent estimates of what are called ‘‘latent variables’’ in formal structural equation
modelling (Dykstra, 1983). PLS regression model has been used widely for multivariate data
analysis including spectral data for qualitative and quantitative analysis from UV to terahertz
region (Suhandyet al.,2012; Shanet al.,2014)
In this study, PLS regression model was developed using The Unscrambler® version
9.7 (CAMO, Oslo, Norway), statistical software for multivariate calibration. A student’s t-test
was performed using Statistical Package for the Social Science (SPSS) version 11.0 for
Windows in order to evaluate the significance level of the model.
3. RESULTS AND DISCUSSION
3.1. Spectral data of Luwak-Arabica coffee blend
In Fig. 1 we can see the original spectra of coffee blend (Luwak-Arabica) in the range
of 200-450 nm. We notice the difference of absorbance intensity due to difference of content
of adulterant (content of Arabica). However, the spectral difference is not consistent and it
may be due to baseline differences. In order to remove the influence of baseline effect, we
processed the spectra using smoothing and derivation algorithm (Savitzky-Golay 1st
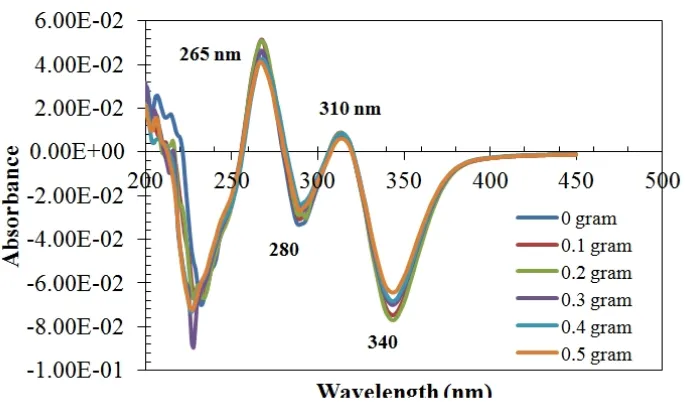
derivative with polynomial order 2 and number of segments 11) as shown in Fig. 2. Here we
can see that it is not easy to see the spectral differences among the samples having different
be related to the information of content of adulteration. The peak at 280 nm can be found
both in original and processed spectra. This wavelength is close to the wavelength related
to caffeine absorbance at 272 nm in the previous study (Belay et al., 2008). The shift of
caffeine absorbance peak (from 272 nm to 280 nm), it might be happen due to the presence of
other component in coffee solution (not pure distilled water).
Figure 1. Original spectra of coffee blend (Luwak-Arabica) with different content of adulterant (Arabica) in the range of 200-450 nm .
Figure 2. Processed spectra (smoothing +Savitzky-Golay derivation) of coffee blend (Luwak- Arabica) with different content of adulterant (Arabica) in the range of 200-450 nm.
3.2. Developing a PLS regression model for prediction content of adulteration
Here we perform a quantitative study for prediction content of adulteration in
or content of Arabica coffee added into Luwak-Arabica coffee blend as target response (y
variable). Fig. 3 shows the result of PLS regression model in calibration step. It can be seen
that there is a strong correlation between actual content of adulteration and predicted one
using UV-Vis spectra with high coefficient of determination (R2) = 0.99 and low RMSEC =
0.013884 gram. The developed PLS model was well validated as shown in Fig. 4. The
cross-validation resulted in low RMSECV = 0.044242 gram and low bias = 0.003850 gram.
Figure 3. Scatter plot between actual and predicted content
of adulteration in calibration step in the range 200-450 nm.
Figure 4. Scatter plot between actual and predicted content of adulteration in cross-validation step in the range 200-450 nm.
By a 95% confidence pair t-test, there were no significant differences between the
showed that a calibration model for determination content of adulteration in Luwak-Arabica
blend using UV-Visible spectroscopy could be well developed.
In order to understand the structure of the developed PLS model, we plot a relationship
between the wavelength and regression coefficient as shown in Fig. 5. It can be noticed
several wavelengths have significant value of regression coefficient. Those wavelengths are
275 nm, 300 nm, 342 nm and 378 nm. The wavelength at 275 nm is related to absorption of
caffeine. The wavelength at 300 nm may be related to absorption of caffeic acid (Souto et al.,
2010).
Figure 5. The regression coefficient versus wavelength plot of PLS model determination for prediction content of adulteration in Luwak-Arabica coffee blend.
This study has demonstrated the promising application of using PLS regression model
for prediction the content of adulteration in Luwak-Arabica blend coffee samples. The
developed PLS model resulted in a strong correlation between actual and predicted content of
adulteration with R2 = 0.99. The cross-validation resulted in low bias. By a 95% confidence
pair t-test, there were no significant differences between the actual content of adulteration and
that predicted by UV-Visible spectroscopy. This result may open a development of simple
and fast method to detect and quantify the content of adulteration in Luwak-Arabica blend
ACKNOWLEDGEMENT
This research is part of Penelitian Strategis Nasional (STRANAS) 2016 which is
funded by Ministry of Research, Technology and Higher Education
(KEMENRISTEKDIKTI) Indonesia (Nomor: 419/UN26/8/LPPM/2016). We acknowledge
this support. We thank also Hasti coffee Lampung for providing us the samples.
REFERENCES
Belay, A., Ture, K., Redi, M., and Asfaw, A. 2008. Measurement of caffeine in coffee beans with UV/vis spectrometer. Food Chemistry108: 310–315.
Dijkstra, T. 1983. Some comments on maximum likelihood and partial least squares methods.Journal of Econometrics,22: 67–90.
Duarte, S.M.d.S., Abreu, C.M.P.d., Menezes, H.C.d., Santos, M.H.d., Gouvea, C.M.C.P. 2005. Effect of processing and roasting on the antioxidant activity of coffee brews. Food Sci. Technol. (Campinas)25:387–393.
Shan, J., Suzuki, T., Suhandy, D., Ogawa, Y., and Kondo, N. 2014. Chlorogenic acid (CGA) determination in roasted coffee beans by Near Infrared (NIR) spectroscopy. Engineering in Agriculture, Environment and Food, 7(4): 139–142.
Shilbayeh, N.F. and Iskandarani, M.Z. 2004. Quality control of coffee using an electronic nose system. American Journal of Applied Sciences1(2): 129–135.
Souto, U.T.C.P., Pontes, M.J.C., Silva, E.C., Galvão, R.K.H., Araújo, M.C.U., Sanches, F.A.C., Cunha, F.A.S., and Oliveira, M.S.R. 2010. UV–Vis spectrometric classification of coffees by SPA–LDA. Food Chemistry119: 368–371.
Suhandy, D., Suzuki, T., Ogawa, Y., Kondo, N., Naito, H., Ishihara, T., and Liu, W. 2012. A Quantitative study for determination of glucose concentration using attenuated total reflectance terahertz (ATR-THz) spectroscopy. Engineering in Agriculture, Environment and Food,5(3): 90–95.