TNP2K
W
ORKING
P
APER
DETERMINANTS OF ACCESS TO SOCIAL
ASSISTANCE PROGRAMMES IN INDONESIA:
EMPIRICAL EVIDENCE FROM
THE INDONESIAN FAMILY LIFE SURVEY EAST 2012
JAN PRIEBE, FIONA HOWELL AND PAULINA PANKOWSKA
TNP2K WORKING PAPER 11b-2014
DETERMINANTS OF ACCESS TO SOCIAL
ASSISTANCE PROGRAMMES IN INDONESIA:
EMPIRICAL EVIDENCE FROM
THE INDONESIAN FAMILY LIFE SURVEY EAST 2012
JAN PRIEBE, FIONA HOWELL AND PAULINA PANKOWSKA
TNP2K WORKING PAPER 11b-2014
June 2014
The TNP2K Working Paper Series disseminates the fi ndings of work in progress to encourage discussion and exchange of ideas on poverty, social protection, and development issues. Support for this publication has been provided by the Australian Government through the Poverty Reduction Support Facility (PRSF). The fi ndings, interpretations and conclusions herein are those of the author(s) and do not necessarily refl ect the views of the Government of Indonesia or the Government of Australia.
You are free to copy, distribute, and transmit this work for noncommercial purposes.
Suggested citation: Priebe, J., F. Howell, and P. Pankowska. 2014. ‘Determinants of Access to Social As-sistance Programmes in Indonesia: Empirical Evidence from the Indonesian Family Life Survey (IFLS) East 2012’. TNP2K Working Paper 11b-2014. Tim Nasional Percepatan Penanggulangan Kemiskinan (TNP2K).
Jakarta, Indonesia.
To request copies of the report or for more information on the report, please contact the TNP2K Knowledge Management Unit ([email protected]). The papers are also available at the TNP2K website (www.tnp2k. go.id).
TNP2K
Grand Kebon Sirih Lt.4, Jl.Kebon Sirih Raya No.35, Jakarta Pusat, 10110 Tel: +62 (0) 21 3912812 Fax: +62 (0) 21 3912513 www.tnp2k.go.id
Determinants of Access to Social Assistance Programmes in Indonesia:
Empirical evidence from the Indonesian Family Life Survey East 2012
Jan Priebe, Fiona Howell and Paulina Pankowska
1ABSTRACT
In the past 15 years, the Government of Indonesia has implemented a variety of social assistance grammes intended to improve the lives of the poor and help them escape poverty. Many of these pro-grammes are now operating at a national scale and cover millions of Indonesians.
Using a new household survey dataset that covers the eastern areas of Indonesia (Indonesian Family Life Survey East 2012), this paper investigates the household-level determinants of access to social assistance programmes. The analysis reveals that social assistance programmes are relatively more available in poorer provinces and that poorer households—all things being equal—are more likely to access social assistance programmes than nonpoor households, which suggests that social assistance programmes in eastern Indonesia are successful in their efforts to target the poor (poverty targeting), both across regions and households. However, poverty targeting still has scope for improvement in terms of accuracy.
Besides the poverty status (as measured in per capita consumption expenditures), the authors found that several other factors infl uence programme access. Having a disabled household member or having a household head who is a widow(er) appears to increase the likelihood of receiving social assistance programmes. Likewise, the level of trust and confl ict in a community affects access to social assis-tance programmes. Particularly in the case of Raskin, we found that the programme is distributed more widely among those communities that are characterized by higher levels of confl ict and lower levels of trust. The authors did not fi nd that poor access to infrastructure and remoteness infl uences household access to social assistance programmes once they controlled for province fi xed effects in the regres-sion framework. Furthermore, the fi ndings suggest that possesregres-sion of a local ‘poverty letter’ strongly improves household access to social assistance programmes, even after controlling for a wide set of socioeconomic characteristics. In general, determinants of programme access differ signifi cantly among provinces and between rural and urban areas.
Keywords: social assistance, Indonesia, poverty, targeting, welfare.
1 Jan Priebe ([email protected] or [email protected]) is a senior economist at TNP2K’s Cluster 1 team. Fiona
Howell is the social assistance policy advisor in TNP2K, Government of Indonesia. Paulina Pankowska is currently associate analyst at Rand Corporation (Rand Europe).
vi
Table of Contents
Abbrevia ons ... ix
1. Introduc on ... 1
2. Data Descrip on ... 3
3. Overview of Social Assistance Programmes in Eastern Indonesia ... 4
Coverage Rates of Selected Social Assistance Programmes ... 4
Coverage Rates by Wealth Levels ... 6
Coverage Rates by Wealth Levels of Vulnerable Groups ... 9
Coverage Rates by Wealth Levels in Rural and Urban Areas... 13
4. Determinants of Access to Social Assistance Programmes ... 18
Access to Raskin ... 18
Access to Kartu Sehat ... 24
Access to BSM ... 29
5. Raskin: Quan es and Prices ... 33
Overview of Quan es and Prices ... 33
Raskin by Expenditure Decile ... 35
Diff erences between Rural and Urban Areas ... 37
6. Overview of SKTM ... 39
Coverage Rates and Poverty ... 39
Determinants of Access to SKTM ... 41
7. Summary ... 46
References ... 48
List of Figures
Figure 1: Number (Unweighted) of Households Surveyed in IFLS East 2012 by Province ... 3
Figure 2: Coverage Rates of Social Assistance Programmes Poverty Rates and Expenditure by Province ... 5
Figure 3: Coverage Rates of Selected Social Assistance Programmes by Expenditure Decile ... 7
Figure 4: Coverage Rates of Selected Social Assistance Programmes by Asset Index Decile ... 8
Figure 5: Coverage Rates of Social Assistance Programmes by Rural/Urban Area ... 14
Figure 6: Coverage Rates of Social Assistance Programmes for Urban Areas by Province ... 14
Figure 7: Coverage Rates of Social Assistance Programmes for Rural Areas by Province ... 15
Figure 8A: Coverage Rates of Social Assistance Programmes for Urban Areas by Expenditure Decile ... 16
Figure 8B: Coverage Rates of Social Assistance Programmes for Rural Areas by Expenditure Decile ... 17
Figure 9: Raskin (Coverage, Quan ty, and Price) and Poverty Rates by Province ... 35
Figure 10: Raskin (Coverage, Quan ty, Price, and Quality) by Expenditure Decile ... 36
Figure 11: Raskin for Urban Areas by Expenditure Decile ... 38
Figure 12: Raskin for Rural Areas by Expenditure Decile ... 38
Figure 13: Coverage Rates of SKTM and Poverty Rate by Province ... 39
Figure 14: Coverage Rates of SKTM by Asset and Expenditure Decile ... 40
viii
List of Tables
Table 1: Coverage Rates of Social Assistance Programmes, Poverty Rates, and
Expenditure by Province ... 5
Table 2: Coverage Rates of Selected Social Assistance Programmes by Expenditure Decile ... 7
Table 3: Coverage Rates of Selected Social Assistance Programmes by Asset Index Decile ... 8
Table 4: Coverage Rates of Selected Social Assistance Programmes by Expenditure Decile and Disability ... 10
Table 5: Coverage Rates of Selected Social Assistance Programmes by Expenditure Decile and Widow/Non-Widow Status ... 11
Table 6: Coverage Rates of Selected Social Assistance Programmes by Expenditure Decile and Gender of Household Head ... 12
Table 7: Coverage Rates of Selected Social Assistance Programmes by Rural/Urban Area and Province ... 13
Table 8: Coverage Rates of Social Assistance Programmes by Rural/Urban Area and Expenditure Decile ... 16
Table 9: Linear Probability Model, Dependent Variable: Raskin (1=yes, 0=no) ... 21
Table 10: Linear Probability Model, Dependent Variable: Raskin (1=yes, 0=no), Urban Areas ... 22
Table 11: Linear Probability Model, Dependent Variable: Raskin (1=yes, 0=no), Rural Areas ... 23
Table 12: Linear Probability Model, Dependent Variable: Kartu Sehat (1=yes, 0=no) ... 26
Table 13: Linear Probability Model, Dependent Variable: Kartu Sehat (1=yes, 0=no), Urban Areas ... 27
Table 14: Linear Probability Model, Dependent Variable: Kartu Sehat (1=yes, 0=no), Rural Areas ... 28
Table 15: Linear Probability Model, Dependent Variable: BSM (1=yes, 0=no) ... 30
Table 16: Linear Probability Model, Dependent Variable: BSM (1=yes, 0=no), Urban Areas ... 31
Table 17: Linear Probability Model, Dependent Variable: BSM (1=yes, 0=no), Rural Areas ... 32
Table 18: Raskin (Coverage, Quan ty, Price, and Quality) and Poverty Rates by Province ... 34
Table 19: Raskin (Coverage, Quan ty, Price, and Quality) by Expenditure Decile ... 36
Table 20: Raskin by Rural/Urban Area and Expenditure Decile ... 37
Table 21: Linear Probability Model, Dependent Variable: SKTM (1=yes, 0=no) ... 43
Table 22: Linear Probability Model, Dependent Variable: SKTM (1=yes, 0=no), Urban Areas ... 44
Table 23: Linear Probability Model, Dependent Variable: SKTM (1=yes, 0=no), Rural Areas ... 45
Table A.1: Descrip on of the Social Assistance Programmes Covered in IFLS-East 2012 ... 49
Table A.2: Coverage Rates of Social Assistance Programmes in the IFLS East 2012 by Province ... 50
Table A.3: Coverage Rates of Social Assistance Programmes in the IFLS East 2012 by Province and Expenditure Quin le ... 51
Table A.4: Descrip on of Variables Used in the Construc on of the Asset Index ... 52
Abbreviations
ASLUT Asistensi Sosial Usia Lanjut (Social Assistance for Older Persons)
ASODKB Asistensi Sosial untuk Orang Dengan Kecacatan Berat (Social Assistance for Severely Disabled People)
BLT Bantuan Langsung Tunai (Unconditional Cash Transfer)
BPS Badan Pusat Statistik (Central Bureau of Statistics)
BSM Bantuan Siswa Miskin (Social Assistance for Poor Students)
HH household
IFLS Indonesian Family Life Survey
Jamkesda Jaminan Kesehatan Daerah (Regional Health Insurance)
Jamkesmas Jaminan Kesehatan Masyarakat (Health Insurance for the Poor)
NTT Nusa Tenggara Timur
PKH Program Keluarga Harapan (Family Hope Programme)
PKSA Program Kesejahteraan Sosial Anak (Child Social Welfare Programme)
Raskin Beras Miskin (Rice for Poor Households)
Rp Rupiahs
SKTM Surat Keterangan Tidak Mampu (poverty letter)
1. Introduction
Despite strong economic growth and falling poverty in the past decade, many households continue to live on the edge of poverty in Indonesia. Although poverty rates have fallen from 23.4 percent in 1999 to 11.37 percent in 2013, much of Indonesia’s population is clustered just above the poverty line (Cen-tral Bureau of Statistics 2013). According to the World Bank (2012g and 2012e), around 24 percent of Indonesians lived below the offi cial Indonesian near-poor poverty line in 2011 (1.2 times the normal poverty line), whereas about 38 percent of the population lived below 1.5 times the poverty line.
Due to the high poverty levels during the 1997/1998 economic and fi nancial crises as well as in the context of fuel subsidy cuts in 2005, the Government of Indonesia introduced a variety of social assis-tance programmes intended to fi ght poverty and break intergenerational transmission of poverty in the country.1 The largest social assistance programmes include the following:
• Social Assistance for Poor Students (Bantuan Siswa Miskin or BSM) • Rice for Poor Households (Beras Miskin or Raskin)
• Health Insurance for the Poor (Jaminan Kesehatan Masyarakat or Jamkesmas) • Regional Health Insurance (Jaminan Kesehatan Daerah or Jamkesda)
These larger programmes have been supplemented by smaller social assistance programmes that are increasingly operating at a larger, even national, scale. For example, these include:
• Social Assistance for Older Persons (Asistensi Sosial Usia Lanjut or ASLUT)
• Social Assistance for Severely Disabled People (Asistensi Sosial untuk Orang Dengan Kecacatan Berat or ASODKB)
• Child Social Welfare Programme (Program Kesejahteraan Sosial Anak or PKSA) • Family Hope Programme (Program Keluarga Harapan or PKH)
All the social assistance programmes provide important benefi ts to their recipients. However, many of the social assistance programmes suffer from targeting problems, that is, not covering all the poor or wrongly including rich households (World Bank 2012g and 2012e). Empirical evidence is limited on the factors that determine a household’s access to or inclusion in social assistance programmes, espe-cially for poor households and groups vulnerable to poverty in eastern Indonesia.
The objective of this paper is therefore to shed light on the targeting accuracy of social assistance pro-grammes in eastern Indonesia and to provide a better understanding of how these propro-grammes operate at the local level, especially regarding the factors that infl uence household access to social assistance programmes.
1 Social assistance is defi ned in this report as cash or in-kind social transfers, subsidies, or fee waivers designed for
2
In order to address the objective, we made use of the fi rst round of the Indonesian Family Life Survey (IFLS) for the eastern areas of Indonesia (IFLS East 2012), collected in 2012 by SurveyMETER on behalf of TNP2K. Using this new dataset programme has several advantages:
• Compared with other surveys in Indonesia, the IFLS East 2012 collects more detailed infor-mation on social assistance programmes and on factors that affect the allocation of these pro-grammes. For instance, the IFLS East 2012 covers information on the Unconditional Cash Transfer (Bantuan Langsung Tunai or BLT), BSM, Jamkesmas, Dana Sehat (Health Fund, a prepaid health scheme operating at the community level), and Raskin programmes in more detail than the National Social and Economic Survey (Survey Sosial dan Ekonomi Nasional or Suse-nas) rounds conducted by the Central Bureau of Statistics (Badan Pusat Statistik or BPS). • Likewise, the IFLS East 2012 captures information on many important background variables—
such as access to infrastructure (e. g., access to electricity or shorter distance to health centres) and the level of confl ict and trust within the local community—which are likely to infl uence the way social assistance programmes operate and are implemented at the local level.
• The IFLS East 2012 can be considered to be a dataset of very high quality; its questionnaire de-sign, training of enumerators, and sampling strategy closely follow those in IFLS rounds in 1993, 1997, 2000, and 2006, the results of which have been used in many academic studies. Survey-METER worked with the Rand Corporation in designing and implementing the IFLS rounds from 2000 and 2006 and followed the same standards in implementing IFLS East 2012.
2. Data
Description
This paper uses data from the Indonesian Family Life Survey East 2012. The IFLS East 2012 follows the same survey structure (sampling, questionnaires, and enumerator training) of IFLS rounds in 1993, 1997, 2000, and 2006. In contrast, however, the IFLS East 2012 focuses exclusively on the eastern part of Indonesia and covers seven provinces:, Kalimantan Timur, Maluku, Maluku Utara, Nusa Tenggara Timur (NTT), Papua Barat, Papua, and Sulawesi Tenggara.
In each of these provinces, 14 villages—both rural and urban (desa and kelurahan) were randomly selected for inclusion in the survey2. Subsequently, a pre-determined number of households in each
village was randomly selected (20 households in each urban village and 30 households in each rural village)3. Overall, about 3,150 households were interviewed, spread across 99 villages. However,
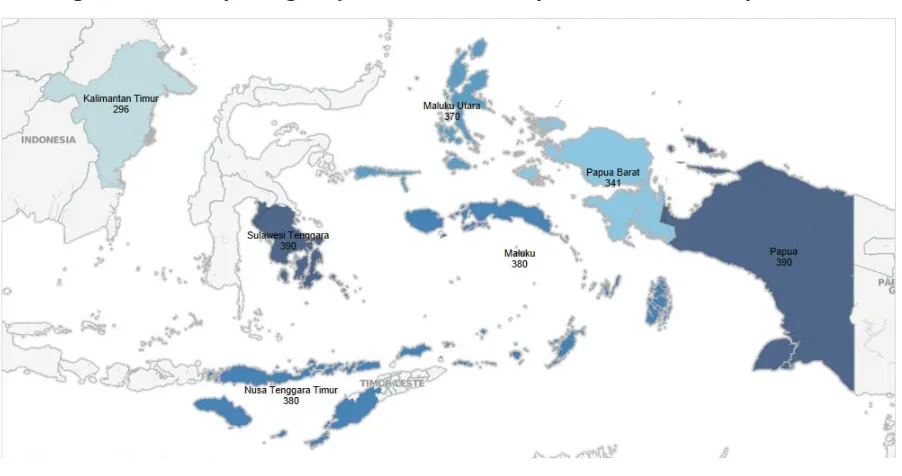
com-plete interviews were conducted in 2,547 households, which constitute the overall sample of this study. Figure 1 shows the distribution of surveyed households across the provinces.
Figure 1: Number (Unweighted) of Households Surveyed in IFLS East 2012 by Province
2 The sampling frame for the selection of villages was based on the villages included in the Susenas July 2010 round.
There-fore, only a sub-sample of all villages in Indonesia constitutes the sampling frame.
3 In cases of household refusal to participate in the survey or failure to contact the households, replacement households were
4
3. Overview of Social Assistance Programmes in Eastern Indonesia
Coverage Rates of Selected Social Assistance Programmes
The IFLS East 2012 collected detailed information on individual/household access and coverage of some of Indonesia’s major social assistance programmes—most notably Raskin, Health Card or Kartu Sehat (Jamkesmas)4, Dana Sehat, BLT, BSM, ASLUT, Disability Benefi ts, PKSA, and the Troubled
Youth Programme5. The IFLS East 2012 also asked questions about whether a household possesses a
poverty letter (surat keterangan tidak mampu or SKTM)6.
Because some of the programmes (ASLUT, Disability Benefi ts, PKSA, and the Troubled Youth Pro-gramme) are characterised by very low coverage rates in the seven IFLS East 2012 provinces, they were not included in the main analysis7.
Table 1 and fi gure 2 present coverage rates for each of the social assistance programmes8. The data
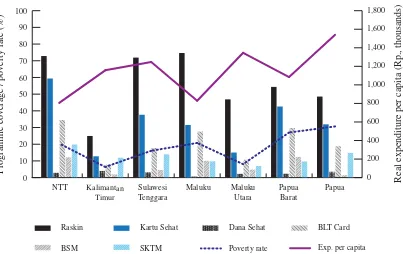
show that Raskin has the highest coverage rates: about 54 percent of households report having received Raskin within the preceding 12 months. As expected, coverage rates vary a great deal across provinces: Kalimantan Timur shows the lowest (24.95 percent) and Maluku (74.67 percent) the highest coverage rates. The Kartu Sehat programme (Jamkesmas/Jamkesda) has the second highest coverage rates (34.43 percent); its provincial coverage rates range from 12.76 percent in Kalimantan Timur to 59.38 percent in Nusa Tenggara Timur. The Kartu Sehat is followed by BLT (20.64 percent), BSM (5.97 percent), and Dana Sehat (3.1 percent). The provincial coverage rates for BLT range from 7.63 percent (Kalimantan Timur) to 34.55 percent (Nusa Tenggara Timur), for BSM from 1.45 percent (Papua) to 12.4 percent (Papua Barat), and for Dana Sehat from 0.63 percent (Maluku) to 4.00 percent (Kalimantan Timur). Furthermore, about 14.21 percent of surveyed households stated they possessed an SKTM, ranging from 6.99 percent in Maluku Utara to 19.8 percent in NTT.
Noteworthy regional variations exist in the coverage of social assistance programmes. NTT, for exam-ple, has high coverage rates for social assistance programmes compared with all other eastern provinc-es, except for the Dana Sehat program. This is a positive result because NTT has the lowest average real expenditures per capita among all seven provinces surveyed in the IFLS East 2012, while it has one of the highest poverty rates in Indonesia (see table 1 and fi gure 3). Likewise, Kalimantan Timur, which has one of the lowest poverty rates in Indonesia, has relatively low overall coverage rates with social assistance programmes.
4 If the household has the Jamkesda card, it is also likely to be included in the Kartu Sehat programme.
5 In Indonesia, the Disability Benefi ts and Troubled Youth programmes are referred to respectively as Program Jaminan Sosial
Penyandang Cacat or PJSPC, and Program Bantuan Santunan Anak Muda Bermasalah. Questions on PKH were not included in the IFLS East 2012 because, in 2012, PKH operated only in a very limited number of areas that were part of the IFLS East 2012.
6 The possession of an SKTM can give households access to a variety of social assistance programmes (including some of
the programmes not covered in the IFLS East 2012). Ownership of an SKTM can function as a general proxy for access to social assistance programmes at the local level. Therefore, we included the SKTM in our list of social assistance programmes.
7 See table A.1 in the appendix for the coverage rates of all the social assistance programmes for which data were collected
in the IFLS East 2012.
Table 1: Coverage Rates of Social Assistance Programmes, Poverty Rates, and
NTT 72.83 59.38 2.89 34.55 12.16 19.80 805.95 20.41
Kalimantan Timur 24.95 12.76 4.00 7.63 1.95 11.91 1,156.67 6.38
Sulawesi Tenggara 71.90 37.65 3.19 17.77 4.55 13.98 1,247.20 13.06
Maluku 74.67 31.54 0.63 27.57 10.02 9.79 829.37 20.76
Maluku Utara 46.88 15.02 2.25 10.78 4.79 6.99 1,346.00 8.06
Papua Barat 54.35 42.60 2.32 29.76 12.40 9.68 1,084.17 27.04
Papua 48.55 31.93 3.55 18.84 1.45 14.77 1,539.49 30.66
All provinces 54.12 34.43 3.10 20.64 5.97 14.21 1,140.70 –
Note: Poverty rate refers to the offi cial BPS poverty rate for September 2012. Expenditures per capita were obtained by dividing average monthly household expenditures by household size and adjusting for spatial price differences by using BPS’s offi cial poverty lines for September 2012 (rural and urban province-specifi c poverty lines). Survey weights applied.
Figure 2: Coverage Rates of Social Assistance Programmes Poverty Rates and Expenditure by Province
In general, social assistance programmes in eastern Indonesia appear to be relatively more available in areas where poverty rates are higher, which suggests that social assistance programmes are targeted towards poor regions. However, the observed relationship between poverty rates and coverage by social assistance programmes is not perfect. Based on IFLS East 2012 data, one would expect some provinces to have higher or lower coverage rates when benchmarked against the offi cial province poverty rates.
0
Raskin Kartu Sehat BLT Card
BSM SKTM Poverty rate Exp. per capita
Programme coverage / poverty rate (%)
Real expenditure per capita (Rp., thousands)
6
Coverage Rates by Wealth Levels
There is a debate in Indonesia on how well social assistance programmes are targeted towards the poor and how to improve targeting (Olken 2006, Alatas et al. 2013a, Alatas et al. 2013b)9. To assess
target-ing effectiveness for the different social assistance programmes, we classifi ed households into deciles, ranging from poor (1st decile) to rich (10th decile), based on household expenditures per capita10
infor-mation.
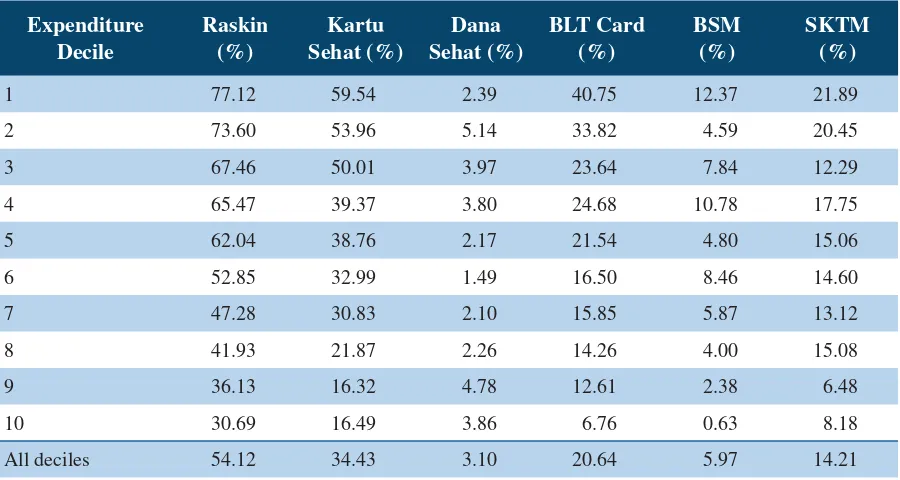
Table 2 and fi gure 3 depict coverage rates for each of the social assistance programmes by household expenditure data. Apart from BSM and Dana Sehat, most programmes appear to show continuously declining coverage rates along the wealth distribution (from poor to rich)11.
The results show that Raskin has the highest coverage rates across all deciles, ranging from 30.69 per-cent in the 10th (richest) decile to 77.12 perper-cent in the 1st (poorest) decile.
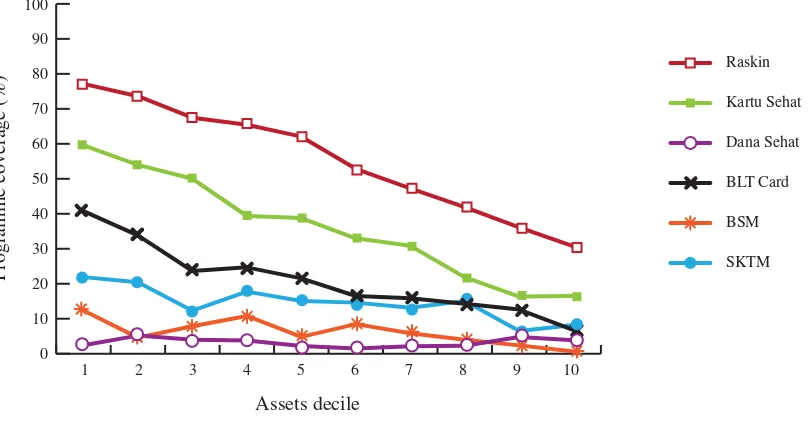
However, all of these programmes provide a substantial share of their benefi ts to households in richer deciles, undermining the poverty targeting effi ciency. Although all programmes face this problem, the leakage of benefi ts in Raskin is the strongest12; a very large share of non-poor and richer households
receive Raskin. The negative slope of Raskin coverage rates (fi gure 4) implies that the likelihood of receiving Raskin decreases substantially with higher wealth levels. The slopes of the other programmes, such as BSM and SKTM, are much fl atter, indicating that they are marginally less able to distinguish between the poor and the nonpoor.
In order to check for robustness and consistency of the fi ndings described above, we contrasted the results using an asset index rather than per capita expenditures as a wealth proxy13. Table 3 and fi gure
4 present the results obtained using an asset index, which largely confi rm the previous fi ndings when using expenditure per capita as a measure of welfare.
9 It is important to note that, when analysing coverage rates across deciles, the targeting accuracy of a programme tends to
look slightly worse compared with its true accuracy. This is because the statistics are calculated over a household’s wealth status after receiving the programme (ex post), while ideally an assessment of the targeting accuracy of a programme is based on a household’s wealth status before receiving the programme (ex ante).
10 The nominal expenditure values provided in IFLS East 2012 were adjusted using the ratio of BPS poverty lines for
Septem-ber 2012 as a spatial price defl ator in order to derive real expenditure values.
11 In the case of BSM, coverage rates only start to show declining trends for higher wealth levels (deciles 9 and 10). Dana
Sehat, however, does not exhibit any clear relationship between wealth levels and coverage rates.
12 Leakage refers to share of benefi ts received by non-poor households.
13 The asset index is based on principal component analysis (Filmer and Pritchett 2001). The following variables were used
Table 2: Coverage Rates of Selected Social Assistance Programmes by Expenditure Decile
1 77.12 59.54 2.39 40.75 12.37 21.89
2 73.60 53.96 5.14 33.82 4.59 20.45
3 67.46 50.01 3.97 23.64 7.84 12.29
4 65.47 39.37 3.80 24.68 10.78 17.75
5 62.04 38.76 2.17 21.54 4.80 15.06
6 52.85 32.99 1.49 16.50 8.46 14.60
7 47.28 30.83 2.10 15.85 5.87 13.12
8 41.93 21.87 2.26 14.26 4.00 15.08
9 36.13 16.32 4.78 12.61 2.38 6.48
10 30.69 16.49 3.86 6.76 0.63 8.18
All deciles 54.12 34.43 3.10 20.64 5.97 14.21
Note: Expenditures per capita were obtained by dividing average monthly household expenditures by household size and adjusting for spatial price differences by using BPS’s offi cial poverty lines. Survey weights applied.
Figure 3: Coverage Rates of Selected Social Assistance Programmes by Expenditure Decile
8
Table 3: Coverage Rates of Selected Social Assistance Programmes by Asset Index Decile
Asset Decile Raskin
1 76.69 54.99 5.21 36.28 15.28 24.32
2 69.03 47.75 3.49 31.09 9.89 22.41
3 65.96 41.00 7.14 25.70 6.21 21.15
4 61.48 34.43 2.82 18.98 8.44 14.63
5 53.66 39.00 2.72 21.01 7.30 15.93
6 45.98 26.37 3.74 16.84 7.47 14.14
7 51.07 31.86 1.56 20.86 3.81 8.31
8 54.91 32.20 1.01 16.46 2.39 13.37
9 44.55 28.75 1.76 17.03 2.07 6.30
10 33.32 20.26 3.03 11.32 1.25 5.13
All deciles 76.69 54.99 5.21 36.28 15.28 24.32
Note: Expenditures per capita were obtained by dividing average monthly household expenditures by household size and adjusting for spatial price differences by using BPS’s offi cial poverty lines. Survey weights applied.
Figure 4: Coverage Rates of Selected Social Assistance Programmes by Asset Index Decile
Coverage Rates by Wealth Levels of Vulnerable Groups
Social assistance programmes should, by design, be targeted towards the poor. The previous section showed that the poorer the household, the more likely it is to be included in a particular programme. Be-sides the poverty criteria, policy makers are also concerned with the inclusion of particular vulnerable groups in society whose poverty rates are signifi cantly higher than among the general population and who might face informal restrictions in accessing social assistance programmes. Because nearly none of the Indonesian social assistance programmes considered here mentioned particular vulnerable sub-groups as their specifi c target benefi ciaries, it is ultimately an empirical question to assess whether be-ing part of a particular vulnerable group affects programme access and, if so, whether vulnerable groups receive preferential access to social assistance programmes or face more diffi culties in accessing them.
The subsequent analysis focuses on three different vulnerable groups: households with a disabled per-son, households whose head is a widow(er), and households whose head is a woman.
Disability
Table 4 shows coverage rates (percentage) of social assistance programmes by wealth level and by whether a household has a person with a disability or not14. Our descriptive results suggest that
disabil-ity is an important factor in accessing Raskin, Kartu Sehat, BLT, and to a smaller extent, BSM. On the one hand, among these four programmes, households with a member with a disability are more likely to receive social assistance programmes across all wealth deciles than households who do not have a household member with a disability. On the other hand, disability does not seem to play a role as a cri-terion for access to the Dana Sehat and SKTM programmes.
Household Head Is Widow(er)
Table 5 presents results on coverage rates (percentage) of social assistance programmes by wealth level and by whether the household head is a widow(er). We found that households with a widow(er) ap-pear to have higher coverage rates across all wealth levels for the Raskin, Kartu Sehat, BLT, and BSM programmes, although for Dana Sehat and SKTM, fewer differences exist in coverage rates between widow(er) and non-widow(er) households.
Women as Household Head
The Government of Indonesia has recently initiated the Empowering Women for Poverty Reduction (Maju Perempuan Indonesia untuk Penanggulangan Kemiskinan or MAMPU) project, which empha-sises that female-headed households are an important vulnerable group whose welfare status and eco-nomic potential needs improvement. Likewise, strong empirical evidence exists from many countries in the world, including Indonesia, that poverty rates among female-headed households are often higher than those among male-headed households (Pekka 2014). Table 6 shows coverage rates of selected social assistance programmes by wealth level and by the gender of the household head. In contrast to the disability and widow(er) analyses, for most social assistance programmes, the sex of the household head does not seem to be strongly correlated with programme access.
14 A person is defi ned as disabled if s/he has signifi cant diffi culties in at least 1 of the 17 selected disability variables (detailed
10
Table 4: Coverage Rates of Selected Social Assistance Programmes by Expenditure Decile and Disability
Expenditure Decile
Raskin (%) Kartu Sehat (%) Dana Sehat (%) BLT Card (%) BSM (%) SKTM (%) HH (number)
Disability No
Disability Disability
No
Disability Disability
No
Disability Disability
No
Disability Disability
No
Disability Disability
No
Disability Disability
No Disability
1 90.91 76.21 62.80 59.33 0.00 2.55 68.33 38.94 37.02 10.75 26.33 21.59 15 229
2 92.45 72.09 69.78 52.70 0.00 5.55 41.12 33.23 11.70 4.02 8.45 21.41 19 224
3 86.70 66.11 52.59 49.83 0.00 4.25 27.79 23.35 5.03 8.04 23.36 11.51 19 225
4 55.16 66.06 30.95 39.86 10.52 3.41 2.62 25.96 2.67 11.25 0.00 18.77 14 229
5 89.33 60.30 30.51 39.28 0.00 2.31 11.46 22.18 4.50 4.82 6.13 15.63 15 229
6 83.25 50.81 50.27 31.83 0.00 1.59 37.82 15.07 8.06 8.49 20.88 14.18 15 228
7 51.70 47.02 24.35 31.21 0.00 2.23 0.00 16.77 10.71 5.60 10.71 13.25 14 230
8 56.07 40.92 41.77 20.44 0.00 2.42 20.98 13.78 0.00 4.29 31.51 13.90 17 226
9 53.27 35.33 42.71 15.09 9.06 4.58 30.67 11.77 0.00 2.49 0.00 6.78 10 234
10 35.28 30.46 24.19 16.11 15.23 3.30 30.16 5.60 0.00 0.66 5.19 8.33 13 230
All deciles 69.93 53.14 43.79 33.85 2.81 3.12 26.94 20.25 7.69 5.87 14.43 14.20 151 2,284
11
Table 5: Coverage Rates of Selected Social Assistance Programmes by Expenditure Decile and Widow/Non-Widow Status
Expenditure Decile
Raskin (%) Kartu Sehat (%) Dana Sehat (%) BLT Card (%) BSM (%) SKTM (%) HH (number)
Widow Not a
widow Widow
Not a
widow Widow
Not a
widow Widow
Not a
widow Widow
Not a
widow Widow
Not a
widow Widow
Not a widow
1 100.00 75.38 29.88 61.80 0.00 2.57 62.54 39.09 15.40 12.14 30.70 21.22 13 231
2 72.63 73.70 70.38 52.20 0.00 5.69 47.65 32.33 9.67 4.04 4.40 22.17 21 222
3 82.56 66.51 74.08 48.50 0.00 4.22 37.32 22.78 8.70 7.79 9.43 12.47 18 226
4 59.72 66.37 22.02 42.11 5.14 3.59 15.35 26.15 30.31 7.70 4.18 19.89 29 214
5 70.82 61.20 46.37 38.04 0.00 2.38 21.86 21.51 7.73 4.53 20.89 14.51 22 222
6 79.93 50.65 55.00 31.20 0.00 1.61 24.98 15.81 37.61 6.10 11.83 14.82 13 230
7 48.00 47.19 36.73 30.13 0.00 2.36 15.16 15.94 10.97 5.26 20.94 12.18 26 218
8 77.62 38.61 43.30 19.87 0.00 2.47 14.53 14.24 6.67 3.76 16.00 14.99 21 222
9 44.92 34.75 42.90 12.16 8.20 4.24 27.70 10.25 1.74 2.48 9.43 6.02 30 214
10 41.87 28.85 21.30 15.70 7.30 3.29 14.53 5.48 0.00 0.73 5.89 8.56 32 211
All deciles 62.09 53.25 40.76 33.74 2.84 3.13 25.82 20.07 11.70 5.35 12.34 14.42 225 2,210
12
Table 6: Coverage Rates of Selected Social Assistance Programmes by Expenditure Decile and Gender of Household Head
Expenditure
1 90.29 75.52 45.32 61.27 0.00 2.68 44.55 40.29 11.66 12.45 28.37 21.10 30 204
2 79.46 72.58 61.07 52.74 0.00 6.03 46.27 31.66 5.85 4.37 12.82 21.77 34 209
3 65.27 67.85 46.32 50.67 0.00 4.68 31.18 22.29 9.97 7.46 13.09 12.15 36 208
4 64.41 65.65 30.97 40.84 5.58 3.49 17.87 25.87 29.66 7.48 15.63 18.12 34 209
5 62.12 62.02 39.78 38.59 1.98 2.20 24.60 21.02 3.84 4.97 20.99 14.06 36 208
6 53.96 52.58 41.94 30.89 1.15 1.57 15.89 16.64 15.20 6.88 4.67 16.93 40 203
7 43.35 48.20 32.82 30.37 3.75 1.72 14.39 16.20 7.10 5.58 18.48 11.85 44 200
8 59.18 39.44 29.12 20.82 0.00 2.58 12.02 14.59 7.33 3.52 5.96 16.39 29 214
9 33.42 37.08 22.73 14.07 7.72 3.75 15.19 11.70 0.00 3.21 6.30 6.54 57 187
10 33.58 29.66 14.31 17.27 0.33 5.11 8.08 6.29 0.00 0.85 7.42 8.45 56 187
All deciles 54.54 52.12 34.68 33.24 3.26 2.31 20.64 20.64 5.60 7.75 14.74 11.69 396 2,039
Coverage Rates by Wealth Levels in Rural and Urban Areas
As in most countries in the world, Indonesian poverty rates are signifi cantly higher in rural areas com-pared with urban areas. One might then expect that a higher share of the rural population would be cov-ered by social assistance programmes compared with the urban population. However, due to diffi cult access to eastern Indonesian villages and high transportation costs in eastern Indonesia, it is not clear a priori whether and on what scale a particular social assistance programme operates in rural areas. Furthermore, there are likely to be important differences in the role of cultural and community norms in rural and urban areas that could affect coverage rates of the various programmes differently in rural and urban areas.
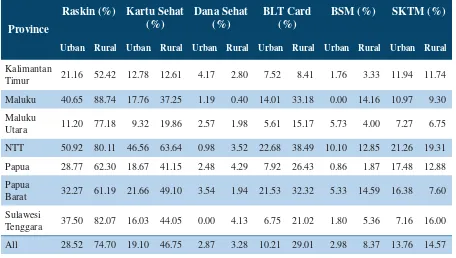
Table 7 and fi gures 5, 6, and 7 show coverage rates for the different programmes by rural and urban status. Except for SKTM and Dana Sehat, all social assistance programmes reach signifi cantly higher coverage rates in rural compared with urban areas (fi gure 5), indicating pro-poor regional targeting in programme implementation. However, some notable exceptions exist by province and social assistance programme, for instance, higher BSM coverage rates in urban compared with rural Maluku Utara.
Furthermore, fi gures 6 and 7 show a positive correlation across the various social assistance programmes in both rural and urban areas; high coverage rates in a particular province for a specifi c programme are usually associated with relatively high coverage rates for the remaining programmes and vice versa. Those correlations are particularly noticeable in the case of Raskin, Kartu Sehat, and BLT.
Table 7: Coverage Rates of Selected Social Assistance Programmes by Rural/Urban Area and Province
Province
Raskin (%) Kartu Sehat (%)
Dana Sehat (%)
BLT Card (%)
BSM (%) SKTM (%)
Urban Rural Urban Rural Urban Rural Urban Rural Urban Rural Urban Rural
Kalimantan
Timur 21.16 52.42 12.78 12.61 4.17 2.80 7.52 8.41 1.76 3.33 11.94 11.74
Maluku 40.65 88.74 17.76 37.25 1.19 0.40 14.01 33.18 0.00 14.16 10.97 9.30
Maluku
Utara 11.20 77.18 9.32 19.86 2.57 1.98 5.61 15.17 5.73 4.00 7.27 6.75
NTT 50.92 80.11 46.56 63.64 0.98 3.52 22.68 38.49 10.10 12.85 21.26 19.31
Papua 28.77 62.30 18.67 41.15 2.48 4.29 7.92 26.43 0.86 1.87 17.48 12.88
Papua
Barat 32.27 61.19 21.66 49.10 3.54 1.94 21.53 32.32 5.33 14.59 16.38 7.60
Sulawesi
Tenggara 37.50 82.07 16.03 44.05 0.00 4.13 6.75 21.02 1.80 5.36 7.16 16.00
All 28.52 74.70 19.10 46.75 2.87 3.28 10.21 29.01 2.98 8.37 13.76 14.57
14
Figure 5: Coverage Rates of Social Assistance Programmes by Rural/Urban Area
Figure 6: Coverage Rates of Social Assistance Programmes for Urban Areas by Province
0 10 20 30 40 50 60 70 80 90 100
Programme coverage (%)
NTT
Kalimantan
T
imur
Sulawesi Tenggara Maluku Maluku
Utara Papua Barat Papua
Overall IFLS
East 2012
Raskin
Kartu Sehat
Dana Sehat
BLT Card
BSM
SKTM
Programme coverage (%)
Urban
Kartu Sehat Dana Sehat BLT Card BSM SKTM
Rural 0
10 20 30 40 50 60 70 80 90 100
Figure 7: Coverage Rates of Social Assistance Programmes for Rural Areas by Province
Commonalities as well as crucial differences exist with respect to coverage rates across wealth deciles between rural and urban areas. As shown in table 8, in both rural and urban areas, coverage rates along the wealth distribution (from poor to rich) tend to decrease, apart from BSM and Dana Sehat.
The coverage rates per expenditure decile for rural and urban areas (table 8 and fi gures 8A and 8B) support a similar conclusion. For the majority of programmes and expenditure deciles, the levels of social assistance programmes in rural areas exceed those in urban areas. This is particularly prominent for the Raskin, Kartu Sehat, and BLT programmes. It is important to note, however, that the coverage rate of Raskin in the fi rst (poorest) decile is somewhat lower in rural than urban areas. This may suggest that this programme is less available for the poorest 10 percent of the rural population than those of the urban population.
Another important fi nding is that coverage rates of social assistance programmes (in particular Raskin, Kartu Sehat, BLT, and SKTM) appear to decrease with wealth levels in a much more steady and contin-uous manner in urban than rural areas. This result seems to suggest that, in rural areas, it is more diffi cult for programme administrators to discriminate between poor and better-off households, or stronger com-munity cohesion in rural areas affects programme access. As has been widely reported in Indonesia, the practice of sharing programme benefi ts among all households in a village irrespective of the welfare of an individual household (bagi rata) is a common practice in rural areas, whereas it is largely uncommon for urban areas.
0 10 20 30 40 50 60 70 80 90 100
Programme coverage (%)
NTT
Kalimantan
T
imur
Sulawesi Tenggara Maluku Maluku
Utara Papua Barat Papua
Overall IFLS
East 2012
Raskin
Kartu Sehat
Dana Sehat
BLT Card
BSM
16
Table 8: Coverage Rates of Social Assistance Programmes by Rural/Urban Area and Expenditure Decile
Expendi-ture Decile
Raskin (%) Kartu Sehat (%)
Urban Rural Urban Rural Urban Rural Urban Rural Urban Rural Urban Rural
1 83.27 75.59 51.02 61.66 0.00 2.98 34.18 42.38 6.82 13.75 48.17 15.35
2 54.83 83.02 45.85 58.04 6.69 4.36 20.28 40.61 0.43 6.68 28.75 16.28
3 48.36 78.09 38.85 56.22 6.42 2.61 20.75 25.25 3.59 10.21 10.50 13.29
4 43.83 79.40 24.86 48.73 3.87 3.76 11.15 33.40 9.84 11.38 21.23 15.50
5 25.44 82.10 23.06 47.36 2.04 2.24 8.49 28.69 2.17 6.25 12.47 16.49
6 19.41 82.20 12.40 51.06 0.47 2.39 6.08 25.64 6.22 10.43 14.97 14.27
7 23.21 71.07 19.47 42.07 1.44 2.76 10.88 20.76 5.49 6.25 9.83 16.37
8 20.65 64.56 10.32 34.14 1.18 3.40 5.90 23.16 0.80 7.42 11.51 18.87
9 16.49 61.61 9.14 25.65 4.81 4.74 5.91 21.31 0.00 5.46 7.19 5.56
10 10.17 57.43 6.42 29.62 2.76 5.29 1.14 14.08 1.11 0.00 7.42 9.17
All 28.52 74.70 19.10 46.75 2.87 3.28 10.21 29.01 2.98 8.37 13.76 14.57
Note: Expenditures per capita were obtained by dividing average monthly household expenditures by household size and adjusting for spatial price differences by using BPS’s offi cial poverty lines. Survey weights applied.
Figure 8A: Coverage Rates of Social Assistance Programmes for Urban Areas by Expenditure Decile
Figure 8B: Coverage Rates of Social Assistance Programmes for Rural Areas by Expenditure Decile
0 10 20 30 40 50 60 70 80 90 100
Programme coverage (%)
Expenditure decile
1 2 3 4 5 6 7 8 9 10
Raskin
Kartu Sehat
Dana Sehat
BLT Card
BSM
18
4. Determinants of Access to Social Assistance Programmes
Many factors can be used to explain the differences in programme coverage among households and across geographical areas. Many of these factors are present at the same time and interact with each oth-er, so it is necessary to apply a multivariate regression framework to model the determinants of access to a particular social assistance programme (BLT, BSM, Kartu Sehat, Raskin, and SKTM). Regressions are run at the household level on the overall IFLS East 2012 sample, and also for rural and urban areas in order to suffi ciently take into account the underlying relationship between certain factors and pro-gramme access that can differ substantially between rural and urban areas.
To estimate the determinants of programme access, we estimated linear probability models, choosing a categorical variable as the dependent variable, which takes the value 1 if a household receives a par-ticular programme and 0 otherwise. As standard in the economic literature, we always showed three different regression specifi cations: the baseline model, the extended model, and the full model. The baseline model specifi cation includes a basic set of control variables, for example, age of the household head, education level of the household head, and household size; whereas the extended model specifi -cation also includes variables from one of the following categories: infrastructure, trust, confl ict, and wealth quintiles/SKTM15. The full model specifi cation includes the whole set of variables (baseline
model plus all extended model variables). Table A.5 in the appendix describes the exact coding of each of the variables.
The selected explanatory variables (factors) fall broadly into the following categories 16:
• Socioeconomic household characteristics • Demographic characteristics
• Religion • Geography
• Violence and social confl ict • Infrastructure
• SKTM
Access to Raskin
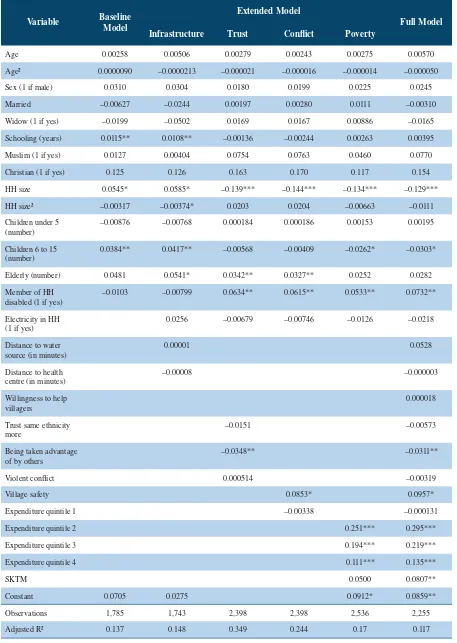
Table 9 (entire IFLS East 2012 sample), table 10 (urban sample), and table 11 (rural sample) depict the regression results. The following analysis focuses largely on the full model column in order to keep the interpretations simple.
Basic Household Characteristics
The baseline and extended model specifi cations show that larger households and households in which the head has received relatively low levels of education are more likely to access Raskin. However, once the poverty status / expenditure quintile position is controlled for (poverty or full columns), the
15 We included information on whether a household holds an SKTM as a further control variable.
16 Unfortunately, the IFLS-East 2012 did not collect information on birth and marriage certifi cates, which in some contexts
variables on household size and educational level of the household head lose their statistical signifi -cance, which suggests that they directly affect the poverty status of a household but nothing beyond. These results are largely the same when the regressions are estimated for rural and urban areas separate-ly, although in urban areas, a lower number of years of schooling is associated with a higher chance of receiving Raskin beyond the effects of per capita expenditure levels.
Our results further indicate that, everything else being constant, households in rural areas seem more likely to receive Raskin than in urban areas. These fi ndings are consistent with Raskin being shared (bagi rata) much more widely in rural than in urban areas.
Infrastructure
There are three infrastructure variables: electricity access in household, walking distance in minutes to the household’s main water source, and walking distance in minutes to the nearest health centre (puskesmas). Although we did not fi nd any signifi cant effects for the distance variables, we did fi nd that access to electricity seems to increase the chance of receiving Raskin. This result is puzzling and is largely driven by the sample of rural households. Although access to electricity seems to increase the chance of a household receiving Raskin in rural areas, it decreases the chance of receiving Raskin in urban areas. The results may suggest that, in urban areas, besides the poverty status (expenditure levels) of a household, the community may take into account not living in a dwelling connected to electricity in determining poverty levels, which therefore increases the chance of receiving Raskin. However, in rural areas, supply-side factors related to Raskin delivery might matter more. Raskin may not be available or is signifi cantly less available in the remotest rural areas without electricity. This could help to explain the positive association between household access to electricity and receiving Raskin in rural areas.
Village Con lict and Trust
20
In this context, another set of variables might affect a household’s chance of receiving Raskin. It is reported that local elites, such as village chiefs, allocate Raskin rice to households based on patronage networks. In this case, the connection between a household and the local elite or the majority ethnic group or religious group might impact receipt of Raskin rice. We tried to control for this relationship by using information on three variables that can proxy for trust and social inclusion. The three variables are willingness to help others (question on how willing a household is to help others in the village), trust within an ethnic group (question on whether a household trusts persons in its own ethnic group more than other ethnic groups in the village), and feeling taken advantage of (question on whether the house-hold head believes s/he is being taken advantage of by other villagers). The analysis reveals that feeling taken advantage of is the only variable correlated with the chance of receiving Raskin rice. Households that report feeling taken advantage of are less likely to receive the rice. Although this result is consis-tent with socially excluded households being less likely to receive Raskin rice, the interpretation is not straightforward. It might be that household members who do not receive Raskin would feel they have been excluded undeservedly. At the least, it may indicate that households do not entirely agree with how Raskin rice is distributed at the local level.
Poverty
We grouped all households into expenditure per capita quintiles and included quintile-specifi c dummy variables in the regressions (quintile 5, the richest quintile is the reference category). In addition, we included information on whether a household holds an SKTM as a further control variable. The results show that, in all the settings considered (full sample, and rural/urban), poorer households are more likely to receive Raskin. However, the strength of the effect differs between rural and urban areas: rural areas only marginally use poverty status as a criterion for distributing Raskin. In line with these results, we found that holding an SKTM signifi cantly increases the chance of receiving Raskin in urban areas, even when controlling for actual expenditure levels, which underscores the importance of holding an SKTM card for receiving access to social assistance programmes. However, we did not fi nd the same effect from holding an SKTM card in rural areas, which underscores that Raskin distribution (at least when measured against the indicator of receiving Raskin or not) is not related to rural household welfare and poverty status.
Vulnerable Groups
Table 9: Linear Probability Model, Dependent Variable: Raskin (1=yes, 0=no)
Variable Baseline Model
Extended Model
Full Model Infrastructure Trust Confl ict Poverty
Age 0.0102 0.0140** 0.0127* 0.0128* 0.00912 0.0161**
Age² –0.00009 –0.000123* –0.000114 –0.000114 –0.00008 –0.000143**
Sex (1 if male) 0.0117 0.0171 0.0200 0.0191 0.0108 0.0261
Married –0.0999*** –0.0875** –0.101** –0.0979** –0.0948*** –0.0796**
Widow (1 if yes) –0.0423 –0.0403 –0.0609 –0.0553 –0.0404 –0.0508
Schooling (years) –0.00923** –0.0100*** –0.00968** –0.00962** –0.00575 –0.00704*
Muslim (1 if yes) 0.192 0.147 0.213* 0.210 0.186 0.180
Christian (1 if yes) 0.133 0.0967 0.169 0.163 0.112 0.125
Urban –0.347*** –0.367*** –0.335*** –0.339*** –0.339*** –0.345***
HH size 0.0559*** 0.0505*** 0.0499** 0.0522*** 0.0291 0.0189
HH size² –0.00269** –0.00237* –0.00230 –0.00245* –0.00120 –0.000587
Children under 5 (number)
0.0207 0.0297* 0.0295 0.0298 0.00649 0.0211
Children 6 to 15 (number)
0.0143 0.0120 0.0117 0.0132 0.0102 0.00661
Elderly (number) 0.0229 0.0109 0.0153 0.0126 0.0215 0.00691
Member of HH disabled (1 if yes)
0.0102 –0.000711 0.00768 0.00965 0.00202 –0.00522
Electricity in HH
Violent confl ict 0.0374 0.0266
Village safety –0.0475* –0.0417
Expenditure quintile 1 0.140*** 0.158***
Expenditure quintile 2 0.158*** 0.167***
Expenditure quintile 3 0.0821** 0.0884**
Expenditure quintile 4 0.0111 0.0118
SKTM 0.191*** 0.170***
Constant 0.316* 0.182 0.0500 0.312* 0.290* –0.0673
Observations 2,536 2,381 2,398 2,398 2,536 2,255
Adjusted R² 0.293 0.288 0.297 0.296 0.323 0.320
22
Table 10: Linear Probability Model, Dependent Variable: Raskin (1=yes, 0=no), Urban Areas
Variable Baseline Model
Extended Model
Full Model Infrastructure Trust Confl ict Poverty
Age 0.0203 0.0333*** 0.0233* 0.0227 0.0173* 0.0333***
Age² –0.000233 –0.000360*** –0.000265* –0.000258 –0.000185 –0.000352***
Sex (1 if male) 0.00485 0.0203 0.0197 0.0181 0.00766 0.0341
Married –0.142*** –0.104* –0.134** –0.130** –0.0959* –0.0469
Widow (1 if yes) –0.117 –0.119 –0.152* –0.153* –0.0921 –0.121
Schooling (years) –0.0316*** –0.0316*** –0.0339*** –0.0334*** –0.0213** –0.0239**
Muslim (1 if yes) 0.248** 0.237** 0.207* 0.220* 0.183** 0.153*
Christian (1 if yes) 0.347*** 0.323*** 0.340*** 0.356*** 0.248** 0.232**
HH size 0.0370 0.0296 0.0284 0.0276 –0.00115 –0.0149
HH size² –0.00139 –0.000396 –0.000846 –0.000778 0.000265 0.00131
Children under 5 (number)
0.0136 0.0180 0.0329 0.0330 –0.0139 0.00988
Children 6 to 15 (number)
0.0395* 0.0209 0.0318 0.0348 0.0356** 0.0203
Elderly (number) 0.0577 0.0445 0.0437 0.0392 0.0577 0.0585
Member of HH disabled (1 if yes)
0.0183 –0.0320 0.00308 0.00905 0.0186 –0.0158
Electricity in HH
Violent confl ict –0.0391 –0.103
Village safety –0.0777* –0.0554
Expenditure quintile 1 0.272*** 0.249***
Expenditure quintile 2 0.198*** 0.190**
Expenditure quintile 3 0.00468 –0.0515
Expenditure quintile 4 0.00503 –0.0223
SKTM 0.297*** 0.293***
Constant 0.0152 –0.0173 –0.206 0.141 –0.0265 0.000544
Observations 751 638 696 696 751 594
Adjusted R² 0.197 0.239 0.224 0.225 0.285 0.365
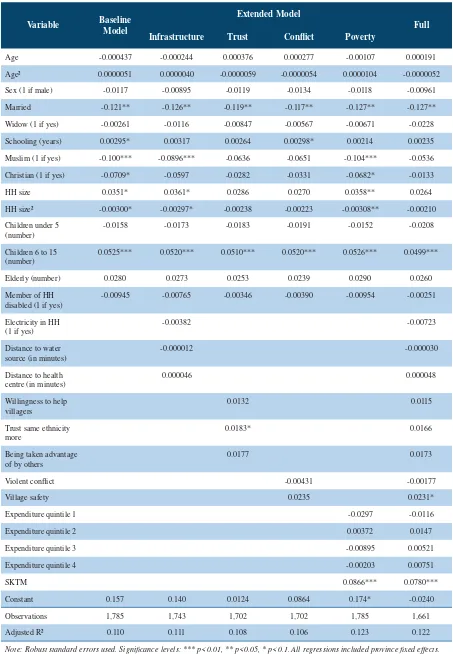
Table 11: Linear Probability Model, Dependent Variable: Raskin (1=yes, 0=no), Rural Areas
Variable Baseline Model
Extended Model
Full Model Infrastructure Trust Confl ict Poverty
Age 0.00705 0.00718 0.00961 0.00965 0.00610 0.0105
Age² –0.000041 –0.000040 –0.000066 –0.000064 –0.000032 –0.000073
Sex (1 if male) 0.0260 0.0158 0.0272* 0.0270 0.0248 0.0169
Married –0.0696 –0.0963 –0.0715 –0.0660 –0.0822 –0.107**
Widow (1 if yes) –0.0173 –0.0282 –0.0230 –0.0175 –0.0275 –0.0447
Schooling (years) 0.00493 0.00331 0.00455 0.00407 0.00610 0.00408
Muslim (1 if yes) 0.198 0.155 0.216 0.214 0.180 0.171
Christian (1 if yes) 0.0370 0.00542 0.0553 0.0511 0.00797 0.00670
HH size 0.0809** 0.0770* 0.0812* 0.0820** 0.0661 0.0546
HH size² –0.00541** –0.00530** –0.00563** –0.00584** –0.00415* –0.00385
Children under 5 (number)
0.0239 0.0281 0.0266 0.0300 0.0189 0.0277
Children 6 to 15 (number)
0.00104 0.00571 0.00113 0.00256 –0.00332 0.00197
Elderly (number) 0.00818 –0.00163 0.0100 0.00628 0.00432 –0.00564
Member of HH disabled (1 if yes)
0.0268 0.0255 0.0267 0.0286 0.0248 0.0208
Electricity in HH
Violent confl ict 0.148** 0.170**
Village safety –0.0265 –0.0229
Expenditure quintile 1 0.0823 0.117
Expenditure quintile 2 0.114 0.130*
Expenditure quintile 3 0.145** 0.168***
Expenditure quintile 4 0.0190 0.0352
SKTM 0.0542 0.0462
Constant 0.256 0.281 0.0628 0.222 0.262 0.0266
Observations 1,785 1,743 1,702 1,702 1,785 1,661
Adjusted R² 0.106 0.119 0.111 0.114 0.122 0.148
24
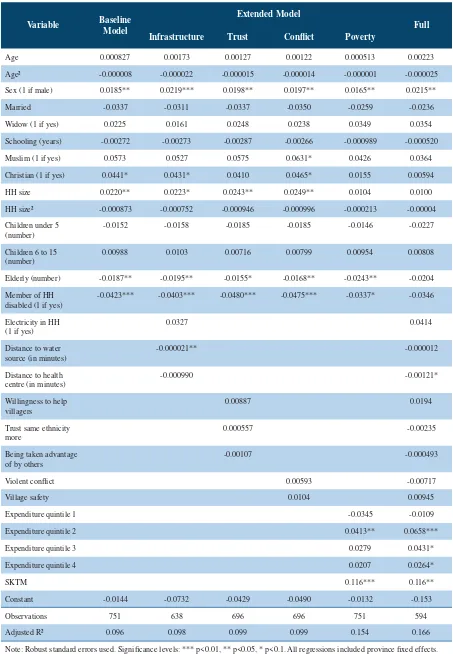
Access to Kartu Sehat
Basic Household Characteristics
In contrast to the analysis of access to Raskin, demographic characteristics seem to play a more import-ant role in determining access to Kartu Sehat (Jamkesmas/Jamkesda). In particular, households with elderly members are more likely to be able to access Kartu Sehat. Given that elderly people are more likely to suffer from health problems than younger persons, it seems that the health card programmes do consider and take into account the elderly’s higher need and demand for health care. However, we found that families with young children (below the age of 6) with equally high needs for health care, seem less likely to be included in the health card programmes. Regarding differences between rural and urban areas, we found that the coeffi cient on the share of elderly in the household remains positive for both locations. Given the lower number of observations in the split samples, it seems that smaller sample size is driving this result.
Infrastructure
We did not fi nd a signifi cant effect of the infrastructure variables on the chance of receiving Kartu Sehat. Access to Kartu Sehat does not seem to depend on remoteness or access to basic infrastructure/ services. It is likely that differences in infrastructure might be proxied by province fi xed effects and the rural/urban dummy variable used when estimating all regressions.
Village Con lict and Trust
Similar to Raskin, many reasons exist that might explain why the level of confl ict can impact availabil-ity and distribution of the Kartu Sehat programme. Although we did not fi nd any effect of confl ict vari-ables in the separate regressions for the rural and urban samples, we did fi nd a positive and statistically signifi cant effect of the confl ict variables on receiving Kartu Sehat in the regressions on the complete sample. Unfortunately, research and access data on Jamkesmas/Jamkesda is limited; therefore, the driv-ing force behind this positive association remains unclear.
Furthermore, we found that lower levels of trust in other ethnic groups (other than that of the head of the household interviewed) are associated with lower levels of access to Kartu Sehat. Although this result is consistent with the assumption that socially excluded households are less likely to receive access to social assistance programmes in Indonesia, the interpretation is not straightforward. It might be that a household that does not receive Kartu Sehat feels therefore undeservedly excluded from the programme. At the least, it may indicate that households do not entirely agree with how Kartu Sehat is distributed at the local level.
Poverty
like-ly to receive Kartu Sehat. Furthermore and in line with fi ndings for Raskin, we found that possession of an SKTM card improves access to Kartu Sehat, which underscores that the SKTM plays an important role in providing access to social assistance programmes in Indonesia.
Vulnerable Groups
26
Table 12: Linear Probability Model, Dependent Variable: Kartu Sehat (1=yes, 0=no)
Variable Baseline Model
Extended Model
Full Model Infrastructure Trust Confl ict Poverty
Age 0.00343 0.00452 0.00279 0.00243 0.00275 0.00570
Age² –0.000024 –0.000035 –0.000021 –0.000016 –0.000014 –0.000050
Sex (1 if male) 0.0217 0.0250 0.0180 0.0199 0.0225 0.0245
Married 0.00441 –0.00714 0.00197 0.00280 0.0111 –0.00310
Widow (1 if yes) 0.00784 –0.0290 0.0169 0.0167 0.00886 –0.0165
Schooling (years) –0.00213 –0.00189 –0.00136 –0.00244 0.00263 0.00395
Muslim (1 if yes) 0.0505 0.0396 0.0754 0.0763 0.0460 0.0770
Christian (1 if yes) 0.138 0.138 0.163 0.170 0.117 0.154
Urban –0.148*** –0.144** –0.139*** –0.144*** –0.134*** –0.129***
HH size 0.0234 0.0276 0.0203 0.0204 –0.00663 –0.0111
HH size² –0.000188 –0.000451 0.000184 0.000186 0.00153 0.00195
Children under 5 (number)
–0.00553 –0.00538 –0.00568 –0.00409 –0.0262* –0.0303*
Children 6 to 15 (number)
0.0313** 0.0305* 0.0342** 0.0327** 0.0252 0.0282
Elderly (number) 0.0557** 0.0614** 0.0634** 0.0615** 0.0533** 0.0732**
Member of HH disabled (1 if yes)
0.00264 –0.00187 –0.00679 –0.00746 –0.0126 –0.0218
Electricity in HH
Violent confl ict 0.0853* 0.0957*
Village safety –0.00338 –0.000131
Expenditure quintile 1 0.251*** 0.295***
Expenditure quintile 2 0.194*** 0.219***
Expenditure quintile 3 0.111*** 0.135***
Expenditure quintile 4 0.0500 0.0807**
SKTM 0.0912* 0.0859**
Constant 0.236 0.179 0.349 0.244 0.170 0.117
Observations 2,536 2,381 2,398 2,398 2,536 2,255
Adjusted R² 0.196 0.187 0.197 0.197 0.226 0.225
Table 13: Linear Probability Model, Dependent Variable: Kartu Sehat (1=yes, 0=no), Urban Areas
Variable Baseline Model
Extended Model
Full Model Infrastructure Trust Confl ict Poverty
Age 0.00837 0.00672 0.00412 0.00388 0.00660 0.00550
Age² –0.00012 –0.00010 –0.00008 –0.00008 –0.00009 –0.00009
Sex (1 if male) 0.0140 0.0224 0.0122 0.0125 0.0173 0.0232
Married 0.0445 0.0493 0.0466 0.0495 0.0655 0.0668
Widow (1 if yes) 0.0787 0.0167 0.0902 0.0960 0.0857 0.0384
Schooling (years) –0.0220*** –0.0213*** –0.0227*** –0.0234*** –0.0159*** –0.0158***
Muslim (1 if yes) 0.192* 0.169* 0.184 0.164 0.141 0.0993
Christian (1 if yes) 0.299** 0.269** 0.308** 0.292** 0.237** 0.203**
HH size –0.000332 0.00755 0.00198 0.00294 –0.0230 –0.00965
HH size² 0.00204 0.00215 0.00207 0.00205 0.00300 0.00289
Children under 5 (number)
–0.0187 –0.0286 –0.0150 –0.0149 –0.0405 –0.0489
Children 6 to 15 (number)
0.0177 0.00188 0.0145 0.0146 0.0157 –0.00119
Elderly (number) 0.0822 0.0782 0.0912 0.0883 0.0807 0.110
Member of HH disabled (1 if yes)
0.0138 0.00315 –0.00662 –0.00876 0.0119 –0.00113
Electricity in HH
Violent confl ict 0.0694 0.0891
Village safety –0.0233 0.00253
Expenditure quintile 1 0.241*** 0.245*
Expenditure quintile 2 0.158* 0.157
Expenditure quintile 3 0.0511 0.0264
Expenditure quintile 4 0.0275 0.0517
SKTM 0.0842* 0.0684
Constant 0.152 0.179 0.234 0.319 0.121 0.176
Observations 751 638 696 696 751 594
Adjusted R² 0.186 0.194 0.205 0.206 0.222 0.248
28
Table 14: Linear Probability Model, Dependent Variable: Kartu Sehat (1=yes, 0=no), Rural Areas
Variable Baseline Model
Extended Model
Full Model Infrastructure Trust Confl ict Poverty
Age 0.00258 0.00506 0.00279 0.00243 0.00275 0.00570
Age² 0.0000090 –0.0000213 –0.000021 –0.000016 –0.000014 –0.000050
Sex (1 if male) 0.0310 0.0304 0.0180 0.0199 0.0225 0.0245
Married –0.00627 –0.0244 0.00197 0.00280 0.0111 –0.00310
Widow (1 if yes) –0.0199 –0.0502 0.0169 0.0167 0.00886 –0.0165
Schooling (years) 0.0115** 0.0108** –0.00136 –0.00244 0.00263 0.00395
Muslim (1 if yes) 0.0127 0.00404 0.0754 0.0763 0.0460 0.0770
Christian (1 if yes) 0.125 0.126 0.163 0.170 0.117 0.154
HH size 0.0545* 0.0585* –0.139*** –0.144*** –0.134*** –0.129***
HH size² –0.00317 –0.00374* 0.0203 0.0204 –0.00663 –0.0111
Children under 5 (number)
–0.00876 –0.00768 0.000184 0.000186 0.00153 0.00195
Children 6 to 15 (number)
0.0384** 0.0417** –0.00568 –0.00409 –0.0262* –0.0303*
Elderly (number) 0.0481 0.0541* 0.0342** 0.0327** 0.0252 0.0282
Member of HH disabled (1 if yes)
–0.0103 –0.00799 0.0634** 0.0615** 0.0533** 0.0732**
Electricity in HH (1 if yes)
0.0256 –0.00679 –0.00746 –0.0126 –0.0218
Distance to water
Violent confl ict 0.000514 –0.00319
Village safety 0.0853* 0.0957*
Expenditure quintile 1 –0.00338 –0.000131
Expenditure quintile 2 0.251*** 0.295***
Expenditure quintile 3 0.194*** 0.219***
Expenditure quintile 4 0.111*** 0.135***
SKTM 0.0500 0.0807**
Constant 0.0705 0.0275 0.0912* 0.0859**
Observations 1,785 1,743 2,398 2,398 2,536 2,255
Adjusted R² 0.137 0.148 0.349 0.244 0.17 0.117
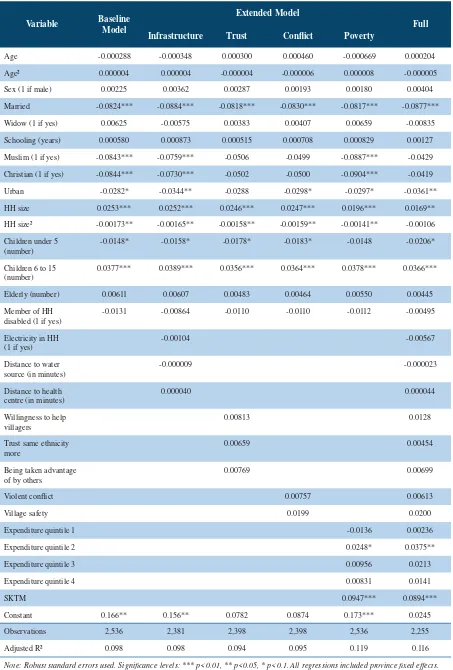
Access to BSM
Basic household characteristics
BSM aims to support children from poor families in attending school. In line with this explicit targeting criterion, we found that the age structure of a household determines its access to BSM. Households with a relatively high share of children between 6 and 15 years are more likely to receive BSM than other households.
Infrastructure
We did not fi nd a signifi cant effect of the infrastructure variables on the chance of receiving BSM. Access to BSM in either rural or urban areas does not seem to depend on access to basic infrastructure/ services or degree of remoteness. Evidently, differences in infrastructure might be proxies for province fi xed effects and the rural/urban dummy variable, which were used when estimating all regressions.
Village Con lict and Trust
In contrast to Raskin, the allocation of BSM depends much less on the level of confl ict and trust among villagers. At the local level, the Dinas Pendidikan (district education offi ce) along with local school principals and teachers are more likely to infl uence which students have a chance to receive BSM, de-spite the Ministry of Education and Culture and the Ministry of Religious Affairs explicitly advocating use of poverty criteria in selecting BSM students. Therefore, the likelihood of receiving BSM depends much less on a household’s relation to the village elite, for example the village head, than in the case of Raskin. In line with this reasoning, we did not fi nd that confl ict or trust affect receipt of BSM.
Poverty
BSM should target poor households. However, when looking at the quintile dummies, we found little evidence that BSM does this. BSM targets poor households only to some degree by including expendi-tures per capita as a criterion. However, in this context, it is important to note that access to BSM seems to improve signifi cantly in both rural and urban areas if a household holds an SKTM. Given that schools compile BSM lists17 at the local level and school principals and teachers have limited information on
households’ welfare, it appears that schools have strongly adopted the approach of using the SKTM as an eligibility criterion for accessing BSM.
Vulnerable Groups
Although the analysis for other programmes earlier shows that households with a disabled member and households whose head is a widow(er) seem to have higher coverage rates under the BSM programme, further analysis fi nds that none of the three indicators for vulnerable groups (disability, widow[er], and female-headed household) tends to be statistically signifi cant in the regression framework. The results suggest that, after controlling for the wealth level of the household and its sociodemographic composition, belonging to a vulnerable group does not have an additional effect on the likelihood of accessing BSM.
30
Table 15: Linear Probability Model, Dependent Variable: BSM (1=yes, 0=no)
Variable Baseline Model
Extended Model
Full Infrastructure Trust Confl ict Poverty
Age -0.000288 -0.000348 0.000300 0.000460 -0.000669 0.000204
Age² 0.000004 0.000004 -0.000004 -0.000006 0.000008 -0.000005
Sex (1 if male) 0.00225 0.00362 0.00287 0.00193 0.00180 0.00404
Married -0.0824*** -0.0884*** -0.0818*** -0.0830*** -0.0817*** -0.0877***
Widow (1 if yes) 0.00625 -0.00575 0.00383 0.00407 0.00659 -0.00835
Schooling (years) 0.000580 0.000873 0.000515 0.000708 0.000829 0.00127
Muslim (1 if yes) -0.0843*** -0.0759*** -0.0506 -0.0499 -0.0887*** -0.0429
Christian (1 if yes) -0.0844*** -0.0730*** -0.0502 -0.0500 -0.0904*** -0.0419
Urban -0.0282* -0.0344** -0.0288 -0.0298* -0.0297* -0.0361**
HH size 0.0253*** 0.0252*** 0.0246*** 0.0247*** 0.0196*** 0.0169**
HH size² -0.00173** -0.00165** -0.00158** -0.00159** -0.00141** -0.00106
Children under 5 (number)
-0.0148* -0.0158* -0.0178* -0.0183* -0.0148 -0.0206*
Children 6 to 15 (number)
0.0377*** 0.0389*** 0.0356*** 0.0364*** 0.0378*** 0.0366***
Elderly (number) 0.00611 0.00607 0.00483 0.00464 0.00550 0.00445
Member of HH disabled (1 if yes)
-0.0131 -0.00864 -0.0110 -0.0110 -0.0112 -0.00495
Electricity in HH
Violent confl ict 0.00757 0.00613
Village safety 0.0199 0.0200
Expenditure quintile 1 -0.0136 0.00236
Expenditure quintile 2 0.0248* 0.0375**
Expenditure quintile 3 0.00956 0.0213
Expenditure quintile 4 0.00831 0.0141
SKTM 0.0947*** 0.0894***
Constant 0.166** 0.156** 0.0782 0.0874 0.173*** 0.0245
Observations 2,536 2,381 2,398 2,398 2,536 2,255
Adjusted R² 0.098 0.098 0.094 0.095 0.119 0.116
Table 16: Linear Probability Model, Dependent Variable: BSM (1=yes, 0=no), Urban Areas
Variable Baseline Model
Extended Model
Full Infrastructure Trust Confl ict Poverty
Age 0.000827 0.00173 0.00127 0.00122 0.000513 0.00223
Age² -0.000008 -0.000022 -0.000015 -0.000014 -0.000001 -0.000025
Sex (1 if male) 0.0185** 0.0219*** 0.0198** 0.0197** 0.0165** 0.0215**
Married -0.0337 -0.0311 -0.0337 -0.0350 -0.0259 -0.0236
Widow (1 if yes) 0.0225 0.0161 0.0248 0.0238 0.0349 0.0354
Schooling (years) -0.00272 -0.00273 -0.00287 -0.00266 -0.000989 -0.000520
Muslim (1 if yes) 0.0573 0.0527 0.0575 0.0631* 0.0426 0.0364
Christian (1 if yes) 0.0441* 0.0431* 0.0410 0.0465* 0.0155 0.00594
HH size 0.0220** 0.0223* 0.0243** 0.0249** 0.0104 0.0100
HH size² -0.000873 -0.000752 -0.000946 -0.000996 -0.000213 -0.00004
Children under 5 (number)
-0.0152 -0.0158 -0.0185 -0.0185 -0.0146 -0.0227
Children 6 to 15 (number)
0.00988 0.0103 0.00716 0.00799 0.00954 0.00808
Elderly (number) -0.0187** -0.0195** -0.0155* -0.0168** -0.0243** -0.0204
Member of HH disabled (1 if yes)
-0.0423*** -0.0403*** -0.0480*** -0.0475*** -0.0337* -0.0346
Electricity in HH
Violent confl ict 0.00593 -0.00717
Village safety 0.0104 0.00945
Expenditure quintile 1 -0.0345 -0.0109
Expenditure quintile 2 0.0413** 0.0658***
Expenditure quintile 3 0.0279 0.0431*
Expenditure quintile 4 0.0207 0.0264*
SKTM 0.116*** 0.116**
Constant -0.0144 -0.0732 -0.0429 -0.0490 -0.0132 -0.153
Observations 751 638 696 696 751 594
Adjusted R² 0.096 0.098 0.099 0.099 0.154 0.166