Dynamic Behaviour of Submerged Floating
Tunnels under Seismic Loadings with Different
Cable Configurations
Endah Wahyuni
1, Ery Budiman
1, and I Gusti Putu Raka
1AbstractThe paper presents the dynamic behavior of a Submerged Floating Tunnel (SFT) in the Seribu Archipelago crossing under seismic loadings by using the different cable configurations. The SFT is a tubular structure submerged in the water at a fixed depth, which features several advantages from the structural and environmental impact points of view. In particular, the structural system is suited for waterway crossings in seismicity zones. Its interaction with the water provides additional damping and inertia to the system. To evaluate the SFT structural response of seismic loadings, a response spectrum analyses were carried out, in which the ground multi-support excitation is considered. The investigation of the different cable system configurations were also carried out. Both static and dynamic analyses were carried to find the optimal configuration of the structural system. Although the paper has had a definitive conclusion yet, the results gave useful indications of responses of Submerged Floating Tunnels subjected to earthquake. The SFT with two cable diagonals perpendicular with SFT’s body (called Model C) shows the optimal structural configuration compared with others.
Keywordssubmerged floating tunnel, stresses, displacement, cable, seismic loading
Abstrak Paper ini membahas studi tentang perilaku dinamik dari jembatan layang dalam air (Submerged Floating Tunnel, SFT) untuk kepulauan Seribu akibat pengaruh beban gempa menggunakana konfigurasi kabel yang berbeda. SFT adalah suatu struktur yang berada pada posisi melayang dalam air pada permukaan tertentu, yang mempunyai keuntungan baik dalam segi struktur, ekonomi, dan lingkungan. Struktur ini terlihat sangat cocok untuk penyeberangan air di daerah rawan gempa, karena interaksi dengan air menghasilkan tambahan peredam pada struktur. Untuk melakukan evaluasi respon struktur SFT akibat gempa bumi, maka analisa response spektrum digunakan untuk menghitung pengaruh beban tersebut. Sistem konfigurasi kabel yang berbeda-beda dianalisa secara statik dan dinamik untuk mengetahui konfigurasi yang optimum. Walaupun hasil penelitian ini belum memberikan kesimpulan yang pasti, tetapi hasil penelitian dapat digunakan sebagai acuan awal untuk mengetahui respon/tanggap struktur SFT akibat beban gempa. Berdasarkan penelitian ini diperoleh bentuk SFT dengan dua kabel yang ditaruh pada garis singgung antara kabel dan badan SFT (Model C) sebagai konfigurasi kabel yang optimum dalam menerima beban lingkungan dibandingkan tipe yang lain.
Kata Kunci submerged floating tunnel, tegangan, perpindahan, kabel, beban gempa
I.INTRODUCTION7
he Submerged Floating Tunnel (SFT) was a tubular structure placed underwater at an appropriate depth and fixed in position through anchorage groups linked to the seabed. Owing to positive residual buoyancies (i.e. the buoyancy overcomes the weight of the tunnel) the anchorages, which could be made up of cables or tethers, in tension, thus effectively restraining the tunnel when it was subjected to environmental actions, such as the hydrodynamic and seismic ones. An SFT basically consists of four parts: (i) the tunnel structure which is make up of tunnel segments and allows traffics and pedestrians to get through, (ii) the shore connection structures which connect SFT to shores, (iii) the cable systems which are anchoress to the waterbed to balance the net buoyancy (the present paper concentrates on the SFT type of tunnel buoyancy larger than tunnel weight), and (iv) the foundation structures which are construct at the waterbed to install cable systems [1].
As a water construction, the SFT should accept the water wave and current effects, and also earthquake effect. The SFTs seem to be particularly suitable to cross waterways located in seismicity zones, but it needs to be
Endah Wahyuni, Ery Budiman, and I Gusti Putu Raka are with Departement of Civil Engineering, Institut Teknologi Sepuluh Nopember, Surabaya, 60111, Indonesia. Email: [email protected].
evaluated for this case study. This research investigated the SFTs with different cable system configurations subjected to enviromental loadings with a case study in a crossing of Seribu Archipelago.
II.METHOD
A. SFT’s Models
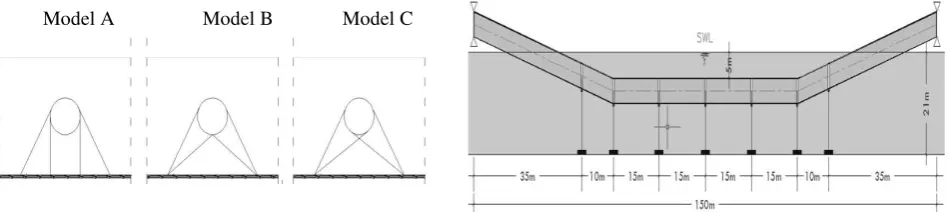
The Seribu Archipelago crossing was considered as a case study. However, since the aim of the study was to generally investigate the seismic behavior of SFTs, 3 (three) cable system arrangements (Fig.1) were investigated. Model-A consists of two vertical cables and two cables with inclination of 360 perpendicular to the horizontal axes of the seabed; Model-B consists of two symmetries cables with inclination of 360 for the outer cables as the same as Model-B and the inner cables meet in the center bottom of the SFT’s body; and Model-C is with the inclination as the same as Model- B but the inner cables has the tangent to the SFT’s body.
panels joined together as fixed connection to form a module.
Before the SFT prototype was built in the Seribu Archipelago crossing, it was needed to obtain the required data, especially the environmental data. The parameters of SFT structure and hydrodynamic environment of The Seribu Archipelago straits were listed in Table 1, which were used in these calculations of the structure.
A design criterion of the SFT [1] is to provide buoyancy enclose between an upper bound equal to the 130% of the permanent weight and a lower bound equal to 120% of the sum of permanent weight and traffic loads. However this criterion could lead to excessively large residual buoyancy in those cases where large internal dimensions were needed, so that lower bound values could be considered. For this study of the Seribu Crossing, the uplift force was 31563.5 KN and the total of structural weight including ballast was 25770 KN, thus the ratio of the uplift force and the weight was 1.22. This ratio will meet the required criteria, i.e. between 1.2 - 1.3.
To analyze the structure, the Finite Element (FE) models of these structures were created by using SAP2000 v.14 software. The geometric properties, material properties, support conditions and loading are assigned. The shell elements were used to model the SFT’s body, with beam elements for the longitudinal and transversal frames as shown in Figure 3. The cable elements were used to define the cables on SFT. The hinge supports were used to model the supports on edge SFT. Finally, the static analysis and modal analysis were conducted.
B. SFT’s Loading
The loading is one of the important factors that must be considered in the modeling. There are three types of loadings namely: the permanent loads (including hydrostatic load), the live load due to traffic, and the environmental loads due to waves, currents and earthquakes. The combinations of loadings in these analyses based on Allowable Stress Design [2-3] are
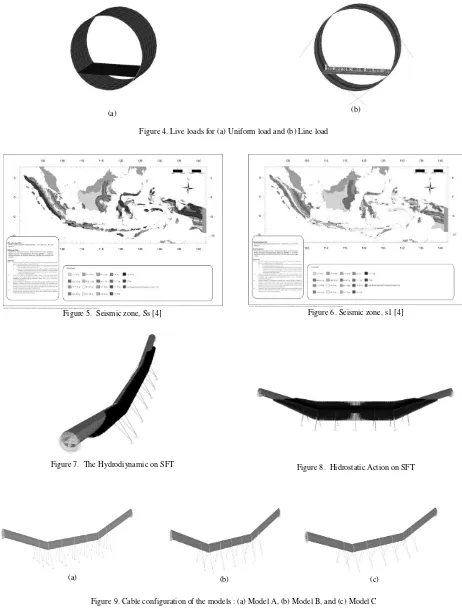
The live load in this SFT’s structure from traffic loads was shown in Figure 4. The uniform live load based on
seismic event could be evaluated through the Morison’s Equation [5-6]: CIis the inertial coefficient, CDis the drag coefficient, aw and as are the water particle and structure acceleration, respectively, vw and vs are the water and structure velocity, respectively. The input of these loads, which were perpendicular to vertical side, in the models can be seen in Figure 7.
4. Hydrostatic Actions
Any surface immerse in a fluid has a force exerted on it by the hydrostatic pressure, and the force acts in the direction of the normal, or the perpendicular to the surface; that is, the direction of the force depends on the orientation of the face considered. The pressure increases linearly with increasing depth into the fluid [6] as shown in equation (2), which was ranged from 50 Pa to100 Pa.
z
g
p
(2)Where is mass density, g is gravity acceleration and z is depth. This load applied to the structure was shown in Figure 8.
III.RESULTS AND DISCUSSION
From the three types of the model, which are the straight side and inclined side, were occurred due to the applied loadings as mention in the previous section. Tables 2 to 4 show the stresses, i.e. longitudinal stresses (s11), transversal stresses (s22) and shear stresses (s12), the maximum displacements, and the maximum axial forces on the cables respectively. These values on tables show the results of the four loading combinations and only the earthquake loadings from the models. The maximum stresses were located around the connection between the outer cable and the SFT body as the hydrodynamic loadings, which were wave and current, dominated the loadings. The maximum displacements of the structure occur in the middle of the SFT.
As shown in the Tables 2 to 4, Model C has the smallest value compared to the others except the stresses in the transversal direction (s22) on the model A. The stresses subjected to the earthquake loadings were about 2.4% to 8.3%of the stresses of the 4th load combinations.
The displacements of Model-C are generally smaller than they have been on Models-A and –B. Due to the earthquake loadings, the displacements of the SFT are about 0.17% to 6.96% of the 4th load combination except the horizontal displacement of 14% Model-A. The reason is that Model-A has vertical cables which can not resist the horizontal loads.
The axial forces of Model-C are smaller than Models-A and -B. The axial forces subjected to earthquake loading are about 1.8% to 5.8% of the 4th load combination.
not influence much on the total values of load combination comparing to other loadings.
B. Dynamic Analysis
The dynamic behavior of structures was analyzed in order to known the dangerous conditions on structure due to dynamic loads, such as waves, earthquakes, and currents [7-8]. This behavior could be explored from the mode shapes of the SFT as explained in this section.
Also it is necessary to discover the natural period of the structure and to compare with the period of the structure when the dynamic loads applied. The fluid mechanics influenced the structure in this case. The fluid mechanic loads could be counted used Vincent Strouhal known Strouhal number was given by formula [9]:
V L f
St (3)
where: f is the natural frequency of structure ; L is the length; V is the current velocity.
Using equation (4) with the data as follows: St = 0.2 (current is about 800 < Re < 200,000) V = 1.2 m/s (current velocity).
L = 5.0 meter (diameter of SFT).
Thus the natural frequency of the vortex shedding is, Hz
x V St f
L
048 . 0 0 . 5
2 . 1 2 . 0
.
(4) And the period is
second 83 . 20 048 . 0
1 1
f T
(5) The comparison between the natural frequencies and the period from the numerical analysis of the three SFT models could be seen in Table 5 together with the vibration shapes. The first four modes of the Model-C were depicted in Figure 10.
Table 5 showed that the natural periods of the structure are far from the period subjected to hydrodynamic, thus it can be said that the SFT structure is safe because a resonance was not occur. The natural period from the
model in the first vertical wave were in 4th mode with the value of 0.136 seconds in Model-A, 0.148 seconds in Model-B and 0.148 seconds in Model-C which is far away from the natural period of 20.83 seconds.
As shown in Table 5 and Figure 10, the first mode shape is in the horizontal direction, it means that when the structures receive the horizontal loading such as wave or current loads, the more danger exposed than danger from loadings on other directions such as buoyancy, dead or live loads.
IV.CONCLUSION
The conclusions of this study can be drawn as follows: 1. The loading combination of Dead + Hydrostatic +
Wave + Current + Earthquake gives the highest stress values among other loading combinations. It means that the hazardous conditions occur when the structure is in the empty condition or without any live loads, and receive other loadings, i.e. the wave, current, and earthquake.
2. The earthquake loadings influence the SFT’s structure; however the values are smaller compared to the other loadings as stated above.
3. The results show that the stresses, the displacements and the cable forces are similar but the Model-C shows the smaller values.
4. The natural periods of the three models give the values quite far from the theoretical values based on the Strouhal number. It concludes that the structure has no resonance due to the fluid mechanics.
ACKNOWLEDGEMENTS
We would like to acknowledge the financial support provided by the Agency for the Assessment and Application of Technology and ITS research grants which conduct this research.
Figure 1. Cable group configurations Figure 2. Geometrical Configuration of the SFT
Figure 3. Frames Inside the SFT’s Body
(a) (b) Figure 4. Live loads for (a) Uniform load and (b) Line load
Figure 5. Seismic zone, Ss [4] Figure 6. Seismic zone, s1 [4]
Figure 7. The Hydrodiynamic on SFT Figure 8. Hidrostatic Action on SFT
(a) (b) (c)
TABLE 1.
PARAMETERS OF FLUID DYNAMIC ENVIRONMENT
Fluid dynamic
environmental Symbol Unit Value Structural Property Symbol Unit Value Fluid density ρ kg/m3 1,025 Tunnel equivalent
density ρT kg/m
3 2,018
Water depth h m 20 Tunnel outer
diameter D m 5.5 Wave height H m 1.2 Tunnel inner
diameter d m 4.7 Wave period T m 3.58 Tunnel eauivalent Young ET N/m2 3.21010 Surface current
velocity UO m/s 1.2 Cable density ρC kg/m
3 7,850
Drag coefficient CD l 1 Cable diameter dC m 0.1 Mass/inertia
coefficient Cm l 2
Cable young
modulus EC N/m
2 11
10 4 . 1
Added-mass
coefficient Ca l 1
Kinetic viscosity
coefficient U m
2/s 6
10 067 .
1
TABLE 2.
STRESSES OF THREE MODELS OF SFT
Loading Combination
Model A Model B Model C
Stresses Stresses Stresses
S11 s22 s12 S11 s22 s12 S11 s22 s12 comb-1 N/mm2 N/mm2 N/mm2 N/mm2 N/mm2 N/mm2 N/mm2 N/mm2 N/mm2 comb-1 -92.27 -140.34 -64.37 104.75 -134.68 -57.51 105.06 -133.29 -57.28 comb-2 -87.58 -137.00 -62.83 94.51 -126.14 -53.58 94.85 -124.77 -53.33 comb-3 -97.48 -151.25 -70.06 109.13 -137.99 -59.08 108.56 -136.39 -58.79 comb-4 -92.79 -147.91 -68.52 97.89 -129.46 -55.15 98.34 -127.86 -54.84 Seismic -5.22 -10.91 -5.69 3.38 -3.31 -1.57 3.50 -3.09 -1.51
TABLE 3.
DISPLACEMENT OF THREE MODELS OF SFT
Loading Combination
Model A Model B Model C
Displacement Max Displacement Max Displacement Max
U1 U2 U3 U1 U2 U3 U1 U2 U3
comb-1 mm mm mm mm mm mm mm mm mm
comb-1 7.83 73.93 35.64 8.55 22.16 49.20 8.56 21.62 48.15 comb-2 6.89 73.93 32.77 7.29 20.98 43.14 7.29 20.45 43.22 comb-3 8.10 86.08 37.59 8.68 23.73 49.40 8.69 23.11 48.23 comb-4 7.17 86.08 34.71 7.41 22.55 43.34 7.42 22.02 43.28 Seismic 0.27 12.15 1.95 0.12 1.57 0.20 0.13 1.53 0.07
TABLE 4.
AXIAL FORCES OF THREE MODELS OF SFTCABLE
Loading Combination
Max force of Cable
Model A Model B Model C ton ton ton
comb-1 265.33 263.85 256.87
comb-2 243.04 242.42 235.56
comb-3 280.27 269.12 261.15
comb-4 257.97 247.69 239.84
Seismic 14.94 5.26 4.28
REFERENCES
[1] L. F. Ge, L. Wang, and Y.S. Yong, Effects of Fundamental Structure Parameters on Dynamic Responses of Submerged Floating Tunnel (SFT) under Hydrodynamic Loads, Journal of Acta Mech Sin, DOI 10.1007/s10409-009-0233-y, February 2009.
[2] American Petroleum Institute (API). Recommended Practice for Planning, Designing and Constructing Fixed Offshore Platforms– Working Stress Design (API RP 2A-WSD).
Washington, D.C : API, 2000.
[3] S. Nallayarasu. Offshore Structures Analysis and Design.
Madras : Department of Ocean Engineering, Indian Institue of Technology Madras, 2009.American Petroleum Institute (API).
Recommended Practice for Planning, Designing and Constructing Tension Leg Platform (API RP 2T). Washington, D.C : API, 1997.
[4] Indonesian Seismic Code. “Standar Perencanaan Ketahanan Gempa untuk Struktur Bangunan Gedung dan Non Gedung RSNI 1726-2010”, Indonesian Ministry of Public Work, 2010.
[5] G. Martirea, B . Faggianoa, F.M. Mazzolania, A. Zollob, and T.A. Stabileb “Seismic Analysis of a SFT Solution for the
Messina Strait Crossing”, in Procedia Engineering 4, 2010, pp. 303–310.
[6] American Petroleum Institute (API). Recommended Practice for Planning, Designing and Constructing Tension Leg Platform (API RP 2T).Washington, D.C : API, 1997.
[7] E. Wahyuni, I.G.P. Raka, D.P.U. Suswanto, and M.H. Pradono,
“Structural Behaviour of Submerged Floating Tunnels under Environmental Loadings”, in Proceedings of International Seminar on Applied Technology, science, and Arts (2nd
APTECS), Surabaya, December 2010.
[8] Z-J, Chen, Y-X Wang, and G-Y Wang, “Time Domain
Responses of Immersing Tunnel Element under Wave Actions”,
Journal of Hydrodynamics, vol.21, no.6, pp. 739-749, 2009. [9] M.D. Pilato, F. Perroti, and P. Fogazzi, “3D Dynamic Responses
of Submerged Floating Tunnels under Seismic and Dynamic