DETERMINATION OF KINETICS FOR CO-COMPOSTING OF
ORGANIC FRACTION OF MUNICIPAL SOLID WASTE
WITH PALM OIL MILL SLUDGE (POMS)
Saleh Ali Tweib
1, Rakmi Abd Rahman
2, Mohd Sahaid Khalil
31,2,3
Department of Chemical and Process Engineering, Faculty of Engineering and Built Environment University Kebangsaan Malaysia 43600 UKM Bangi Selangor Darul Ehsan Malaysia
ABSTRACT
Solid waste generated in Malaysia constitutes of large portion of organic material that can be readily composted. Composting which dispose of the organic material, and at the same time producing usable compost as the end product is thought to be a good option for organic wastes disposal. A reactor is chosen to be utilised in this study since it is economical and is a simpler alternative compared to other existing composting systems. Co-composting of palm oil mill sludge (POMS) and solid waste (SW) can be regarded as an environmental-friendly approach if compared to the current method whereby wastes are disposed in landfills. The compost starter was estimated based on its efficiency. The objectives were to investigate the appropriate 1:2 SWK to POMS mixing ration compost maturity and quality. The potential of the composting process is then found by using the proposed substrate and the possible usages of the compost for agricultural activities. Besides that, the physicochemical changes that occurred during the entire process of composting palm oil mill sludge together with solid waste were also studied. The pH value also decreased along the process and the final pH recorded was 7.28. Percentage of moisture content reduced from 64 to 55.32during the process. The highest temperature achieved was about 34.23°C, and eventually dropped to 20°C in the stages which followed. The model resulted in an experimental exponential equation. It also enable the formulation of another linear equation there from, that eventually give in the value of Kl and K2 (whereby Kl is the process constant and K2 is the process variable of a compo sting system). The model produced has a mathematical expression of y = 87.867 X-0.251with R-square value of 0.943 , and gave in the value of Kl and K281.64 and 1.0301. The results showed that the model
is capable of describing the actual status of the kinetics composting
Keywords: Michaelis–Menten Model and Composting Kinetics
INTRODUCTION
Waste generation has become a significant management problem in many developing countries. Special emphasis should be given on the effective management of solid waste treatment (Braun et al. 2003). Large amounts of organic
wastes are generated daily by households, agricultural activities, markets and industry. Most of the solid wastes from industries, markets and households all over the world are deposited in landfills. This is an undesirable solution because the esthetical value of the landscape is tarnished and various harmful pollutants are released into the groundwater (Ministry of Environment 1999). The issue of solid waste
_____________________________________
1,2,3
Correspondence author
disposal in Malaysia is becoming a force to be reckon with, thus it has attracted the attention of the Malaysian government and its citizens as well. With the decrease of suitable sites and the increased cost of developing new sites, effective efforts need to be exerted by the local authorities to develop alternative methods to meet the ever-evolving challenges of waste disposal [Surender et al. 2007]. In 2001, the total solid waste generated in Peninsular Malaysia was 16,200 ton metric per day. This figure increased drastically to 19,100 ton metric a day in year 2005. This figure translates to an average of 0.8 kilograms per capita per day [Anon 2006]. This rapid increase in solid waste generation can cripple
Malaysia’s capabilities of providing adequate waste
management services if not met with swift and proper actions [Lens 2004]. The management options used currently includes waste separation, burying, combustion or incineration, biological treatment and re-usage in agricultural and industrial activities [Lens 2004]. Over the last four decades, the palm oil industry has grown by leaps and bounds to become a very important agriculture based industry in Malaysia. The total area under oil palm cultivation is about 4.05 million ha, with the total palm oil production of 16.8 million tonnes [Astimar 2006].Composting has been presented as an environmental friendly solution and a sustainable alternative approach to manage and recycle organic solid wastes, with the aim of obtaining quality organic products known as composts which can be used as an organic amendment in agriculture (Haug 1993). When compared to the available technologies to the recycling of organic solid waste, composting is often presented as a low-technology and low-investment process to add value to organic solid waste through conversion into an organic fertilizer known as compost (Zucconi et al. 1987). Composting is defined as a biological decomposition and stabilization of organic substrates under conditions that allow the development of thermophilic temperatures as a result of biologically produced heat, to yield a final product that is stable, free of pathogens, plant seed and can be beneficially applied to land (Haug 1993). Composting is generally achieved by converting solid wastes into stable humus like materials via biodegradation of putrescible organic materials. The microorganisms involved in solid waste composting include facultative and strict aerobic bacteria, fungi, and actinomycetes. In this study, the composting process of mixed palm oil mill sludge with solid waste was studied as a potential alternative to treat and recycle these wastes. This study aims to identify the potential of composting process using the proposed substrate and the possible usages of the compost in agricultural activities. Besides that, the physicochemical changes that occurred during the entire process of composting palm oil mill sludge together with solid waste were also studied and kinetic estimation behaviour of co-composting process of palm oil mill sludge (POMS) with solid waste (Kitchen Waste), by using Michaelis-Menten model and a mathematical logarithm method for calculating kinetic suggested based on composting of solid waste with palm oil mill sludge (POMS) using a rotary drum composter. The composting process was
conducted using a rotary composter reactor system as it is economical compared to other existing composting system.
MATERIALS AND METHOD
In this study co-composting was used to produce compost from solid waste and palm oil mill sludge. Solid waste samples were collected from the wet market of Bandar Baru Bangi, Malaysia. Solid waste generated in the wet market included wastes such as green vegetables, cardboard boxes, wooden packs, waste from meat, chicken, seafood and etc. Based on an interview with Kajang Alam Flora Officers, the daily amount of waste generated at this particular wet market was around 8 tonnes. The respected wet market is monitored by the Kajang Municipal Council (MPKJ) and the contactor responsible for the waste collection is the Alam Flora Company. There are two rorobins placed outside the wet market which serves as a waste collection centre. Each rorobin has a capacity of 4-5 tones. Alam Flora collects the wastes from the rorobins at 10-11 a.m. daily. The wastes are then sent to the Refuse Derived Fuel (RDF) station in Semenyih to be sorted out for recycling and energy production. The non-recyclable waste is sent to a landfill in Sungai Kembong. Sludge from anaerobic digestion pond was collected from Sri Ulu Langat Palm Oil Mill in Dengkil, Selangor. The sludge is of high moisture content, low carbon content and high nutrient value. It is usually dried to be used as fertilizer. This study was carried out in the Laboratory of Environmental Engineering, University Kebangsaan Malaysia. Solid wastes from market waste were combined with dewatered palm oil mill sludge (POMS) from Sri Ulu Langat Palm Oil Mill in Dengkil, Selangor with mixing ratios of 1:2 using a rotator composter.
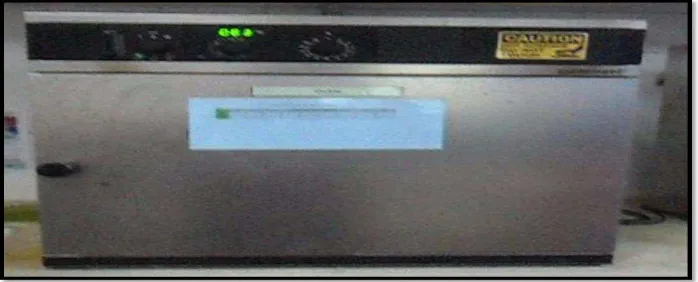
ROTARY COMPOSTER DESIGN AND
DESCRIPTION USED IN THIS STUDY
Rotator composter reactor system as shown in Figure 1 consists of 3 main components. They are the rotator drum, air compressor and gas absorber. Rotator drums are facilitated with 3 phase motor. There are 8 inner blades with length of 5 cm each in order to enhance the mixing process in the reactor. On the other hand, the air compressor functions to provide air to the reactor. The gas absorber functions to absorb gas and air resulting from the process inside the reactor. The absorber used in this reactor is charcoal. The characteristic of each components of the reactor is shown in Table 4. Mixing of palm oil mill effluents sludge and solid waste were inserted through the feeding part.
CHEMICAL AND PHYSICAL ANALYSIS
Sampling was done by taking 100g of compost from the rotary drum composter. The temperature was measured using
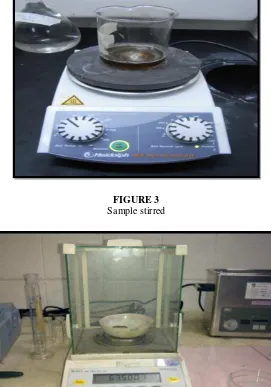
a thermometer at the core of the reactor on days 0, 5, 10, 15, 20, 25, 30, 35, 40, 45, 50, 55, 60, 65, 70, 75, 80, 85, 90, 95, and 100. The pH value was determined using a method described by [Carnes 1970] in which at least 10 grams sample of the organic waste was poured into 500 ml distilled water and stirred vigorously for 3 to 5 minutes. When the mixture settles, the pH of the mixture was measured as Figure 3. The determination of the total moisture content was done by weighing a sample of waste and drying it in a conventional oven at a temperature of 1050C for 24 hours and then the sample is weighted again [Romeela and Mohee 2005] as Figures 4 and 5. The percentage of moisture content was calculated using the formula as shown below:
VOLATILE SOLIDS AND ASH CONTENT
Volatile solid has been widely accepted by composting research as a mean to estimate the carbon fraction in compost materials. The relationship between carbon fraction and volatile solid content was first developed by New Zealand TABLE 1
Physicochemical analyses of raw palm oil mill sludge (POMS) and Solid Waste (SW)
Parameters POMS Solid Waste Recyclable compost
MC% 82.67 60.1 64.55
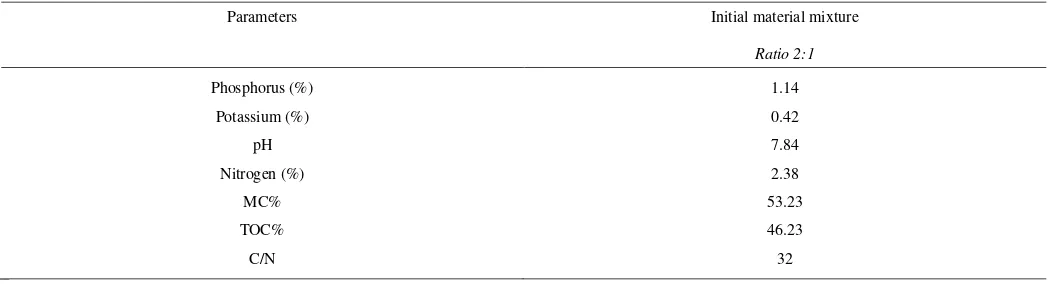
Parameters recorded for initial material mixture of ration 2:1 (POMS: SW)
engineers and published in their second interim report of the inter departmental committee on Utilization of organic wastes in 1951 and is shown as below:
% Carbon = 100- % Ash /1.8 = 1/1.8 (% Volatile Solids) = 0.56 (% Volatile Solids)
Whereby,
100- % Ash (% Volatile Solids)
In another publication by World Health Organisation, International Reference Centre for wastes disposal (1978), carbon content was estimated by the following relationship % Carbon = a x % volatile solids
Where a (refuse) = 0.42 A (compost) = 0.52
Undoubtedly, volatile solids are an indirect measure of carbon fraction for composting materials. However, the values of volatile solids will not be converted by the above mentioned factor (i.e. 0.56 and 0.52) in this study. The dry residue remained from the moisture content analysis was heated to 500 ± 50 C0 in a muffle furnace for 2 hours. The residue was allowed to cool down in a desecrator and reweighted again. Volatile solids can be expressed as follows: Volatile Solids = Initial Weight – Final Weight/ Initial Weight X 100.
Non-volatile solid or ash content (in percentage) = 100 – VS
The volatile solids are often termed as the total organic matter, but it is subjected to < 1% of error. This error is due to the fact that organic fraction is not the only substance that will be volatilized at 550 C0, but some of the inorganic FIGURE 1
Rotary composter reactor system
TABLE 3
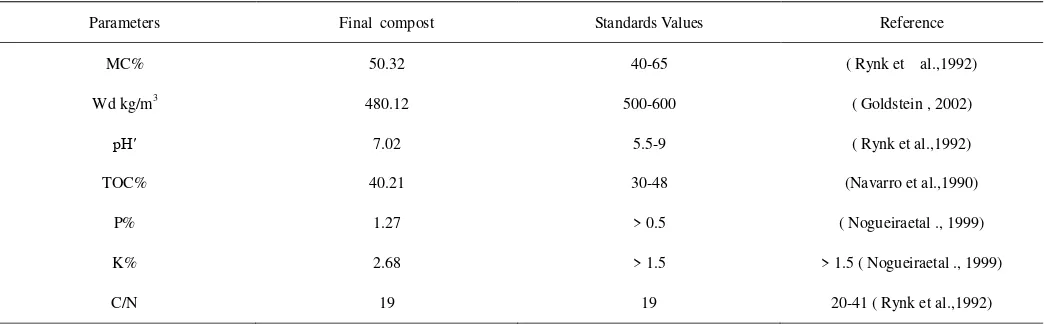
Physicochemical analysis of final compost
Parameters Final compost Standards Values Reference
MC% 50.32 40-65 ( Rynk et al.,1992)
Wd kg/m3 480.12 500-600 ( Goldstein , 2002)
pH′ 7.02 5.5-9 ( Rynk et al.,1992)
TOC% 40.21 30-48 (Navarro et al.,1990)
P% 1.27 > 0.5 ( Nogueiraetal ., 1999)
K% 2.68 > 1.5 > 1.5 ( Nogueiraetal ., 1999)
substance may get volatilized as well. (World Health organization 1978).
FLOW CHART OF METHODOLOGY
RESULT AND DISCUSSION
pH
pH is an important parameter that can control the depletion of nitrogen due to ammonia volatilization [Qiao, L.
& G. Ho. 1997]. A pH out of the 5-9 range would threaten any biological activity. The pH level of the composting mass typically varies with time during composting process. Along the experimental period, solid waste and sludge were added accordingly at the beginning in every batch. The initial pH value is 8.01 and it was reached to levels as high as pH 8.83 when the process is in the second batch. pH was initially recorded as 8.01 and then increased with time and reached a peak of 8.83 around day 20 and this was followed by reduction to 7.28 by the end of the process. Increase of pH value at the beginning of the composting process maybe due to the protein mineralization which affected to the increase in TABLE 4
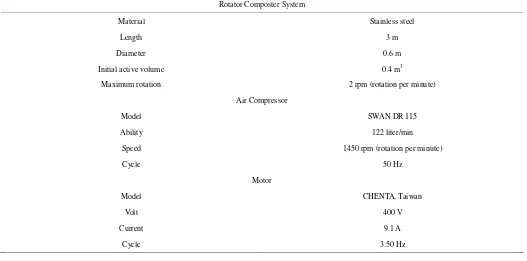
Rotary composter reactor system specifications
Rotator Composter System
Material Stainless steel
Length 3 m
Diameter 0.6 m
Initial active volume 0.4 m3
Maximum rotation 2 rpm (rotation per minute)
Air Compressor
Model SWAN DR 115
Ability 122 liter/min
Speed 1450 rpm (rotation per minute)
Cycle 50 Hz
Motor
Model CHENTA, Taiwan
Volt 400 V
Current 9.1 A
Cycle 3.50 Hz
FIGURE 2
ammonia generated by the biochemical reactions of nitrogen-containing materials and changing of amino acids and peptide to the ammonia (Paredes et al. 2002; Crowford 1983; Liao et al. 1994).Besides, the decreasing of pH values at the end of the composting process agreed with the Sundberg et al. (2004) that reported for fully developed composting, the pH often rises to 8-9. In addition, the composting is dominated by bacteria, which are generally not as acid tolerant. Figure 6 shows the graph of pH profile along the composting process.
Temperature Profile
Temperature is the most important indicator of the efficiency of the composting process (Xiujin et al., 2008). The palm oil mill sludge (POMS) used in this study contains high level of organic matter, therefore when a highly organic matter is added to a highly cellulosic material like solid waste
kitchen, waste heat is generated in the rotary composter as a result of biodegradation (Miyatake & Iwabuchi. 2005). In this study, the temperature reading taken at outlet section and the initial temperature for experimental process measured was
26.23˚C. However, the temperature profile increased to 34.23˚C which reflects microbial decomposition activity in the compost as shown in Figure 7. For 20 days, the fermentation temperature was maintained around 26.23-34.23°C indicating a thermophilic phase, on day 20 the fermentation reached a maximum temperature of 34.23°C. The temperature of rotary composter reduced gradually after it reached the maturity phase on day 40 of the treatment. A significant decrease in temperature to 20°C was noticed at the end of the composting process, indicating microbial activities had been reduced due to the depletion of biodegradable substrates for their growth and survival. Most studies reported that the optimum temperature range for effective decomposition was 50-70˚C, with 60˚C being the most FIGURE 3
Sample stirred
FIGURE 4
satisfactory level (Wong et al., 2001). However, for this study, the temperature profile obtained was under the optimum range for the sanitation and degradation process. In order to increase the temperature of the compost process, biodegradable carbon sources can be added. Stentiford (1996)
in his study stated that, maximum temperature of 55-65˚C is necessary to destroy pathogens, but temperature of 45-55˚C must be maintained for maximum degradation. Figure 3 shows the temperature profile for the experiment of composting process.
FIGURE 5
Oven used for drying sample
FIGURE 6 Graph of pH versus Time
FIGURE 7
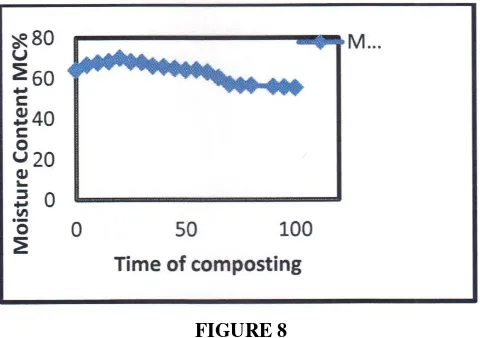
Moisture
Content MC%
The moisture content level was the critical factor that determined the decomposition rate in composting. For this study, sludge (POMES) was added onto the compost materials solid waste (SW) according to a ratio of 2:1. The reactor was injected with air by using an air compressor in order to reduce the moisture level of the compost product. The moisture content of the compost materials was too high, with a range of 64-70% and it then decreased over time to reach 55.32% at the end of the treatment as Figure 8. Moisture content of more than 70% can cause leaching in the composting process (Lau, H.L.N., Y.M. Choo, A.N. Ma & C.H. Chuah. 2008).
COMPOSTING KINETICS
Kinetics is the study of rates of reactions. Composting kinetics in particular deals with the rate of the composting process, that is, the velocity at which biodegradable matter in the composting materials is consumed. (Waksman et al., 1939). The data was manipulated and best fitted based on the procedure of Michaelis Menten model ( 1980).
CX* = CX / K1 ( 1 )
K1 = K1 + K2 / K1 ( 2 )
R= ( K2 C ) 1/ K1 + C ( 3)
Where
R = Consumption rate of substrate or reaction rate. CX* = Activated substrate –organism complex. C = Substrate , carbon.
FIGURE 8
Moisture Content MC% profile against time of composting
FIGURE 9
X= Free organisms
K1 =System constant of composting system.
K2=System variable of composting system.
The data for experiment carried out at 34.230C was fitted by an exponential function. The exponential functions were derived. These functions and the corresponding regression factors are included in Table 5 as exponential functions describing the variation of volatile solids and their respective regression factors.
Best fit equation (volatile solid VS with time) in power function for experimental results
R1 = y = 87.867 X t.p.o - 0.251 ( 4)
R2 = y= 85.437 X t.p.o -0.2123 (5)
R3 = y= 86.179 X t.p.o - 0.2268 (6)
The exponential functions were differentiated and the differential equation denoting the rate of change of volatile
solids were derived. The differential equation of the best –fit exponential function is written as below:
Series
R1 =dy / dx= -22.0104 X-1.2380 (7)
R2=dy/dx= -18.4865 X-1.2133 (8)
R3=dy/dx = -19.5924 X-1.2273 (9)
For equation R1 = y = 87.867 X t.p.o - 0.251
By differentiating this equation
Where
R = Consumption rate of substrate or reaction rate. VS = Volatile solids.
By using Minitab Program Scatterplot of VS/R vs. VS
TABLE 5
The change of volatile solids for experimental model
Series Exponential Function Regression Factor
R1 Y= 87.867 X-0.251 0.8021
R2 Y= 85.437 X-0.2123 0.713
R3 Y= 86.179 X-0.2268 0.7612
TABLE 6
The changes of volatile solids (%Wt) over time for all the three series ( R1, R2 and R3)
Analysis The changes of volatile solids over time for all the three series
Sample/Day R1 R2 R3
0 78.1252 79.123 77.11
1 70.7542 70.6926 71.69
2 72.1213 73.71 64.91
3 68.762 66.074 60.482
4 64.5354 61.6201 62.1300
5 56.9174 63.59 66.6052
6 54.137 63.31 50.1622
7 50.326 58.165 46.028
8 52.0722 43.0711 48.749
9 42.7222 62.041 43.1213
Regression Analysis: VS/R versus VS
The regression equation is y = 59.5 - 0.642 x
Predictor CoefSECoef T P
Constant 59.463 4.642 12.81 0.000 x -0.64201 0.07893 -8.13 0.001
S = 2.06549 R-Sq = 94.3% R-Sq(adj) = 92.9%
Analysis of Variance Source DF SS MS F P
Regression 1 282.27 282.27 66.16 0.001 Residual Error 4 17.06 4.27
Total 5 299.33
The value of volatiles solids (VS) and absolute value of the rate of change (R) are calculated and manipulated in such a way that the relationship between volatile solids (VS) can
be graphically described. The relationships were best–fitted by linear equation as shown in figure. The linear equations and their respective regression factors are as shown in Table 9.
From the value of regression factor for both the exponential function and linear equation, series R1 has the
best fit. Corresponding data’s, the exponential model
generated in series R1 was opted as the kinetic model for
composting process. This model was compared to another set of verification data to verify its appropriateness in describing the actual composting process. The intercepts and slopes of the linear equations were computed to give the value of K1
and K2. The K2 value was calculated by inverting the value of
slope, and K1 value was calculated by multiplying the value
of K2 and intercept. The value of slope intercept, K1, and K2
are summarized in Table 10.
K1 value is in the range of 80-83 whereas the K2 value is
within the range of 0.9-1.1. The mean for K1 and K2 are
81.3667 and 0.960 respectively. TABLE 7
Data Analysis for series 1 ( R1)
Time , day VS R VS/R
0 79.12 22.0079 3.59
1 70.89 8.796 8.059
2 72.76 5.567 13.069
3 67.79 3.69 18.371
4 64.67 2.846 22.723
5 58.71 2.437 24.09
6 55.68 1.826 30.492
7 51.33 1.547 33.1803
8 54.072 1.511 35.7855
9 42.876 1.2304 34.847
10 43.86 1.41 31.106
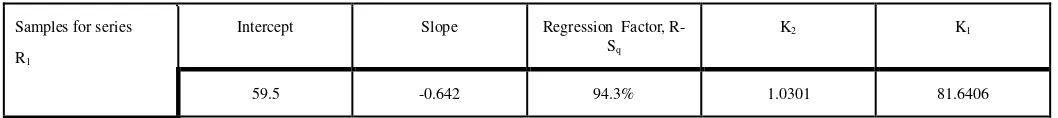
TABLE 8
Intercept , Slope , K2 and K1for series R1
Samples for series
R1
Intercept Slope Regression Factor,
R-Sq
K2 K1
The results show that the percentage error for K2 ranges
from 3.38 to 9.36 with an average of about 6.24. The maximum percentage error for K1 is only 1.98 and the low
side reading for percentage error is 0.93. The percentage error for K1 is 1.32 %, whereas the percentage error for K2 is 6.24
%. This shows that K2 is relatively more varied than K1. This
is consistent with the Michaelis-Menten model, whereby K1
is a dissociation constant that should be constant in a given system. On the other hand, K2 is a system variable dependent
to microbial population in the composting materials. These constants were also compared to the constant obtained by Whang and Meenghan (1980)
Both the K1 and K2 for these two studies do not agree
well with each other, due to difference in the experimental design for this study. Whang and Meenaghan (1980) employed carbon fraction as their indicating parameter and
was expressed in weight of carbon (gram) per weight of ash (gram), which eventually resulted in a dimensionless indicator (g/g). However, the indicating parameters for this study were volatile solids and were expressed in percentage of volatile solids per total dry sample weight. Besides that, the K1value is corresponding to the initial concentration
of the indicating parameter. Therefore the magnitude of K1 for
this study are in two digits (expressed in percentage), while the magnitude for K1 for Whang and Meenaghan (1980) was
only in one digit (expressed in fraction).
CONCLUSIONS
All in all, it can be concluded from this study that the composting process is an option that has a talent in stabilising TABLE 9
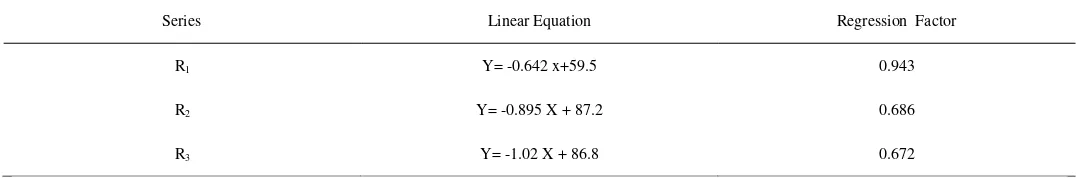
Linear equation of VS/R versus VS and their respective regression factors
Series Linear Equation Regression Factor
R1 Y= -0.642 x+59.5 0.943
R2 Y= -0.895 X + 87.2 0.686
R3 Y= -1.02 X + 86.8 0.672
TABLE 10
Value of Slope , Intercept, K1 and K2
Series Slope Intercept K1 K2
R1 -0.642 59.5 81.6406 1.0301
R2 -0.895 87.2 82.67 0.867
R3 -1.02 86.8 80.6013 0.931
Mean 81.637 0.9427
TABLE 11
The comparison is shown in this table comparison of K1 and K2 value with other study
K1 K2
Whang and Meenghan
(1980)
1.0623 1.2243 1.1362 0.0113 0.0325 0.0292
and re-using waste for agricultural purposes. Solid waste (SW) to palm oil mill sludge (POMS) mixing ratio of 1:2 is more likeable than 1:3 because it contains more essential nutrients for plant growth, such as N and C, and for building soil organic matter content. The composting process kinetic model developed for this project establishes the mathematical expression
Y = 87.867 X-0.251
K1 value obtained from this study is 81.64, R2 is 0.943 and K2
is 1.0301. These values are acceptable for homogenized carbon hydrate – based materials. In summary, the above result proves that co-composting of solid waste with palm oil mill sludge (POMS) can be used as an alternative method for improving treatment of wastes and optimize kinetics by using an economical and simple system,
ACKNOWLEDGMENT
The authors would like to thank Prof. Rakmi Abd Rahman for the financial and technical support without which this research could not be conducted and completed. We would also like to thank the Majlis Perbandaran Kajang (MPKJ) for allowing us to collect waste from the wet market at Bandar Baru Bangi.
REFERENCES
1. Anon. 2006.Ninth Malaysia Plan Sembilan. Bab 2 - Promoting Environmental Care: pp. 481-482.
2. Astimar, A.A. & M.B. Wahid. 2006. Supply outlook of oil palm biomass in Malaysia. Proceeding of the Seminar on Ecomat Research and Promotion, 24-25 July: 13-26. 3. Baharuddin, A.S., M. Wakisaka, Y. Shirai, S. Abd-Aziz, Characteristics of Compost.”Compos Science, Sept-Oct. 5. F. Zucconi, M. de Bertoldi,” Compost specifications for the production and characterization of compost from municipal solid waste.” In: deBertoldi, M., Ferranti, M.P., L’Hermite, P., Zucconi, F. (Eds.), Compost: Production, Quality and Use. Elsevier, Barking, pp. 30–50, 1987. Harilingen, Texas.
6. Gilmour, J.T., M.D. Clark, D. Mark and S.M. Daniel 1996. “Predicting long-term decomposition of biosolids with a seven–day test.” Journal of Environmental Quality, Volume 25(4): pp. 766-770.
7. Haug, R.T., 1993. The Practical Handbook of Compost Engineering. Lewis Publishers, Boca Raton, Florida, USA.
8. Haug, R.T. 1993.The practical Handbook of Compost Engineering. Lewis publishers. Boca Raton. p. 717.
9. Lau, H.L.N., Y.M. Choo, A.N. Ma & C.H. Chuah. 2008.
Journal of Food Engineering Selective extraction. 10. Lens, P., Bert Hamelers, H. Hoitink, & W. Bidlingmaier,
2004. “Resource Recovery and Reuse in Organic matrix Ofpalm carotene and vitamin E from fresh palm-press mesocarp fiber (Elaeisguineensis) using Supercritical CO2.” Volume 84: pp. 289 -296.
11. Ministry of Environment (MOE). 1999. Korea Government Report on Environment. Government Printing Registered Number 11-1380000-000156-10, Korea.
12.Miyatake, F. & K. Iwabuchi. 2005. “Effect of high temperature on enzymatic activity and species diversity of culturable bacteria in cattle manure compost.”
Bioresource Technology.,Volume 96: pp. 1821-1825 DOI: 10.1016/j.biortech.2005.01.005.
13. New Zealand engineering (1951) – “Second Interim Report of the inter departmental Committee on Utilization of organic waste.”New Zealand Engineering.
Volume 6: pp. 11-12.
14. Pressel .F., and W. Bidlingmaier 1981. “Analyzing decay rate of compost.”Biocycle. Volume 22(5): pp. 50-51. 15. Qiao, L. & G. Ho. 1997. “The effects of clay amendment
on composting of digested sludge.”Water Res., Volume 31: pp. 1054-1056.
16. Braun, R., E. Brachtl, M. Grasmug, “Codigestion of protein aceous industrial waste,” 2003, Applied Biochemistry and Biotechnology, Volume 109: pp. 139-153.
17. Romeela, Mohee. &Ackmez Mudhoo. 2005. Analysis of the physical properties of an in-vessel composting Seminar on Ecomat Research and Promotion, 24-25 July: 13- 26. Solid Waste Management. United Kingdom: IWA Publishing.
18. Surender, A. & A. Reddy, 2007. Composting feasibility study and conceptual planning for the city of Tiquia, S.M.N.F.Y. Tam and I.J. Hodgkiss (1996). Microbial activities during composting of spent pig-manure sawdust litter at different moisture content. Bioresource Technology. Volume 55: pp. 201-206.
19. Thambirajah, J.J., M.D. Zulkifli, and M.A. Hashim, 1995. “Microbiology and biochemical changes during the composting of oil palm empty fruit bunches. Effect of nitrogen supplementation on the substrate.” Bioresour. Technol. Volume 52: pp. 133-144.
20. Unit Operations in Resource Recovery Engineering Prentice-Hall, Inc. V. Miikki, N. Senesi, K. Hanninen,
“Characterization of humicmaterial formed by
composting of domestic and industrial biowastes. Part 2.Spectroscopic evaluation of humic acid structures,” 1997, Chemosphere, Volume 34, pp. 1639–1651.
21. Whang, D.S. and G.F. Meenaghan 1980. “Kinetic model composting process compost Science/ Land Vtilization” Volume 21 (3): pp. 44-46.