Embedding Analytics in Modern
Applications
How to Provide Distraction-Free Insights to End Users
Embedding Analytics in Modern Applications by Courtney Webster
Copyright © 2016 O’Reilly Media Inc.. All rights reserved. Printed in the United States of America.
Published by O’Reilly Media, Inc., 1005 Gravenstein Highway North, Sebastopol, CA 95472.
O’Reilly books may be purchased for educational, business, or sales promotional use. Online editions are also available for most titles (http://safaribooksonline.com). For more information, contact our corporate/institutional sales department: 800-998-9938 or
corporate@oreilly.com. Editor: Tim McGovern
Revision History for the First Edition 2016-06-24: First Release
The O’Reilly logo is a registered trademark of O’Reilly Media, Inc.
Embedding Analytics in Modern Applications, the cover image, and related trade dress are trademarks of O’Reilly Media, Inc.
While the publisher and the author have used good faith efforts to ensure that the information and instructions contained in this work are accurate, the publisher and the author disclaim all responsibility for errors or omissions, including without limitation responsibility for damages resulting from the use of or reliance on this work. Use of the information and instructions contained in this work is at your own risk. If any code samples or other technology this work contains or describes is subject to open source licenses or the
intellectual property rights of others, it is your responsibility to ensure that your use thereof complies with such licenses and/or rights.
Abstract
In our age of “there’s an app for that,” we’re used to having information at our fingertips. On any given day, people use more than 20 software
applications (cloud, enterprise, or desktop)1 and have approximately 26 mobile applications installed on their smartphones.2 More and more employees (not just data analysts or C-level execs) are expected to make data-driven decisions, yet only 20–25% of workers have access to business intelligence (BI) products.3,4 But when asked, your end users don’t want to use a “BI tool” — another interface to learn, another login — they want easily accessible answers. Instead of offering a standalone dashboard, the new trend is to embed analytics into applications that are already used every day.
As a software developer or product manager, you know that streamlined interfaces lead to wider adoption and increased product value. When it comes to embedded analytics, it’s easy to see the advantages of providing more intuitive insights (the “why”), but much harder to plan the “how.” This book provides a guide to delivering analytics within your native application to your end users.
We’ll review various embedding methods and describe how to select the right method for your desired interface, including when to custom-build and when to purchase a BI solution. If you choose a third-party analytics product, embedded tools present additional challenges for modern applications. For example, how do you provide best-in-class analytics without sacrificing
product performance? How do you implement needed security boundaries for your software as a service (SaaS) or multitenant applications? If you use a third-party BI tool, how can you customize it to match the look and feel of your custom application? Herein, we’ll review the most common challenges and best-practice solutions.
Drivers for Embedded Analytics
There are a number of factors that have turned the tide toward embedding (not just offering) analytics. 60% of vendors offer basic reporting capabilities without extra charge.1 Your users not only expect applications to include reporting, but in our mobile age, they want that information easily accessible, no matter what device or browser they’re using to access it.
Embedding analytics in a familiar application allows for a streamlined UI, leading to wider adoption and product use (“stickiness”). With embedding, your users are spared a tedious application launch and/or login, allowing you to provide in-context insights without distraction.
This increases the value of your product through customer retention and a competitive differentiation that leads to more new customer growth. You can create varying editions of your product and charge more for advanced
capabilities — on average, software editions that include reports/dashboards charge $62 more per user.1 Overall, companies using embedded analytics report a 16% higher annual revenue growth.7
If you’ve already invested resources in analytics, these drivers could indicate that you’d benefit from an embedded solution:7
Your focus groups report that users value the analytics in your application
You have an opportunity to monetize the data captured by your application
You want to offer more sophisticated analytics, or your customers are reporting some dissatisfaction with the current analytics/reporting your product provides
You lack sufficient ad hoc or self-service capabilities, resulting in too much development time providing custom reports or queries
You are planning a migration to SaaS and are not sure your current analytics solution will meet your needs for a multitenant environment
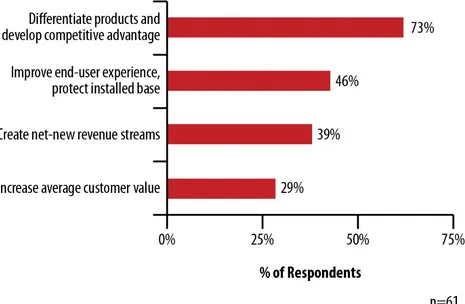
If one or more of these drivers is true, you may already be discussing what measures you should take to maintain your competitive advantage. A recent survey by the Aberdeen Group reported that 73% of independent software vendors (ISVs) have product differentiation as their primary objective for embedding analytics within their application (as shown in Figure 1-1).8 Updating your product with an embedded solution could provide a product facelift and best-in-class analytics in a streamlined user interface.
If we’ve sufficiently convinced you that embedding analytics will pay off, the decision now turns to which embedding method will meet your needs and whether you should build or buy your tool.
Interfaces and Methods
Static Data
This interface provides your users with a simple snapshot in time. The report can be downloaded (typically as a Microsoft Excel worksheet or a print-ready PDF) and can be designed for high-volume use. The end user is typically only allowed to make changes to date ranges and select a downloadable format. Any changes to the report (or new report requests) must be built by your developers.
Method: REST APIs or reporting libraries
Interactive Data
An interactive data experience allows users more flexibility in modifying reports to suit their needs; they can apply filters or select different report types. This allows them to identify trends and easily flag outliers (features that are not possible with a static interface). This dashboard approach is a common way to provide a more customized user experience inside structured reports.
Method: BI tools offering iFrames (analytics hosted in a separate tab or page) or custom development
Dashboard interfaces require an orchestration layer, typically managed by a metadata layer on a reporting server.9 If you purchase a BI solution to create a dashboard, the product should certainly offer a server interface, and will
likely offer iFrames to support the dashboard framework. If your analytics solution allows you to customize CSS themes, you can match colors and styles to the rest of your application for a cohesive interface. Parameters (such as default values or default settings for filters) are passed directly through the URL.
iFrames probably meet the needs of most organizations, but may limit future growth as end users mature and expect more. This method supports
dashboards in a separate portal or tab, and switching from one area of the portal to a separate reporting tab creates a disconnected user experience.
Additionally, it can be difficult to avoid a scroll bar within the iFrame, adding to the “clunky” feel.
Self-Service Exploration
A self-service tool allows users more flexibility to manipulate data in an easy-to-understand format. Instead of a raw data dump, users can select clearly named data sets to create their own graphics. A truly exploratory experience allows users to aggregate data across multiple dimensions and analyze using drill down, slice and dice, or pivot capabilities.9
Methods: Use an API-based BI tool, use a BI scripting framework, or custom development
The Benefits of Building In-Page Analytics
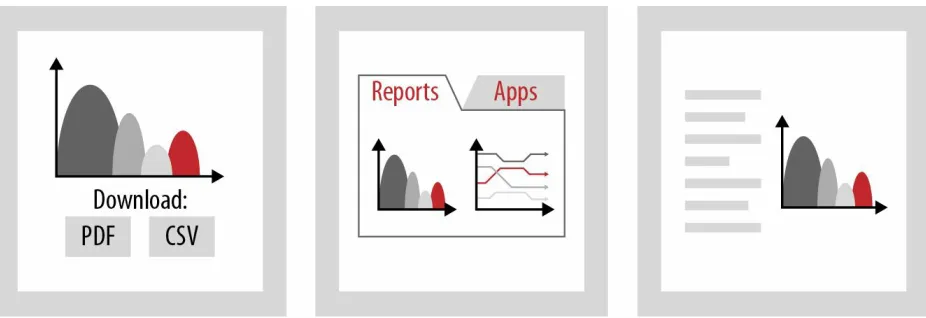
While your analytics interface could be hosted in a separate tab or page (for example, if you choose a BI tool offering the iFrame method), other products (like a BI tool that offers an API or scripting framework) could allow you to support in-page analytics, as shown in Figure 1-2. This interface can also be supported with custom development.
Figure 1-2. A mockup of providing static reporting (left) versus hosting analytics in a separate tab or page (middle), compared to in-page analytics (right)
Users don’t have to be directed to a separate location, but can see data in the context provided by the rest of the application; this can also offer users the opportunity to respond immediately to the information they’re digesting. The term actionable insights is used widely in the BI community, and while most products provide the insights, it can still be difficult for a user to perform the action. Consider the cost if you decide to sacrifice that interactivity and build your analytics in a separate location. IBM showed that productivity increased by 62% if response times improved.10,11 Analogously, streamlined
interactivity also allows users to act on data without the possibility for distraction or wandering thoughts. Later on, we’ll discuss how Triumph Learning built an in-page analytics product that helps teachers identify skill gaps in real time for grades 2–8.
Build or Buy?
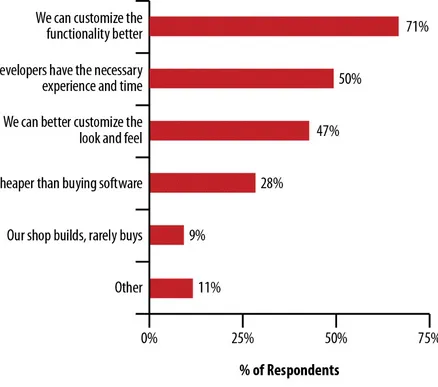
Figure 1-3. Why do you build instead of buy BI functionality? A survey of 91 non-BI independent software vendors12
The Eckerson Group found that 39% of independent software vendors build their own BI functionality.12 Most (54%) of builders report using open source libraries, 48% use BI tool APIs, 37% use commercial libraries, and 36% write their code from scratch.12
This approach works well if you require custom analytic measures or you have deep in-house BI expertise. But it can be hard to justify the difficulty and time investment to build your own tool with the recent advances and ease of embeddable products. Not only does a custom-built solution siphon
best-in-class functionality nor keep up with (and preconceive) your end users’ analytics needs.
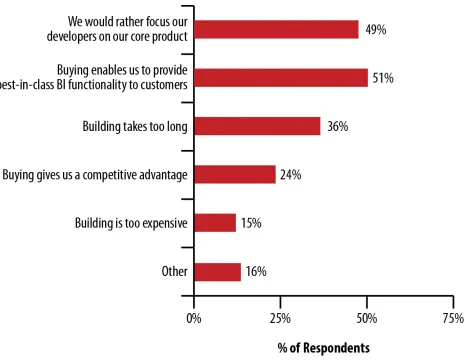
Figure 1-4. Why do you buy instead of build BI functionality? A survey of 55 non-BI independent software vendors12
The obvious concern with buying a solution is whether the product will meet your business needs, including any custom reporting. Additional challenges are whether you can customize the design to match the look and feel of your application, and whether the overhead of an analytics tool will negatively affect product performance.
Choosing the Right Tool: Seven Challenges and their
Best-Practice Solutions
Matching a BI product to business needs is one of the most important parts of the product-selection process. In addition to that key consideration, we’d like to evaluate additional challenges to the growing field of SaaS and multitenant applications. For example, can a purchased solution support the complex data permissions my application requires? Will it work for modern data streams, like Hadoop? How can I ensure scalability and performance?
While many of these issues used to require a custom-built solution, these concerns can be mitigated when you find the right product.
THE SEVEN CHALLENGES OF CHOOSING THE RIGHT EMBEDDED ANALYTICS TOOL
Customization
Will it look like the rest of my application? Can I easily customize it?
Usability
Will it please my customers? Will it provide a seamless experience between the BI and my application?
Capabilities
Can it meet my business needs?
Multitenancy
Can it support the security and access permissions my product needs?
Scalability
Can it scale with my application?
Data Structure
Will it work for my data structure/support my data streams?
Performance
Will it slow down my application?
Challenge 1: Customization
You don’t want your users to feel like they are moving between different applications. Your analytics tool should match the look and feel of your application as much as possible. Some tools may offer a selection of themes, but the ability to customize colors, fonts, logos, buttons, and menu styles offers more opportunity for a seamless user experience.
A truly “white-labeled” product is more than just the absence of “Powered By ____” at the bottom of each report. Ensure that URLs, error messaging, and alerts can be stripped of the vendor brand name so that your users don’t know they are using a separate product.
Outside of design, it’s important to consider how the tool powers its visualization. For example, if you have an HTML5 frontend, you want to select a tool that keeps up with the latest HTML/CSS standards so that the reporting matches the rest of your product.
Can I easily customize it?
As most (49%) non-BI ISVs choose a hybrid buy-and-build approach,12 selecting a vendor with an open architecture provides you with the flexibility to adapt the tool to your needs. Customization is cited as the top challenge ISVs experience when embedding a purchased BI
product.12 Many, many elements could need custom work, such as look and feel, analytic output, security, and/or deployment scripts (to name a few).
If the ability to customize the tool is crucial to your product needs, then your vendor should provide access to a developer community and/or source code to facilitate development. Do they offer APIs (like
visualization APIs) to provide more flexibility? If the framework is built from an esoteric or proprietary language, consider the implications that may have on your ability to customize. In our case study, we’ll discuss how Triumph Learning customized their analytics using TIBCO’s Jaspersoft Visualize.js, which is built on an open source library.
Challenge 2: Usability
Will it please my customers?
product interface is clunky or looks outdated. An additional consideration is whether the product offers mobile or responsive capabilities: some of your key user personas may interact with your product primarily through a mobile or tablet interface. Consult your data for current user-access patterns. If you plan to embed through an iFrame, iFrames can run in any mobile browser and support most web standards. For fully embeddable solutions, an SDK would allow you to build a fully mobile version of your application. (For example, Jaspersoft offers an open source mobile SDK for iOS and Android.13) This allows you to modify the UI as needed for an optimal mobile interface.
Will it provide a seamless experience between the BI and my application? Any embeddable solution will offer single sign-on (SSO) support, so there will be no interruption between your product and the BI tool. It’s worth investigating which method(s) are supported to ensure it’s
compatible with your products’ needs. Using common third-party
frameworks (CAS, SAML, Kerberos, LDAP, IWA) is a must, and some may support custom SSO frameworks through an API as well.
Challenge 3: Capabilities
Can it meet my business needs?
Evaluating analytic capabilities (e.g., types of reports, dashboard capability, drill down, data exploration, and ad hoc querying) will already be top-of-mind as part of your product evaluation. The big question here is, “Will it provide best-in-class analytics?” Because, frankly, why would you settle for a solution that doesn’t? Even if you aren’t offering certain functions now (like ad hoc querying or data exploration), you can future-proof yourself so that a quick pivot or a response to a competitor can be quickly implemented.
Matching capabilities goes back to the method you choose to embed your tool. REST APIs allow you to provide buttons within your
predominant method, Eckerson’s survey found that only 18% of non-BI ISVs used this integration (compared to 38% using REST and 40% using JavaScript).12 If a vendor only offers REST APIs or iFrames, you should consider whether these methods are flexible enough to meet your needs as your product (and your users’ expectations) evolve.
Challenge 4: Multitenancy
Can it support the security and access permissions my product needs?
Currently, more than 50% of new software implementations do not use an on-premises license.14 By 2018, SaaS is expected to be over 50% of all enterprise apps sales.15 If you don’t currently offer your product as a SaaS implementation, you’re probably considering it, making this a key factor when selecting an embedded analytics vendor.
While cloud-based managed platforms (like GoodData, Domo, and Birst) are new players in the space, you don’t necessarily have to choose a SaaS BI product for your SaaS application.
First, consider the structure of your reporting repository for supporting multitenancy. Do you provide canned reports (where reports are built by developers and shared by all customers) or custom reports (where
reports built by a developer or the end user are provided to each
customer separately)? In addition, consider how you plan to propagate resources (e.g., how you deploy a new resource to all customers) and manage complex user permissions?
To support the complex permissions required in multitenancy, finding a solution that supports column- and row-level security will be key. This allows you to specify restrictions for data types (columns) and data entries (in rows) by user role, tenant, or attribute.16
Lastly, unless you are already fully SaaS, you’ll likely have a planned, stepwise migration. Look for a vendor with streamlining capabilities to transition tenants slowly from on-premises to cloud.
Challenge 5: Scalability
Can it scale with my application?
scalability. Paying per user for an embedded product could lead to skyrocketing costs. The solution should offer a scalable, cost-effective approach for your hardware as well. You may only need one reporting server now, but can you easily deploy it on different application servers to scale in the future? And does the solution offer load balancing?
Hosted solutions offer an easy scale-for-purchase opportunity, as long as that investment doesn’t become too costly.17
We consider scalability to be tied to product evolution as well. Ideally, your embedded solutions provider has continuous upgrade schedules. Select a leader that has proven its ability to provide cutting-edge features that you can pass onto your customers, and that offers flexibility in
pricing models.
Challenge 6: Data structure
Will it work for my data structure/support my data streams?
You may have entirely SaaS data sources or only use open source SQL databases. You may have an existing data warehouse or use OLAP cubes, or you may only utilize next-gen MPP databases like Redshift or Vertica. You might have a fully relational database structure, or have some relational and NoSQL data streams (like MongoDB or Hadoop). There are many ways to manage data, and it’s best to choose a tool that lets you, as the developer, make the choice for your current and
projected needs.
Merging various data streams into a centralized location enables flexible data exploration and drill down. If possible, select a vendor that can provide not just analytics, but a data integration solution (blending, migration, centralization) instead of a series of lightweight data
connectors. As your product grows, this will ensure you can continually accommodate new data streams and avoid bland, high-level metrics without actionable insights.
Challenge 7: Performance
Will it slow down my application?
the loads on reporting functionality to be independent of other
application loads. This also provides the flexibility to independently control (and scale) the size and resource requirements of a reporting server versus other resources (like network or memory). If you didn’t rely on an independent server, a lot of the reporting code (like
repositories, permissions structures, and schedulers) would be integrated within the functional code of your application and could potentially lead to performance issues.
The way the analytics tool interacts with the data also contributes to performance. For example, an analytics solution that allows for data exploration will use a metadata layer in some form or another. This allows the tool to abstract away from SQL queries into a model that’s easier for end users to manipulate. This could be like Tableau’s pre-organized data table, a data modeling layer like Looker’s LookML, or a traditional data warehouse. Consider the frequency with which any data extracts need to be refreshed to avoid stale data, and select a solution that can support that refresh rate without draining performance.
Lastly, how the tool performs its analysis is crucial to performance. In-memory products have the advantage of speed, but may not scale to larger sizes, as there is a limit to what can be drawn up into memory. Pushdown query processing allows the tool to take the query to the source without the need for an ETL operation (which can be time-limiting to impossible, depending on the size of the data). For example, the Jaspersoft embedded BI solution combines a pushdown query-processing architecture with in-memory analysis for enhanced performance.13
Reaching deployment
The seven challenges we’ve described here are integrally tied to vendor
Case Study: Analytics-First Design Brings Practical
Insights to Waggle
Triumph Learning’s smart practice application, Waggle* covers math and English language arts (ELA) for grades 2–8. The student-facing side of Waggle provides a differentiated learning experience, providing custom feedback to help students understand their misconceptions, and puts them on the right path to the correct answer. The majority of the application (70–80%) is the teacher-facing reporting functionality, which helps teachers identify skill gaps in real time.
While traditional educational tools (quizzes and exams) assess
comprehension, Triumph knew that correcting misunderstandings after the time of the test is too late. When developing Waggle, Triumph wanted to provide teachers with a constant diagnostic of student proficiency so they can intervene before the big exam or final grade.
When investigating how to implement their desired analytics, time-to-market constraints forced them to find a solution quickly. Ultimately, they had
approximately six months to release their product before the new school year began. Triumph had to find an analytics tool that could meet their three main objectives:
1. Web compatibility, so the product could work on every browser and device.
2. Fluid integration to provide a connected experience (specifically, no iFrames).
3. Quick development. They had no time to waste learning a new tool!
Waggle is a perfect example of a modern product — it’s SaaS, multitenant, and cloud-based. So alongside their main objectives, they had to find a vendor compatible with their structure and ensure it could manage stringent data sharing permissions.
solution; and TIBCO’s Jaspersoft Visualize.js programmable framework. While all were good solutions, Cognos and Oracle were quickly determined to be too bulky and resource-intensive to deploy. It only took a few days for Triumph’s team to decide that Jaspersoft was the right solution for their needs.
The majority of the six-month deployment phase centered on a contextual design process. The development and product teams worked closely to evaluate user needs. They knew a typical teacher has a very hectic life — a teacher couldn’t wait 24 hours for an updated report, nor spend an hour trying to identify which students were struggling. Xavier de Cárdenas, Triumph’s VP of Product Management, explained that “a teacher needs in-the-moment answers” during Sunday-night lesson planning and between-class breaks. With those needs in mind, the teams began on a whiteboard to build a data model, and then queried that model to ensure it could answer users’
questions. For example, could it tell you the number of struggling students? Could you identify the skill gaps at varying “zoom” levels (student versus small group versus class), so that you can determine whether to review concepts with the entire class or separate students into groups?
Once the data design was solid, they built a malleable, component-based data warehouse with Amazon Redshift and installed Jaspersoft Visualize.js in a matter of minutes. Like most ISVs, they did need to customize the tool to fit their needs — specifically, the SSO method and some of the analytics. Since Jaspersoft was built on an open source library, customization was a quick and uncomplicated part of their deployment. Triumph had access to the Jaspersoft Visualize.js source code and worked with the Jaspersoft product team to ensure their customizations wouldn’t be dependent on a single software version. Since Triumph Learning, an early adopter of Jaspersoft, began using the software, many of their analytic customizations have been integrated into the 6.0 release.
Conclusion
Embedded in-page analytics provide a streamlined interface, allowing your product to deliver insights in the context of other native application
functionality. Standalone dashboards and clunky, disjointed reporting interfaces aren’t meeting the needs of today’s users, who expect reporting with an at-your-fingertips experience. iFrames and REST APIs can provide in-application analytics, but only some BI solutions or custom development can provide in-page analytics. This enables users to act upon actionable data without the possibility for distraction.
If you choose to use a third-party BI product, it’s vital to select an
embeddable analytics vendor that can meet the needs of modern applications. Multitenancy support, scalability, and optimal performance must be
References
1. “Four Embedded Analytics Patterns for 2016,” TIBCO, March 2, 2016.
2. “Smartphones: So many apps, so much time.” Nielsen, July 1, 2014. 3. Ann All, “Business Intelligence Sees Generational Shift: Dresner.”
Enterprise Apps Today, May 30, 2013.
4. Doug Henschen, “5 Resolutions For Better BI in 2012.” Information Week, November 29, 2011.
5. “Analytics Pays Back $13.01 for Every Dollar Spent.” Nucleus Research, September 2014.
6. “Analytics Pays Back $10.66 for Every Dollar Spent.” Nucleus Research, December 2011.
7. Jessica Sprinkel, “The Complete Guide to Embedded Analytics.”
(presentation, LinkedIn SlideShare, March 1, 2014).
8. “Embedded Analytics for the ISV: Supercharging Applications with BI,” The Aberdeen Group, June 2014.
9. “Five Levels of Embedded BI: From Static Reports to Analytic Applications.” TIBCO, September 21, 2015.
10. A. J. Thadhani, “Factors affecting programmer productivity during application development.” IBM Systems Journal 23 no. 1 (1984): 19. 11. G. N. Lambert, “A comparative study of system response time on
program developer productivity.” IBM Systems Journal 23 no. 1 (1984): 36.
13. “Reporting and Analytics Software: The Intelligence Inside Apps and Business Processes.” TIBCO, October 8, 2015.
14. “Gartner Says Modernization and Digital Transformation Projects Are Behind Growth in Enterprise Application Software Market,”
2015.
15. Lois Columbus, “Roundup Of Cloud Computing Forecasts And Market Estimates Q3 Update, 2015.” Forbes, September 27, 2015. 16. TIBCO Jaspersoft, Embedded BI for SaaS: “BI as a Service” (video
webinar). Retrieved from
http://www.jaspersoft.com/event/embedded-bi-saas-bi-service, May 4, 2016.
17. “Top 5 Challenges of Embedded Reporting,” 5000fish, 2014.
Waggle is the scientific name for a form of bee communication. When a bee finds a rich food source, the complexity and length of its waggle dance informs the rest of the hive of the distance and direction of the nectar. For Triumph Learning, Waggle similarly invites others to collaborate with its food source: knowledge.
About the Author
Courtney Webster is a reformed chemist in the Washington, D.C. metro
1. Embedding Analytics in Modern Applications Abstract
Drivers for Embedded Analytics
Interfaces and Methods Static Data
Interactive Data
Self-Service Exploration
The Benefits of Building In-Page Analytics
Build or Buy?
Choosing the Right Tool: Seven Challenges and their Best-Practice Solutions
Case Study: Analytics-First Design Brings Practical Insights to Waggle
Conclusion