Serial number tagging reveals a prominent sequence
preference of retrotransposon integration
Atreyi Ghatak Chatterjee
1, Caroline Esnault
1, Yabin Guo
1, Stevephen Hung
1, Philip
G. McQueen
2and Henry L. Levin
1,*1
Section on Eukaryotic Transposable Elements, Program in Cellular Regulation and Metabolism, Eunice Kennedy
Shriver National Institute of Child Health and Human Development, National Institutes of Health, Bethesda, MD
20892, USA and
2Mathematical & Statistical Computing Laboratory, Division of Computational, Bioscience, Center
for Information Technology, National Institutes of Health, Bethesda, MD 20892, USA
Received February 4, 2014; Revised May 30, 2014; Accepted June 3, 2014
ABSTRACT
Transposable elements (TE) have both negative and
positive impact on the biology of their host. As a
result, a balance is struck between the host and
the TE that relies on directing integration to
spe-cific genome territories. The extraordinary capacity
of DNA sequencing can create ultra dense maps of
integration that are being used to study the
mech-anisms that position integration. Unfortunately, the
great increase in the numbers of insertion sites
de-tected comes with the cost of not knowing which
positions are rare targets and which sustain high
numbers of insertions. To address this problem we
developed the serial number system, a TE tagging
method that measures the frequency of integration at
single nucleotide positions. We sequenced 1 million
insertions of retrotransposon Tf1 in the genome of
Schizosaccharomyces pombe
and obtained the first
profile of integration with frequencies for each
indi-vidual position. Integration levels at indiindi-vidual
nu-cleotides varied over two orders of magnitude and
revealed that sequence recognition plays a key role
in positioning integration. The serial number system
is a general method that can be applied to determine
precise integration maps for retroviruses and gene
therapy vectors.
INTRODUCTION
Transposable elements and retroviruses have evolved a
va-riety of strategies to populate the genomes of their host.
One critical feature of their propagation is the position in
the host genome where they integrate. Many transposable
elements avoid the disruption of host genes by integrating
into non-coding regions, such as heterochromatin or
inter-genic sequences (
1
). The long terminal repeat (LTR)
retro-transposon Tf1 of
Schizosaccharomyces pombe
integrates
specifically into the promoters of pol II transcribed genes
(
2–5
). One interesting feature of this integration pattern as
revealed by high-throughput sequencing of 73 125
integra-tion sites is that the promoters of stress response genes are
preferred targets (
4
).
Retroviruses, such as murine leukemia virus (MLV) and
human immunodeficiency virus type one (HIV-1), integrate
near the transcription start sites of genes transcribed by pol
II or into transcription units, respectively (
6–8
). Integration
of HIV-1 is known to be directed by the host factor LEDGF
(
9–12
) and MLV integration appears to be positioned by
BET proteins (
13
,
14
). Despite the knowledge that HIV-1
and MLV integrate into specific features of genes and the
observation that Tf1 integrates into promoters, it has not
been possible to quantify integration at specific regions or
sites because there are no methods for measuring insertion
frequencies at individual nucleotide positions.
High-throughput sequencing has greatly increased the
number of positions with integration that can be detected.
However, independent insertions with the same orientation
and genome position result in duplicate sequence reads that
can not be distinguished from duplicates produced by the
polymerase chain reaction (PCR) method used to detect the
insertions. As a result, high-throughput sequencing greatly
increases the number of positions detected but cannot
mea-sure the amount of integration that occurs at individual
po-sitions. Importantly, to understand the molecular details of
integration mechanisms it is critical to distinguish the
posi-tions that are rare sites of integration from the sites that have
high levels of integration. To quantify integration at specific
nucleotide positions we have developed a serial number
sys-tem that generates a unique sequence tag during each
inte-*To whom correspondence should be addressed. Tel: +301 402 4281; Fax: +301 496 4491; Email: henry [email protected]
Present addresses:
Yabin Guo, University of Texas Southwestern Medical Center, 6000 Harry Hines Blvd., Dallas, TX 75390, USA.
Atreyi Ghatak Chatterjee, Department of Biological Sciences, Presidency University, 86/1 College Street, Kolkata 700073, West Bengal, India.
Published by Oxford University Press on behalf of Nucleic Acids Research 2014.
gration event. Although this method could be adopted to
measure the integration of any retrovirus or
retrotranspo-son we describe here the use of the serial number system
with Tf1 as a proof of principle.
Integration of Tf1 into specific promoters was
ini-tially measured in plasmid-encoded targets and the results
showed key nucleotide positions sustained large numbers of
independent insertions (2,3,5). A deletion of a C-terminal
region of integrase (IN) called the chromodomain
(Tf1-CHD) disrupted both the recognition of promoters and the
repeated integration at specific nucleotides (3).
The serial number system allowed us to measure
over-all levels of integration at each promoter and to determine
the genome-wide contribution of the chromodomain to the
pattern of integration. This unique method relies on
ran-dom sequence tags within Tf1 to record the numbers of
in-dependent integration events at single nucleotide positions
throughout the genome of
S. pombe. By inducing the
ex-pression of Tf1 from a library of plasmids containing
se-rial number tags we identified integration at 133 743
po-sitions in the
S. pombe
genome. By tabulating the total
number of serial numbers sequenced at each position we
recorded a total of 1 061 068 independent insertions. We
observed integration numbers at individual positions
var-ied over two orders of magnitude and these frequencies
pro-vided a uniquely precise profile of transposition. We found
that the positions with the highest numbers of insertions
possessed a strong signature of flanking sequence
indicat-ing that sequence recognition plays a much greater role in
targeting integration than previously known.
MATERIALS AND METHODS
Serial number library construction
Plasmids pHL2763 and pHL2770 contain WT and
chro-modomain deleted versions of Tf1-neo, respectively. They
both contain a unique nucleotide tag in the U5 of the
up-stream LTR of Tf1-neo
that distinguishes newly integrated
copies from the pre-existing elements (4). The serial
num-ber plasmid libraries pHL2944 (WT) and pHL2943 (CHD)
were constructed by ligating a PCR-amplified fragment of
250 bp of the upstream LTR into the unique XhoI and
SpeI sites of pHL2763 and pHL2770. The 250 bp fragment
was amplified from pHL2763 using the oligos HL2827 and
HL2828 (See Supplementary Figure S1 for sequences of
oligos). HL2827 included the unique SpeI sequence and a
stretch of 8 nt randomized sequence and HL2828 had the
unique XhoI sequence. The ligated products were
electropo-rated into ElectroMAX DH5a cells (Invitrogen).
Approxi-mately 250 000 and 100 000 cfu(s) were pooled together and
constituted the WT Tf1
s-neo
and the CHD Tf1
s-CHD-neo
libraries, respectively. Plasmid DNA was extracted using the
Mega kit (Qiagen).
Transposition assay
S. pombe
diploid strain YHL5661 was transformed with the
serial number plasmid library of Tf1
s-neo
and Tf1
s-CHD-neo. Approximately 55 000 and 37 000 independent yeast
colonies were pooled together from Edinburgh minimal 2
medium (EMM) plates lacking uracil for the Tf1
s-neo
and
Tf1
s-CHD-neo
libraries, respectively. Thiamine at a
concen-tration of 10
M was added to the plate media to repress the
nmt1
promoter fused to the
neo-marked Tf1. The pooled
cells were mixed at RT for 1 h and then washed four times
with 225 ml of EMM media lacking uracil to remove
thi-amine. Transposition was induced by growing the Tf1
s-neo
and Tf1
s-CHD-neo
yeast serial number libraries at 32
oC in
EMM media in the absence of thiamine to induce the
nmt1
promoter. The Tf1
s-neo
and Tf1
s-CHD-neo
cultures were
passaged with repeated dilutions to optical density (O.D.)
0.05 until they reached 30 and 50 generations, respectively.
Next, the cultures were diluted to O.D. 0.25 with 5-FOA
(5-fluoroorotic acid)-containing EMM media and grown
to O.D. 5.0. This selected against cells retaining the
Tf1-containing plasmids as they contained the
URA3
gene. For
the final step the cultures were diluted 10-fold to O.D. 0.5
with 5-FOA-and G418-containing YES media and grown
to O.D. 5.0 to isolate cells with copies of Tf1
s-neo
and Tf1
s-CHD-neo
that had transposed into the genome.
Quantitative transposition assay
Quantitative transposition assays were performed to
moni-tor the frequencies of transposition as the cultures of Tf1
s-neo
and Tf1
s-CHD-neo
were passaged. The method used
was a modified version of a previously described procedure
(15). In brief, each sequential culture in EMM media
lack-ing thiamine was assayed to determine the increase in
trans-position frequency relative to generation number. Starting
with the undiluted culture a series of five 10-fold dilutions
were made. 0.1 ml of cells from the three lowest dilutions
was then spread onto EMM FOA plates. The same
vol-ume from the three highest dilutions was spread onto EMM
FOA and YES G418 plates. The transposition frequency is
the percentage of FOA
rcells that were also G418
r.
DNA preparation and sequencing
The cells from the final YES cultures containing 5- FOA
and G418 were harvested, genomic DNA was isolated and
samples were prepared for Illumina sequencing as described
previously with some modifications (4). In brief, the
ge-nomic DNA was purified from 200 O.D. units of cells
us-ing zymolyase 100T treatment and spheroblast extraction
(4). MseI was used to fragment the DNA because previous
data indicated this enzyme did not introduce a bias in
detec-tion of inserdetec-tion sites (4) and because in our lab restricdetec-tion
enzyme cleaved ends are more efficiently ligated to linkers
than sonicated DNA fragments. For each library six 2
g
samples of genomic DNA were digested in 100
l volumes
with MseI for 16 h. The digests were purified with the
Qi-agen PCR purification kit. The digested DNA for each
li-brary was eluted in a 50
l volume and used in 10 duplicate
linker ligations with Invitrogen T4 DNA ligase for 1 h at
25
◦C (See Supplementary Figure S1 for sequences of linker
oligos). After heat inactivation at 65
◦C for 10 min, 10 units
of SpeI was added to separate the 5
′LTR from the 3
′LTR
which is used in the amplification of the insertion sites. All
the SpeI cut DNA was used directly as template in 80 PCR
reactions, 20
l per well, with Titanium Taq from Clontech.
LTR amplification primers with barcodes are described in
Supplementary Figure S1B. The PCR program used was:
1. 94
◦C 4 min
2. 94
◦C 15 s
3. 65
◦C 30 s
4. 72
◦C 45 s
5. goto step 2 for a total of six cycles.
6. 94
◦C 15 s
7. 60
◦C 30 s
8. 72
◦C 45 s
9. goto step 6 for a total of 24 cycles.
10. 68
◦C 10 min
11. 4
◦C until sample is retrieved.
All PCR reactions were pooled and divided into 6
sam-ples that were each purified on a separate Qiagen PCR
pu-rification column. Each set of 80 PCR reactions were
puri-fied on a single 10 cm 2% TBE agarose gel. The gels were
run at 70 volts until the dye reached half the length of the
gel. The DNA of size 150–500 bp was cut from the gel and
purified with Qiagen gel extraction kits. The concentration
of the purified DNA was determined with qPCR (KAPA
SYBR FAST kit, Kapa Biosystems) and a fluorimeter using
picogreen. All six libraries were combined and loaded onto
two lanes of an Illumina Genome Analyzer IIx (GAIIx)
de-vice and primer HL2747 was used to sequence 100 nt single
end reads. The sequencing was performed by the Illumina
FastTrack Sequences Services (Hayward, CA, USA).
The description of Data Analysis and the use of Rate
Dis-tortion Theory to remove erroneous serial numbers
gener-ated by Illumina misreads are included in the supplement.
FUNCTIONAL ENRICHMENT ANALYSIS
The intergenic regions were ranked by decreasing number
of integration events. The genes with promoters within the
250 tandem intergenic regions with the highest number of
insertions were selected. The functional enrichment
analy-sis was performed using the genes induced by
environmen-tal stress (16) as query. Significant enrichment was tested
by comparison of the number of genes induced by
environ-mental stress in the 250 highest verses all intergenic regions
(17). The
P
-values were calculated using a hypergeometric
test and corrected by false rate discovery.
P
<
0.01 served
as the cut-off criterion.
Accession number of sequence data
The Illumina data from the Tf1s-
neo
and Tf1s-CHD-
neo
ex-periments was submitted to the Short Read Archive (SRA)
at National Center for Biotechnology Information (NCBI)
under the accession number SRA044888.1.
RESULTS
To study genome-wide integration, a copy of Tf1 marked
with
neo
(Tf1-
neo
) is expressed in
S. pombe
and cells with
insertions are selected on media containing G418 (18,19).
High-throughput sequencing of Tf1-
neo
integration sites
re-lies on amplifying insertions with ligation-mediated PCR
(4). The previous study that demonstrated Tf1-
neo
inte-grates into pol II transcribed promoters measured the
num-ber of positions with integration. However, the numnum-ber of
insertions at each position could not be determined; the
du-plicate sequence reads were discarded because those
gener-ated by independent integration could not be distinguished
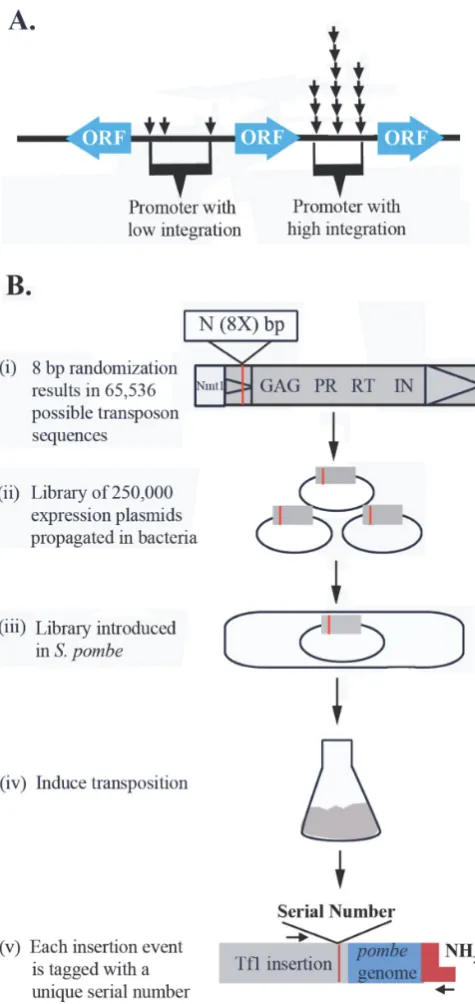
from ones resulting from PCR or cell propagation (Figure
1A).
To measure independent integration events at single
nu-cleotide positions we created a library of Tf1-
neo
expression
plasmids that contained an 8-nucleotide random sequence
in the U5 region of the 5
′LTR (Figure
1B). This random
sequence we call the serial number was positioned in the
U5 section of the LTR at a location previously shown to be
unimportant for self-priming of reverse transcription and
for transposition (Supplementary Figure S2) (18–21). Once
introduced into
S. pombe
the library of 65 536 possible Tf1s
(Tf1
ssignifies the presence of the serial number system)
ele-ments was expressed and cells with integration were selected
in liquid cultures with G418. As a result of reverse
transcrip-tion, the serial numbers were transferred to the U5 of the 3
′LTR. Sequence reads starting in the integrated Tf1
s-
neo
ele-ments recorded the serial number of each insertion and
con-tinued into the insertion site (Figure
1B, v). The number of
independent insertions at each position of integration was
the total number of different serial number sequences
de-tected per site. The raw numbers of independent insertions
were corrected to remove the false serial numbers produced
by Illumina sequence errors. In a representative stretch of
8 bp of LTR sequence
∼
3% of the reads had at least one
nucleotide substitution. In cases where PCR created high
numbers of identical sequences containing the same serial
number and insertion site, 3% of the reads were expected
to produce erroneous serial numbers generated by the
Illu-mina errors. These were identified as clusters of serial
num-bers closely related in sequence to a founder present in high
copy. The method that identified the clusters of erroneous
serial numbers was based on a rate distortion algorithm for
estimating the true number of serial numbers (Supplement).
Serial number analysis of six independent cultures identified
a total of 1 061 068 integration events
To create dense profiles of integration sites and evaluate the
reliability of the serial number system, insertions of
wild-type Tf1s-
neo
were generated in three independent cultures.
The strains used were all diploid so that integration events
would not likely result in strong loss of function and bias the
pattern. In addition, the role of the chromodomain in
posi-tioning integration was tested by creating insertions of
Tf1s-CHD-
neo
in three additional cultures. While the overall
fre-quency of integration of Tf1s-CHD is 14-fold reduced (3),
we were able to obtain complex libraries of insertions.
Inte-gration sites from each of the six cultures were positioned by
sequencing libraries resulting from ligation-mediated PCR
(4). Basic Local Alignment Search Tool analysis
identi-fied a total of 133 743 unique positions in the
S. pombe
re-Figure 1. The serial number system quantifies the number of independent insertions at single nucleotide positions. (A) Two hypothetical promoters each have insertions at three different positions. However, one promoter (right) could have many more insertions at each site than the other. Be-cause the insertion libraries are created by PCR duplicate sequence reads are typically discarded. As a result, two promoters could have very different amounts of integration but be reported to have the same amount of inte-gration. (B) (i) The serial number system was created in Tf1 by inserting 8 bp of random sequence in the U5 region of the 5′LTR (red stripe). Tf1
mRNA was expressed from thenmt1promoter within a library of plasmids. (ii) The library of expression plasmids with the serial number sequences were introduced intoS. pombe(iii) and the expression of Tf1 was induced (iv). (v) Genomic DNA from cells with Tf1 was ligated to linkers (red) and the insertions were amplified by PCR. The products were sequenced with Illumina technology. The sequence primer read across the serial numbers and into the sequence of the insertion sites (blue).
fer to SSPs. Using the number of serial numbers at each
unique position and the correction for sequencing errors, we
recorded a total of 1 061 068 independent integration events
throughout the three chromosomes of
S. pombe
(Table
1). A
wide variation in integration levels was observed
through-out all three chromosomes (Figure
2). The levels of
integra-tion at individual posiintegra-tions varied from 0 to 622
(Supple-mentary Table S1). Comparing all 6 integration data sets,
the percent of positions that had more than one insertion
varied from 40.08% to 27.4%. The percentage of positions
that had greater than 100 insertions varied from 0.57% to
0.01% (Supplementary Tables S1 and S2). To visualize the
number of integrations per site we ordered the positions by
insertion number and displayed this as a graph (Figure
3).
To determine whether the deletion of the chromodomain
altered the distribution of insertions per site, Figure
3
com-pares pooled sets of data with equivalent numbers of
inser-tion posiinser-tions. By comparing similar numbers of posiinser-tions
we found the distribution for WT2 plus WT3 (128 386
po-sitions) was very similar to CHD1 plus CHD2 plus CHD3
(123 881).
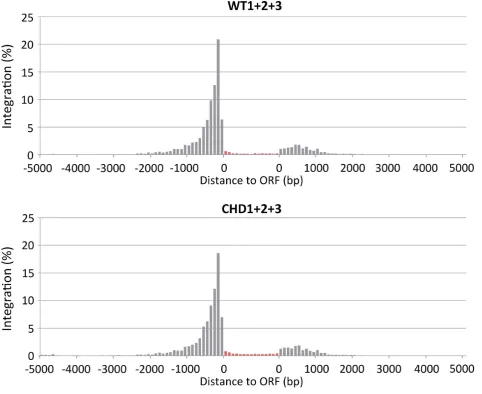
Earlier studies of Tf1 integration revealed that 96.5% of
the insertions occur in intergenic sequences and the
major-ity of the sites cluster upstream of the open reading frames
(ORFs) (4). The integration of the serial number elements
exhibited the same preferences for intergenic sequences (an
average of 96.2% for Tf1
s-neo
and 94.6% for Tf1
s-CHD-neo) and for regions upstream of ORFs (Table
1
and
Fig-ure
4). Previous analyses revealed that the integration levels
in individual intergenic regions varied with
∼
20% of the
re-gions being favored (above random) for integration (4). The
levels of Tf1s-neo
and Tf1s-CHD-neo
integration within
each intergenic region were tabulated and again
∼
20% of
the intergenic sequences had higher integration levels than
the control set of random insertions called the matched
ran-dom control (MRC) (Figure
5
and Supplementary Figure
S3). The intergenic regions with high integration of
Tf1s-neo
correlated well with the intergenic regions that had high
levels of Tf1 integration in our previous study (4). A
lin-ear regression of integration events of Tf1
s-neo
compared
to the number of insertion sites reported previously (4) for
each intergenic sequence produced an
R
2=
0.76. These
in-tergenic sequences with high levels of integration were
pre-viously found to contain significantly higher numbers of
stress response promoters than predicted by the proportion
of stress response genes in the genome (4). This observation
was made using the intergenic sequences between two
tan-dem oriented genes so that we knew which promoters were
targeted by Tf1. Using the data from Tf1s-neo
we identified
the 250 intergenic sequences with the highest number of
in-tegration events and found the downstream genes were
sig-nificantly enriched (adjusted
P-value
=
7.00E-05, see
Ma-terials and Methods) with genes that are induced by stress
as defined by Chen
et al.
(16).
Figure 2. The levels of integration throughout the three chromosomes ofS. pombevaried widely. The integration from WT Tf1s-neo(WT1, WT2 and WT3)
was mapped on the three chromosomes ofS. pombe. TheY-axis is the total number of insertions per nucleotide position. Only insertions that mapped to unique sites are shown. Integration in centromeres, telomeres and repeated regions of the chromosomes is not shown.
Table 1. Summary of integration for each of 6 independent experiments
WT1 WT2 WT3 CHD1 CHD2 CHD3 TOTAL
Integration positions 92 264 68 069 60 317 49 014 41 263 33 604
Independent integration events 455 140 190 478 155 105 110 715 86 391 63 239 1 061 068
% events upstream of ORF 80.2 80.3 80.0 78.4 78.1 78.0
% events in ORF 3.5 3.9 4.0 5.1 5.4 5.6
% events downstream of ORF 16.3 15.8 16.0 16.5 16.5 16.4
Figure 3. The number of insertions per position varied widely. Each of the 128 386 insertion positions of WT2 and WT3 (blue) were ordered on theX -axis from the positions with the highest number of insertions to those with the lowest insertions. TheY-axis is the number of independent insertions at each position. The 123 881 integration positions of CHD1, CHD2 and CHD3 (red) were also ordered and graphed.
reproducibility (R
2>
0.95). We also found that there were
strong correlations in the amounts of intergenic integration
regardless of the deletion of the chromodomain (Tf1
s-neo
versus Tf1
s-CHD-neo,
R
2>
0.75).
The serial number system identified unique features of highly
targeted sites
dis-Figure 4. Integration clustered upstream of ORFs. The integration events produced by WT (Tf1s-neo) and CHD (Tf1s-CHD-neo) versions of Tf1were mapped relative to ORFs. The ORFs ofS. pombewere divided into 15 equal segments (red) and the percentage of the integration within each segment is displayed. Inserts outside of ORFs are displayed upstream or downstream depending on whether they were closer to the 5′or 3′end of the ORF. The
integration outside of the ORFs was displayed in 100 bp intervals.
Table 2. The integration levels within the intergenic regions from 6 independent experiments were compared by linear regression.R2values demonstrated that the integration amounts were highly reproducible.
WT2 WT3 CHD1 CHD2 CHD3
WT1 0.942 0.930 0.801 0.758 0.780
WT2 0.986 0.885 0.858 0.857
WT3 0.891 0.870 0.865
CHD1 0.957 0.963
Figure 5. Approximately 1000 intergenic regions had higher numbers of in-sertions than observed for random integration. All intergenic regions ofS. pombewere ordered on theX-axis based on numbers of integration events and the amount of integration in each intergenic region is plotted on the Y-axis. (A) The integration produced by WT1 (Tf1s-neo) is displayed along
with an equal number of insertions positioned randomly (MRC WT1). (B) The integration of CHD1 (Tf1s-CHD-neo) is compared to an equal
num-ber of insertions positioned randomly (MRC CHD1). The centromeres and telomeres were excluded from the intergenic sequences because they are significantly longer than other intergenic regions.
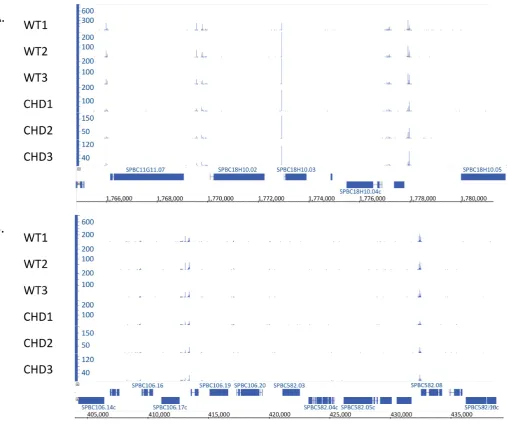
tance from the peak. The width of the peaks was promoter
specific. Other regions exhibited stretches of low level
inte-gration or no insertions at all (Figure
6
B, center). What was
surprising was that some single nucleotide positions
pos-sessed hundreds of independent insertions while the
flank-ing positions had little or no integration (Figure
6
A, center).
The large number of insertion events sequenced with the
serial number system allowed us to detect patterns of
nu-cleotide preferences at the insertion sites. We aligned 128
386 integration positions of Tf1
s-
neo
combined from the
WT2 and WT3 experiments and examined the nucleotide
frequencies of flanking sequence using the logo algorithm
(
22
). The insertion sites possessed a pattern of preferred
nu-cleotides with modest strength that extended 50 bp in
ei-ther direction (Figure
7
A). The preferred nucleotides
flank-ing Tf1s-
neo
inserts formed a palindrome, a pattern
ob-served with other integrating elements that is thought to be
due to stabilizing contacts between the IN and target DNA
(
4
,
8
,
23–26
). To determine whether the chromodomain
con-tributed to the overall pattern of nucleotide preference we
analyzed the 123 881 insertion sites produced by all three
of the Tf1s-CHD-
neo
experiments. The resulting logo was
very similar to that produced by Tf1
s-
neo
indicating that the
chromodomain contributed little to the average pattern of
nucleotide preference (Figure
7
B).
The bulk of integration sites had modest to low levels
of sequence specificity (Figure
7
, bit scores
<
0.1)
suggest-ing that the overall pattern of integration positions was not
the result of nucleotide preferences. However, we wondered
whether the high numbers of independent insertions found
at the ‘hottest’ positions might result from the recognition
of specific nucleotides. To test this possibility we aligned the
50 insertion sites from each collection of Tf1
s-
neo
that had
the highest number of independent insertions. These 150
positions had numbers of independent insertions ranging
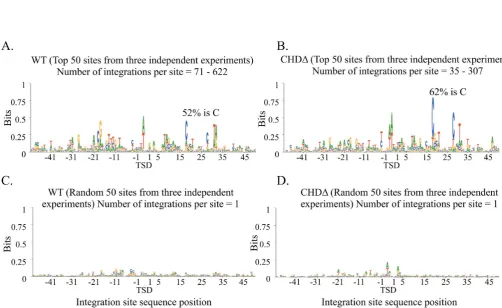
between 71 and 622. The logo pattern from these top
posi-tions possessed a marked increase in nucleotide specificity
with bit scores that in some positions were five times higher
than the scores of the complete set of insertions (Figure
8
A
versus Figure
7
A). The nucleotide preferences of Tf1
lack-ing the chromodomain (Tf1
s-CHD-
neo
), at the 150
posi-tions with the highest number of inserposi-tions also had greatly
increased nucleotide specificity compared to all
Tf1s-CHD-neo
insertions (Figure
8
B versus Figure
7
B). However, the
logo pattern of the top Tf1s-CHD-
neo
sites had nucleotide
specificities higher even than the top sites of wild-type Tf1
(Figure
8
B versus Figure 8A). For example, at position 18
of the top Tf1
s-CHD-
neo
sites, the bit score was nearly 1
because 62% of the sites had a C at this location (Figure
8
B
and Table
3
). The preference for C at position 28 was also
higher in the top Tf1s-CHD-
neo
sites than in the top
Tf1s-neo
sites (Table
3
, 58% versus 43%). In addition to its
height-ened level of specificity, Tf1 lacking the chromodomain
in-tegrated at its top 150 sites with a unique asymmetry (Figure
8
B). The strongest positions of nucleotide preference only
occurred downstream of the insertion sites. This surprising
absence of palindromic symmetry indicates that the
chro-modomain influences the orientation of integration events
and the recognition of nucleotides at the insertion sites with
the highest number or repeated events.
Figure 6.The serial number system revealed unique patterns of integration with measures of independent integration at individual nucleotide positions. (A) and (B) depict two regions of theS. pombegenome in chromosome 2. The number of insertions at each nucleotide position is shown for all 6 experiments.
Table 3. Ratio of the nucleotide frequencies at positions identified in logos of the top 150 positions depicted in Figure8.
Nucleotide(position) Frequency in WT Frequency in CHD Ratio considered Ratio in WT Ratio in CHD
C(18) 52 62
G(-18) 44.66 36.66 C(18)/G(-18) 1.164 1.691
C(28) 43.33 58
G(-28) 36.66 34 C(28)/G(-28) 1.182 1.706
T(31) 57.33 62
Figure 7. The integration of WT (Tf1s-neo) and CHD (Tf1s-CHD-neo) have sequence preferences. (A) The 128 386 insertion sites produced by WT2 and WT3 were aligned and the logo pattern of nucleotide preferences was determined. The positions of the 5 nucleotides at the target sites that are duplicated during integration are indicated by target site duplication (TSD). The height of the nucleotide in the logo represents the bit score associated with the bias and the proportional height of a nucleotide relative to the others at a position constitutes the percent of the insertions that have that specific nucleotide. The A at the center of the palindrome is 35.4% of the height indicating that 35.4% of the insertions had an A at that position. (B) The logo pattern was determined for the 123 881 insertion positions generated by CHD1, CHD2 and CHD3.
Figure 8. The integration positions with the highest number of independent insertions had strong nucleotide preferences. (A) The 50 integration positions
of WT Tf1s-neowith the greatest number of independent insertions were aligned from the WT1, WT2 and WT3 experiments. A logo was generated from
these top 150 sequences. The positions of the 5 nucleotides at the target sites that are duplicated during integration are indicated by TSD. The height of the C at position 18 of the palindrome indicates that 52% of the insertions had a C at this position. (B) A logo was produced by combining the 50 integration
positions of CHD1, CHD2 and CHD3 (Tf1s-CHD-neo) with the highest number of independent insertions. The resulting logo was generated from 150
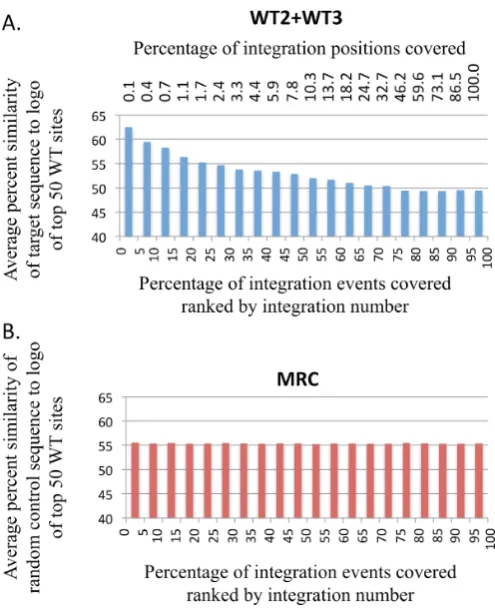
Figure 9. Sequence preference was observed in a substantial proportion of integration events. (A) The 345 583 insertion events produced by Tf1s-neo in the WT2 and WT3 experiments were ranked based on the number of in-dependent insertion events that occurred at their position. The events that occurred at the sites with the greatest number of insertions had the highest ranking while the events that occurred at sites with single insertions had low rankings. These ranked events were put into 20 bins; each included 17 279 events or 5% of the total insertions. Then for the insertion events in each bin we determined the average sequence similarity to the sequence preferences of the top 150 sites shown in Figure8A. (B) 345 583 insertion events (MRC) positionedin silicoat random sites were ranked and orga-nized into 20 bins as in (A).
To test what sequence preference would occur if
integra-tion were random, an equivalent number of randomly
po-sitioned events in an MRC was used to compare to the
logo of the top sites. Each bin had equal percentages of
average similarity (Figure
9
B). These results indicate that
sequence preference played a significant role in the
num-ber of insertion events that occurred at individual
integra-tion sites. Using the same ranking and binning system we
tested the 260 345 insertion events of Tf1
s-CHD-neo
to
de-termine whether the chromodomain contributed to the
in-crease in sequence preferences associated with insertion
po-sitions that had higher numbers of independent integration
events. The 20 bins of Tf1s-CHD-neo
insertions had
increas-ing sequence similarity to the top 150 sites with a pattern
very similar to that of by Tf1s-neo, indicating that the
chro-modomain did not contribute significantly to the overall
contribution of sequence preferences (Supplementary
Fig-ure S4 versus FigFig-ure
9
A).
The results in Figure
9
reveal that sequence recognition
is an important determinant in integration frequency. We
tested whether sequence recognition was sufficient to
pre-dict which genome positions were selected for integration.
Find Individual Motif Occurrences (FIMO) was used to
scan the genome for sequences that matched the logo of
the strongest integration sites (Figure
8
A) with a
P-value
<
3.32E-05 (
27
). Of 98 857 matches we analyzed the top
5000 sequences. While this set had 20 positions with greater
than 200 insertions, these hot spots were a minority. Only
a small fraction of the 5000 matches had more than 10
in-sertion events (Supplementary Figure S5). In addition, the
positions with over 200 inserts had match scores to the logo
that distributed evenly throughout the set of 5000 positions
sorted by match score. These 5000 matches to the logo of
strong integration sites showed no preference for sequences
upstream of ORFs (Supplementary Figure S6). We
con-clude that matching the recognition sequence in the logo is
just one determinant in the integration process. The
mech-anism that targets promoters is another determinant.
DISCUSSION
The serial number system described here provides a
solu-tion to the significant problem that deep sequencing of
in-tegration sites cannot determine the frequencies of insertion
at individual nucleotide positions. Previous profiles of
inte-gration supplied a yes or no answer to whether inteinte-gration
occurred at any given position. By tagging each insertion
with an independent serial number we generated saturating
profiles of integration sites that measured the frequency of
integration at each position. With this technology we
identi-fied a combined total of 1.1 million insertion events of
Tf1s-neo
and Tf1
s-CHD-neo
at sites that had between 1 and 622
independent insertions in the genome of
S. pombe. Insertion
sites had frequencies of integration that varied over two
or-ders of magnitude.
The highly dense and reproducible profile of integration
reported here allowed us to test the role of the IN
chro-modomain in positioning Tf1 insertions. Although
previ-ous studies of integration in target plasmids indicated the
chromodomain was required for positioning insertions in
promoters (
3
), we found here that deletion of the
chromod-omain resulted in no substantial change in the
genome-wide distribution of integration. It appears that the
previ-ous studies of integration sites in plasmids, were subject to
alternative constraints that influenced integration. These
al-ternative interactions or constrains did not occur when the
insertions were positioned in chromosomal targets.
Sequence preferences contributed significantly to integration
frequency at insertion sites
inser-tion site sequence had on the genome-wide profile of
inte-gration. By ranking all integration events by the frequency
of their repeated insertion we found that sequence
prefer-ence contributed to the efficiency of integration for 75% of
the events. Importantly, we found that these events, the 75%
of the insertion events, occurred at just 33% of the insertion
positions. Without the serial number system we would have
been unable to account for the positions of this 75% of the
activity. And as a result of the precision provided by the
se-rial number system, we discovered that the bulk of
integra-tion activity occurred at sites with a sequence signature.
Although the chromodomain did not contribute
signifi-cantly to the overall pattern of integration it did play a role
in sequence recognition at insertion sites with high numbers
of events. Interestingly, integration at the top 150 positions
of Tf1 lacking the chromodomain exhibited a unique
asym-metric pattern of preferred nucleotides (Figure
8
B). The
asymmetry in this logo indicates that at the top insertion
sites IN lacking the chromodomain was defective in
medi-ating integration in one of the two orientations. Despite this
reduction in one orientation of integration the remaining
in-sertion events retained the same sequence preference
down-stream of the insertion sites. As there was a reduction in one
orientation of integration the sequence preferences
down-stream were more pronounced. This is another important
observation that was only made possible with the frequency
data provided by the serial number system.
Understanding the contribution of specific nucleotides to
integration efficiency will lead to important structural and
mechanistic information about the complex of IN, donor
DNA and the target DNA. For example, x-ray crystal
struc-tures of the prototype foamy retrovirus (PFV) IN
identi-fied contacts between amino acids and specific nucleotides
in target DNA(
25
,
28
). Arg329 of IN is hydrogen bonded to
guanine 3, guanine 21 and thymine 22 in the target DNA.
Serial number data of PFV integration would be
instrumen-tal in measuring the frequency of integration at insertion
sites and in testing how mutations in Arg329 change the
fre-quency of integration at specific positions. Since the design
of the serial number system can be readily incorporated into
any retroviral or retrotransposon expression vector,
exper-iments testing the role of individual amino acid residues in
target site preference can now be conducted.
Retrovirus vectors have been adapted for introducing
therapeutic genes into cells of patients in clinical trials.
However, depending on the positions of integration they
have caused leukemia by activating oncogenes (
29–33
). To
gage the safety of new retrovirus vectors for gene therapy
it is necessary to develop saturating profiles of integration
sites. The extraordinary capacity of new deep sequencing
technology now makes it possible to achieve these highly
dense profiles. However, this tremendous increase in
capac-ity also diminishes the distinction between highly targeted
positions and rare insertion sites. Retrovirus vectors can be
readily modified in U5 sequence in the 3
′LTR and this could
be used to generate serial numbers that tag unique
inser-tions (
34
). The application of the serial number design for
retroviruses would reveal the frequency of integration at
in-dividual sites and as a result would provide true integration
levels adjacent to cancer genes.
SUPPLEMENTARY DATA
Supplementary Data
are available at NAR Online.
FUNDING
Intramural Research Program of the National Institutes of
Health (NIH) from the Eunice Kennedy Shriver National
Institute of Child Health and Human Development.
Intra-mural Research Program of the NIH, Center for
Informa-tion Technology [to P.G.M.]. Source of open access funding:
Publication charges will be paid by the Intramural Research
Program of the NIH from the Eunice Kennedy Shriver
Na-tional Institute of Child Health and Human Development.
Conflict of interest statement.
None declared.
REFERENCES
1. Levin, H.L. and Moran, J.V. Levin, H.L. and Moran, J.V. (2011) Dynamic interactions between transposable elements and their hosts.
Nat. Rev. Genet.,12, 615–627.
2. Leem, Y.E., Ripmaster, T.L., Kelly, F.D., Ebina, H., Heincelman, M.E., Zhang, K., Grewal, S.I.S., Hoffman, C.S., and Levin, H.L.Leem, Y.E., Ripmaster, T.L., Kelly, F.D., Ebina, H., Heincelman, M.E., Zhang, K., Grewal, S.I.S., Hoffman, C.S., and Levin, H.L. (2008) Retrotransposon Tf1 is targeted to pol II promoters by transcription activators.Mol. Cell,30, 98–107. 3. Chatterjee, A.G., Leem, Y.E., Kelly, F.D., and Levin, H.L.Chatterjee,
A.G., Leem, Y.E., Kelly, F.D., and Levin, H.L. (2009) The chromodomain of Tf1 integrase promotes binding to cDNA and mediates target site selection.J. Virol.,83, 2675–2685.
4. Guo, Y. and Levin, H.L.Guo, Y. and Levin, H.L. (2010)
High-throughput sequencing of retrotransposon integration provides a saturated profile of target activity in Schizosaccharomyces pombe.
Genome Res.,20, 239–248.
5. Majumdar, A., Chatterjee, A.G., Ripmaster, T.L., and Levin, H.L.Majumdar, A., Chatterjee, A.G., Ripmaster, T.L., and Levin, H.L. (2011) The determinants that specify the integration pattern of retrotransposon Tf1 in the fbp1 promoter of Schizosaccharomyces pombe.J. Virol.,85, 519–529.
6. Schroder, A.R., Shinn, P., Chen, H., Berry, C., Ecker, J.R., and Bushman, F.Schroder, A.R., Shinn, P., Chen, H., Berry, C., Ecker, J.R., and Bushman, F. (2002) HIV-1 integration in the human genome favors active genes and local hotspots.Cell,110, 521–529.
7. Wu, X.L., Li, Y., Crise, B., and Burgess, S.M.Wu, X.L., Li, Y., Crise, B., and Burgess, S.M. (2003) Transcription start regions in the human genome are favored targets for MLV integration.Science,300, 1749–1751.
8. Wang, G.P., Ciuffi, A., Leipzig, J., Berry, C.C., and Bushman, F.D.Wang, G.P., Ciuffi, A., Leipzig, J., Berry, C.C., and Bushman, F.D. (2007) HIV integration site selection: analysis by massively parallel pyrosequencing reveals association with epigenetic modifications.Genome Res.,17, 1186–1194.
9. Ciuffi, A., Llano, M., Poeschla, E., Hoffmann, C., Leipzig, J., Shinn, P., Ecker, J.R., and Bushman, F.Ciuffi, A., Llano, M., Poeschla, E., Hoffmann, C., Leipzig, J., Shinn, P., Ecker, J.R., and Bushman, F. (2005) A role for LEDGF/p75 in targeting HIV DNA integration.
Nat. Med.,11, 1287–1289.
10. Llano, M., Saenz, D.T., Meehan, A., Wongthida, P., Peretz, M., Walker, W.H., Teo, W., and Poeschla, E.M. Llano, M., Saenz, D.T., Meehan, A., Wongthida, P., Peretz, M., Walker, W.H., Teo, W., and Poeschla, E.M. (2006) An essential role for LEDGF/p75 in HIV integration.Science,314, 461–464.
11. Shun, M.C., Raghavendra, N.K., Vandegraaff, N., Daigle, J.E., Hughes, S., Kellam, P., Cherepanov, P., and Engelman, A.Shun, M.C., Raghavendra, N.K., Vandegraaff, N., Daigle, J.E., Hughes, S., Kellam, P., Cherepanov, P., and Engelman, A. (2007) LEDGF/p75 functions downstream from preintegration complex formation to effect gene-specific HIV-1 integration.Genes Dev.,21, 1767–1778. 12. Ferris, A.L., Wu, X., Hughes, C.M., Stewart, C., Smith, S.J., Milne,
et al.Ferris, A.L., Wu, X., Hughes, C.M., Stewart, C., Smith, S.J., Milne, T.A., Wang, G.G., Shun, M.C., Allis, C.D., and Engelman, A. (2010) Lens epithelium-derived growth factor fusion proteins redirect HIV-1 DNA integration.Proc. Natl. Acad. Sci. U.S.A.,107, 3135–3140.
13. Sharma, A., Larue, R.C., Plumb, M.R., Malani, N., Male, F., Slaughter, A., Kessl, J.J., Shkriabai, N., Coward, E., and Aiyer, S.S.
et al.Sharma, A., Larue, R.C., Plumb, M.R., Malani, N., Male, F.,
Slaughter, A., Kessl, J.J., Shkriabai, N., Coward, E., and Aiyer, S.S. (2013) BET proteins promote efficient murine leukemia virus integration at transcription start sites.Proc. Natl. Acad. Sci. U.S.A.,
110, 12036–12041.
14. Gupta, S.S., Maetzig, T., Maertens, G.N., Sharif, A., Rothe, M., Weidner-Glunde, M., Galla, M., Schambach, A., Cherepanov, P., and Schulz, T.F.Gupta, S.S., Maetzig, T., Maertens, G.N., Sharif, A., Rothe, M., Weidner-Glunde, M., Galla, M., Schambach, A., Cherepanov, P., and Schulz, T.F. (2013) Bromo and ET domain (BET) chromatin regulators serve as co-factors for murine leukemia virus integration.J. Virol.,87, 12721–12736.
15. Park, J.M., Evertts, A.G., and Levin, H.L.Park, J.M., Evertts, A.G., and Levin, H.L. (2009) The Hermes transposon of Musca domestica and its use as a mutagen of Schizosaccharomyces pombe.Methods,
49, 243–247.
16. Chen, D.R., Toone, W.M., Mata, J., Lyne, R., Burns, G., Kivinen, K., Brazma, A., Jones, N., and Bahler, J.Chen, D.R., Toone, W.M., Mata, J., Lyne, R., Burns, G., Kivinen, K., Brazma, A., Jones, N., and Bahler, J. (2003) Global transcriptional responses of fission yeast to environmental stress.Mol. Biol. Cell,14, 214–229.
17. Pike, N.Pike, N. (2011) Using false discovery rates for multiple comparisons in ecology and evolution.Methods Ecol. Evol.,2, 278–282.
18. Levin, H.L.Levin, H.L. (1995) A novel mechanism of self-primed reverse transcription defines a new family of retroelements.Mol. Cell.
Biol.,15, 3310–3317.
19. Levin, H.L.Levin, H.L. (1996) An unusual mechanism of self-primed reverse transcription requires the RNase H domain of reverse transcriptase to cleave an RNA duplex.Mol. Cell. Biol.,16, 5645–5654.
20. Lin, J.H. and Levin, H.L.Lin, J.H. and Levin, H.L. (1997) A complex structure in the mRNA of Tf1 is recognized and cleaved to generate the primer of reverse transcription.Genes Dev.,11, 270–285. 21. Lin, J.H. and Levin, H.L.Lin, J.H. and Levin, H.L. (1998) Reverse
transcription of a self-primed retrotransposon requires an RNA structure similar to the U5-IR stem-loop of retroviruses.Mol. Cell.
Biol.,18, 6859–6869.
22. Schneider, T.D. and Stephens, R.M.Schneider, T.D. and Stephens, R.M. (1990) Sequence logos: a new way to display consensus sequences.Nucleic Acids Res.,18, 6097–6100.
23. Holman, A.G. and Coffin, J.M.Holman, A.G. and Coffin, J.M. (2005) Symmetrical base preferences surrounding HIV-1, avian
sarcoma/leukosis virus, and murine leukemia virus integration sites.
Proc. Natl. Acad. Sci. U.S.A.,102, 6103–6107.
24. Wu, X., Li, Y., Crise, B., Burgess, S.M., and Munroe, D.J.Wu, X., Li, Y., Crise, B., Burgess, S.M., and Munroe, D.J. (2005) Weak
palindromic consensus sequences are a common feature found at the integration target sites of many retroviruses.J. Virol.,79, 5211–5214. 25. Maertens, G.N., Hare, S., and Cherepanov, P.Maertens, G.N., Hare, S., and Cherepanov, P. (2010) The mechanism of retroviral integration from X-ray structures of its key intermediates.Nature,468, 326–329. 26. Gangadharan, S., Mularoni, L., Fain-Thornton, J., Wheelan, S.J.,
and Craig, N.L.Gangadharan, S., Mularoni, L., Fain-Thornton, J., Wheelan, S.J., and Craig, N.L. (2010) Inaugural Article: DNA transposon Hermes inserts into DNA in nucleosome-free regions in vivo.Proc. Natl. Acad. Sci. U.S.A.,107, 21966–21972.
27. Grant, C.E., Bailey, T.L., and Noble, W.S.Grant, C.E., Bailey, T.L., and Noble, W.S. (2011) FIMO: scanning for occurrences of a given motif.Bioinformatics,27, 1017–1018.
28. Hare, S., Gupta, S.S., Valkov, E., Engelman, A., and Cherepanov, P.Hare, S., Gupta, S.S., Valkov, E., Engelman, A., and Cherepanov, P. (2010) Retroviral intasome assembly and inhibition of DNA strand transfer.Nature,464, 232–236.
29. Hacein-Bey-Abina, S., Garrigue, A., Wang, G.P., Soulier, J., Lim, A., Morillon, E., Clappier, E., Caccavelli, L., Delabesse, E., and Beldjord, K.et al.Hacein-Bey-Abina, S., Garrigue, A., Wang, G.P., Soulier, J., Lim, A., Morillon, E., Clappier, E., Caccavelli, L., Delabesse, E., and Beldjord, K. (2008) Insertional oncogenesis in 4 patients after retrovirus-mediated gene therapy of SCID-X1.J. Clin.
Invest.,118, 3132–3142.
30. Hacein-Bey-Abina, S., Hauer, J., Lim, A., Picard, C., Wang, G.P., Berry, C.C., Martinache, C., Rieux-Laucat, F., Latour, S., and Belohradsky, B.H.et al.Hacein-Bey-Abina, S., Hauer, J., Lim, A., Picard, C., Wang, G.P., Berry, C.C., Martinache, C., Rieux-Laucat, F., Latour, S., and Belohradsky, B.H. (2010) Efficacy of gene therapy for X-linked severe combined immunodeficiency.N. Engl. J. Med.,
363, 355–364.
31. Hacein-Bey-Abina, S., Von Kalle, C., Schmidt, M., McCcormack, M.P., Wulffraat, N., Leboulch, P., Lim, A., Osborne, C.S., Pawliuk, R., and Morillon, E.et al.Hacein-Bey-Abina, S., Von Kalle, C., Schmidt, M., McCcormack, M.P., Wulffraat, N., Leboulch, P., Lim, A., Osborne, C.S., Pawliuk, R., and Morillon, E. (2003)
LMO2-associated clonal T cell proliferation in two patients after gene therapy for SCID-X1.Science,302, 415–419.
32. Deichmann, A., Brugman, M.H., Bartholomae, C.C.,
Schwarzwaelder, K., Verstegen, M.M., Howe, S.J., Arens, A., Ott, M.G., Hoelzer, D., and Seger, R.et al.Deichmann, A., Brugman, M.H., Bartholomae, C.C., Schwarzwaelder, K., Verstegen, M.M., Howe, S.J., Arens, A., Ott, M.G., Hoelzer, D., and Seger, R. (2011) Insertion sites in engrafted cells cluster within a limited repertoire of genomic areas after gammaretroviral vector gene therapy.Mol. Ther.,
19, 2031–2039.
33. Fischer, A., Hacein-Bey-Abina, S., and Cavazzana-Calvo, M.Fischer, A., Hacein-Bey-Abina, S., and Cavazzana-Calvo, M. (2013) Gene therapy of primary T cell immunodeficiencies.Gene,525, 170–173. 34. Yu, S.F., von Ruden, T., Kantoff, P.W., Garber, C., Seiberg, M.,
Ruther, U., Anderson, W.F., Wagner, E.F., and Gilboa, E.Yu, S.F., von Ruden, T., Kantoff, P.W., Garber, C., Seiberg, M., Ruther, U., Anderson, W.F., Wagner, E.F., and Gilboa, E. (1986) Self-inactivating retroviral vectors designed for transfer of whole genes into