DOI 10.1007/s10640-009-9263-y
Adoption of Pollution Prevention Techniques: The Role
of Management Systems and Regulatory Pressures
Madhu Khanna· George Deltas · Donna Ramirez Harrington
Received: 16 September 2008 / Accepted: 9 January 2009 / Published online: 7 February 2009 © Springer Science+Business Media B.V. 2009
Abstract This paper investigates the extent to which firm level technological change that reduces unregulated emissions is driven by regulatory pressures, and firms’ technological and organizational capabilities. Using a treatment effects model with panel data for a sam-ple of S&P 500 firms over the period 1994–1996, we find that organizational change in the form of Total Quality Environmental Management leads firms to adopt pollution prevention practices, after controlling for the effects of various regulatory pressures and firm-specific characteristics. We find that the threat of anticipated regulations and the presence of ‘comple-mentary assets’ is important for creating the incentives and an internal capacity to undertake incremental adoption of pollution prevention techniques.
Keywords Environmental management·Toxic releases·Total Quality Management
JEL Classification O32·O38·Q2
Senior authorship is not assigned. M. Khanna (
B
)Department of Agricultural and Consumer Economics, University of Illinois, 1301 W. Gregory Drive, Urbana, IL 61801, USA
e-mail: [email protected]; [email protected] G. Deltas
Department of Economics, University of Illinois, 1206 S. Sixth Street, Champaign, IL 61820, USA e-mail: [email protected]
D. R. Harrington
1 Introduction
Command and control environmental regulations in the US have typically sought to control pollution after it has been generated. The steeply rising costs of these regulations (these costs increased by more than 50% between 1990–2000)1 and their negative impact on the
productivity of regulated firms (see survey inGray and Shadbegian 1995) have shifted the attention of environmental regulators and firms towards flexible environmental strategies that target the reduction of pollution at source. The US National Pollution Prevention Act of 1990 emphasizes pollution prevention rather than end-of-pipe pollution control as the preferred method of pollution reduction. However, it does not mandate adoption of pollution prevention technologies. Instead, the USEPA has sought to induce voluntary adoption of such technologies through the promotion of environmental management systems that induce firms to take a holistic view of pollution control and reduce waste generation at source (Crow 2000;USEPA 1997,1998;USGAO 1994). This paper investigates the influence of a firm’s environmental management system and other internal and external factors on the extent to which the firm adopts pollution prevention technologies.
An environmental management system typically embodies the concept of Total Quality Management which emphasizes prevention over detection, continuous progress in product quality by minimizing defects, and quality improvement across all aspects of the industrial process. Application of these principles to environmental management, referred to as Total Quality Environmental Management (TQEM),2can lead firms to apply the same systems
per-spective to prevent pollution problems. Under TQEM, pollution is viewed as a quality defect to be continuously reduced through the development of products and processes that minimize waste generation at source. Case studies of leading firms, such as Kodak, Polaroid, Xerox and L’Oreal show how TQEM principles and tools led them to implement techniques that reduce waste and improve the quality and environmental friendliness of their processes and products (Ploch and Wlodarczyk 2000;Breeden et al. 1994;Wever and Vorhauer 1993;McGee and Bhushan 1993;Nash et al. 1992). An in-depth study of firms led thePresident’s Commission on Environmental Quality(1993) to conclude that quality management principles and pollu-tion prevenpollu-tion are complementary concepts; a finding reinforced by subsequent surveys of firms which show that firms that adopted pollution prevention practices were more likely to be those practicing TQEM.3However, there has been no systematic empirical determination
of a link between TQEM and the adoption of new pollution prevention technologies. More-over, while TQEM provides a framework that encourages pollution prevention, it does not guarantee that firms will choose to do so. Firms may instead resort to other ways to control pollution such as recycling or reusing waste. Alternatively, firms may adopt TQEM simply to
1http://yosemite1.epa.gov/ee/epalib/ord1.nsf/77e34926d19d5664852565a500501ed6/335eadf82010591085
2565d00067efc6!OpenDocument.
2The Global Environmental Management Initiative (GEMI) is recognized as the creator of TQEM which
embodies four key principles: customer identification, continuous improvement, doing the job right first time, and a systems approach (http://www.bsdglobal.com/tools/systems_TQEM.asp).
3A survey of US manufacturing firms in 1995 byFlorida(1996) found that 60% of respondents considered
convey a visible signal of an environmentally responsible firm among external stakeholders (Shaw and Epstein 2000).4
In addition to the influence of a firm’s management system, we also investigate the effects of other factors, such as its technical capabilities and the regulatory pressures it faces, on the extent to which a firm adopts pollution prevention technologies. Adoption of pollution prevention technologies is likely to require technical expertise and related experience. This is based on the premise that even though generic knowledge about ways to prevent pollution already exists, strategies to prevent pollution need to be customized to the particular produc-tion processes and products of the adopting firm. External pressure from mandatory regula-tions could also have an impact on the environmental innovativeness of firms even though these regulations do not directly require firms to adopt pollution prevention technologies. Regulatory pressures can create incentives to adopt such technologies if these technologies have synergistic effects on reducing emissions of regulated pollutants and thereby reduc-ing current or anticipated costs of compliance. Firms may also voluntarily adopt pollution prevention technologies to serve as a signal of environmentally responsibility and reduce regulatory scrutiny and the stringency with which environmental regulations are enforced.
We conduct this analysis using an unbalanced panel of 167 firms from the S&P 500 list which reported to the Toxics Release Inventory (TRI) and responded to the survey on adoption of environmental management practices conducted by the Investor Research Responsibility Center over the period 1994–1996. Our study controls for the heterogeneity among firms in a broad range of characteristics while analyzing the impact of technological capabilities, regulatory pressures and TQEM on the adoption of pollution prevention technologies. We address the potential endogeneity of the TQEM adoption by using an instrumental variable approach. We exploit the panel nature of our dataset to test for and implement two ways to account for intertemporal dependence of a firm’s decision to adopt pollution prevention activities, one which allows for first order auto-correlation in the errors and the other that allows for firm-specific random effects.
Previous studies have used conceptual analysis and case studies in management and orga-nizational theory to show that orgaorga-nizational structure of the firm can affect its speed in adopting productivity enhancing innovations and its ability to realize the benefits of technol-ogy adoption. In particular, an effective management system with clear policies, organiza-tional structure, tracking and reporting mechanisms and performance measures is needed to induce environmental innovations (DeCanio et al. 2000;Breeden et al. 1994). Several empir-ical studies find that environmental regulatory pressures led to environmental innovation (Lanjuow and Mody 1996;Jaffe and Palmer 1997;Gray and Shadbegian 1998;Brunnermeir and Cohen 2003;Pickman 1998). These studies use either industry expenditures on R&D or aggregate number of patents as a proxy for innovation and industry pollution abatement costs as a measure of regulatory pressures (with the exception ofGray and Shadbegian
(1998) who use plant level data). A related study byCleff and Rennings(1999) examines the perceived importance of various types of environmental policy instruments on the discrete self-classification of firms as being environmentally innovative and finds that firms perceived voluntary programs (eco-labels and voluntary commitments) to be important in encouraging product and process innovation.
4For example,Howard et al.(2000) found that Responsible Care participants were more likely to implement
Studies of environmental management systems (survey inKhanna 2001) have examined the motivations for adopting an environmental plan (Henriques and Sadorsky 1996), seek-ing ISO certification (Anderson et al. 1999;Dasgupta et al. 2000;King and Lenox 2001;
Nakamura et al. 2001), adopting a more comprehensive environmental management system (Khanna and Anton 2002;Anton et al. 2004) and participating in the Responsible Care Program (King and Lenox 2000).5 Another related set of studies has examined the impli-cations of such initiatives by firms for their environmental performance, measured by toxic releases (Arimura et al. 2008;Barla 2007;Ziegler and Rennings 2004;King and Lenox 2000;
Anton et al. 2004;Dasgupta et al. 2000). These studies find mixed evidence of the effects of changes in environmental management on environmental performance (see review inKhanna and Brouhle forthcoming).Potoski and Prakash(2005),Arimura et al.(2008),Anton et al.
(2004), andDasgupta et al.(2000) find that adoption of environmental management systems enables firms to reduce their environmental impacts whileDahlstrom et al.(2003) andBarla
(2007) find evidence to the contrary.
A few studies examine the effect of a management system on the environmental innova-tion behavior of facilities.Ziegler and Rennings(2004) found that EMS certification does not significantly affect environmental innovation and abatement behavior at German manu-facturing facilities. Similarly,Arimura et al.(2007), using R&D expenditures as a proxy for environmental innovation, find that management systems did not lead to more environmental R&D.Frondel et al.(2007) examine whether a facility adopted an end-of-pipe technology or a cleaner production technology and find that management systems motivated adoption of both types of technologies.
This paper makes several contributions to the literature on the determinants of envi-ronmental innovations. Unlike the previous literature which has used either aggregate and broad measures of innovation such as industry expenditures and patent counts or has used discrete indicators of technology adoption, we use detailed micro data on a specific type of environmental innovation, namely count of adoption of 43 types of pollution prevention tech-niques adopted by firms to reduce their toxic releases as reported annually to the USEPA’s Toxics Releases Inventory (TRI). These pollution prevention practices range from product and process changes to changes in operating procedures. Moreover, we analyze the effects of organizational structure on environmental innovation using a treatment effects model that allows us to control for the endogeneity of the TQEM adoption decision. We also analyze the impact of various types of environmental regulations, both existing and anticipated, on pollution prevention.
2 Conceptual Framework
We consider profit maximizing firms that are emitting toxic releases which are not directly subject to any penalties or other regulations. Despite the absence of regulation, firms may have several motivations to reduce the releases of these pollutants voluntarily. These motiva-tions could be internal, that is, generated by the firm’s management philosophy and technical capacity, or external, that is, arising from the firm’s interaction with external stakeholders, including environmental regulators, environmental interest groups and consumer groups. These stakeholders have the potential to take actions that affect the costs of compliance, market share, reputation and image of firms. All of these developments have increased the
5Several studies also investigate the motivations for firms to participate in public voluntary programs such
incentives for firms to make proactive efforts to reduce their unregulated toxic releases. In the absence of any mandated technology standards, firms have flexibility in choosing either pollution prevention or end-of-pipe technologies for controlling such releases.
Interest in pollution prevention has grown among firms with the passage of the Pollution Prevention Act and due to increasing costs of end-of-pipe disposal. Underlying the concept of pollution prevention is the premise that pollution is caused by a wasteful use of resources; thus, a reduction in these wastes through changes in production methods that increase production efficiency can lead to input cost-savings, higher productivity, lower costs of pollution control and disposal and lower risk of environmental liabilities relative to using end-of-pipe technol-ogies (Porter and van der Linde 1995;Florida 1996). The adoption of pollution prevention activities could also confer a second benefit to firms seeking to improve their environmen-tal image. While emissions reductions from some unobserved counterfactual level may be sometimes hard to ascertain, pollution prevention activities provide tangible evidence to the public and to regulators that the firm is proactively engaged in abatement using methods not mandated by law. Although, recognition of the net benefits of adopting pollution prevention technologies is likely to have been increasing among all firms, we expect these benefits to differ across heterogeneous firms. Next, we discuss our measure of adoption of pollution prevention techniques.
Our dependent variable is the count of new pollution prevention techniques adopted by a firm during a year. Since pollution prevention is popularly referred to as P2, we call this var-iableNew P2. Each facility of a firm is required to report new adoption of any of 43 different activities to prevent pollution for each toxic chemical to TRI in a given year. These activities are broadly categorized into changes in operating practices, materials and inventory control, spill and leak prevention, raw material modifications, equipment and process modifications, rinsing and draining equipment design and maintenance, cleaning and finishing practices, and product modifications. Each facility can report up to four different P2 activities adopted for controlling the level of releases of each chemical.
We use two different methods for aggregating the number of P2 practices across cat-egories of practices, across chemicals, and across facilities belonging to the same parent company. First, we simply aggregate the number of all P2 practices adopted in a year across all chemicals for each facility and then across all facilities belonging to a parent company to obtainNew P2at the firm-level for that year.6Second, we weight each facility’s P2 activities
(summed over chemicals as under the first method above) by its share in the five-year lagged toxic releases of the parent company and obtain aWeighted Sum of New P2at the firm level. Facilities with fewer P2 activities per chemical, fewer numbers of chemicals and a smaller share in lagged toxic releases of the firm would contribute less to this measure of firm level Weighted Sum of New P2.
We now discuss the specific factors, first the internal factors, including management sys-tem, and external factors, that can explain environmental innovativeness of firms.
2.1 Internal Factors
Profit maximizing firms can be expected to adopt pollution prevention activities according to their ability to identify profitable techniques and their learning costs of adoption. Two internal factors may influence their ability and adoption costs. The first of these is the firm’s techno-logical capabilities. These are also referred to as “complementary internal expertise/assets”
6It is extremely rare in our sample that a firm reports four P2 activities for a particular chemical. Thus,
or “absorptive capacity” (Cohen and Levinthal 1994). These capabilities depend on the level of in-house technical sophistication.7 Several scholars have demonstrated the relationship between the knowledge resources and capabilities/competencies of a firm and its innova-tiveness (Teece et al. 1997;Cohen and Levinthal 1989,1994).Cohen and Levinthal(1989) contend that R&D expenditures not only generate new information but also enhance the firm’s ability to assimilate and exploit existing information, that is, a firm’s ‘learning’ or ‘absorptive’ capacity.8This suggests that proactive efforts at reducing pollution do not occur in a vacuum. Instead, they are associated with broader and previous efforts of a firm to be innovative.9
Surveys of firms suggest that adopters of pollution prevention techniques are more inno-vative in general, with higher R&D intensity and a history of more frequent new product introductions and product design changes (Florida 1996;Florida and Jenkins 1996).Canon de Francia et al.(2007) find that firms with greater technological knowledge, proxied by the depreciated sum of R&D expenditures in the past, were considered by financial markets to be able to adapt at lower cost to the provisions of the Integrated Pollution Prevention and Control Act in Spain. Thus, we hypothesize that firms that have stronger technical capabilities have greater absorptive capacity for other technological innovations and are more likely to adopt more pollution prevention techniques. We measure a firm’s absorptive capacity by itsR&D Intensity, defined as the ratio of its annual R&D expenditures over its annual sales.
The second internal factor that could influence the adoption of pollution prevention tech-nologies is the organizational structure of the firm. The managerial literature argues that organizational systems are critical to the innovativeness of firms because they condition firm responses to challenges and ability to realize the full benefits of cost-reducing or productivity enhancing technologies (Teece and Pisano 1994;DeCanio et al. 2000). In particular, TQEM creates an organizational framework that encourages continuous improvement in efficiency and product quality through systematic analysis of processes to identify opportunities for reducing waste in the form of pollution. The TQEM tool-kit of senior management commit-ment, team-work, empowerment of employees at all levels, and techniques such as process mapping, root cause analysis and environmental accounting can enable the firm to become aware of inefficiencies that were not recognized previously and to find new ways to increase efficiency and reduce the costs of pollution control (Wlodarczyk et al. 2000). This may lead the firm to see the value of developing products and processes that minimize waste from “cradle to grave” rather than focusing only on end-of-pipe pollution control. The conceptual relationship between TQEM and pollution prevention suggests that firms that adopt TQEM are likely to adopt more pollution prevention techniques.
We defineTQEMas a dummy variable equal to 1 if a firm adopted TQEM in a particular year and zero otherwise. It is important to note here thatTQEMcould be an endogenous variable. For example, (unobserved) managerial preferences could influence the adoption of bothTQEMand pollution prevention techniques. We discuss this issue and our methods for accounting for it in the next section.
7These capabilities or specialized assets are firm-specific. They are acquired over time, are non-substitutable
and imperfectly imitable, such as firm-specific human capital, R&D capability and brand loyalty. They can enable firms to adopt new technologies at lower cost (Dierickx and Cool 1989).
8Blundell et al.(1995) find that the stock of innovations accumulated in the past was significant in explaining
current innovations.Christmann(2000) finds that complementary assets in the form of R&D intensity of the firm determine the competitive advantage that a firm receives from adopting P2 strategies.
9More generally, prior research suggests that firms cannot costlessly exploit external knowledge, but must
2.2 Regulatory Pressures
In addition to internal pressures that influence firms’ decision to adopt P2 activities, profit maximizing firms are also influenced by existing and anticipated regulations. Existing reg-ulations, that are primarily in the form of end-of-pipe technology standards, may create disincentives for voluntary adoption of pollution prevention technologies. Theoretical stud-ies byDowning and White(1986) andMilliman and Prince(1989) show that the incentive to innovate is stronger under market-based systems (e.g. emission fees or permits) than under command and control regulations because the gains through lower costs of compliance with innovation are much higher with market based policies. Additionally, by diverting resources towards compliance with technology standards and promoting a reactive approach to com-pliance, command and control regulations can reduce incentives to be innovative. However, these studies ignore the potential for firms to influence the stringency with which regulations are enforced, to preempt or influence future regulations (asSegerson and Miceli 1998;Lutz et al. 2000) or to indirectly lower costs of compliance through synergistic reductions in related pollutants.
Existing mandatory regulations could lead firms to adopt pollution prevention technolo-gies that might be directly targeted at reducing (unregulated) toxic releases but could indi-rectly lower the costs of regulatory compliance through at least two different channels. First, efforts to prevent toxic releases could reduce the compliance costs for regulated pollutants (if regulated pollutants and toxic releases are complementary by-products of the production process). Surveys find that firms are proactively adopting P2 and seeking to eliminate harmful emissions to avoid complex, inflexible and costly regulatory processes and legal liabilities (Rondinelli and Berry 2000;Florida and Davison 2001).
Second, frequent inspections and penalties associated with enforcement of mandatory regulations are not only costly for firms but they can also have a negative impact on a firm’s reputation; creating incentives for firms to take action to reduce the frequency of enforce-ments. Several authors have also suggested that regulators are responsive to good faith efforts put forth by firms to reduce releases of pollutants not currently regulated or to limit releases of pollutants beyond what is required by statute or permit (Hemphil 1993/1994;Cothran 1993). Empirical studies show that firms that had lower toxic releases were less likely to be subject to inspections and enforcement actions. Such firms were also subject to fewer delays in obtaining environmental permits (Decker 2003).Maxwell and Decker(2006) develop an analytical model to show that in the presence of “responsive” regulators a firm can have incentives to undertake voluntary environmental investments to reduce the frequency with which it is monitored for compliance with regulations.Innes and Sam(2008) find empirical evidence that participation in USEPA’s voluntary 33/50 program led to a significant decline in the frequency with which firms were inspected. We therefore hypothesize that firms that face greater enforcement pressure in the form of more frequent inspections and a larger num-ber of penalties to adopt moreNew P2not only to reduce pollution at source but also to earn goodwill with regulators and possibly reduce the frequency of future inspections and severity of penalties.
Furthermore, future regulations, particularly if targeted at toxic releases, can also impact adoption of pollution prevention technologies. Anticipation of stringent environmental reg-ulations for reducing currently unregulated pollutants could induce technological innovation by firms to reduce pollution at source (Porter and van der Linde 1995).10By taking actions to
10Several theoretical studies show that the threat of mandatory regulations can induce voluntary
control pollution ahead of time through product and process modifications, firms may be able to lower costs of compliance as compared to the costs of retrofitting abatement technologies in the future (Christmann 2000). The anticipation of future stringent environmental regula-tions may also induce firms to be innovative to gain a competitive advantage by establishing industry standards and creating potential barriers to entry for other competitors (Dean and Brown 1995;Barrett 1992;Chynoweth and Kirschner 1993).
As proxies for the costs of existing regulations, we include the variable,Inspections, defined as the number of times a firm was inspected by state and federal environmental agen-cies to monitor compliance with mandatory regulations.11We also includeCivil Penalties received for noncompliance with environmental statutes, such as the Clean Air Act, the Clean Water Act, Toxic Substances Control Act and the Resource Conservation and Recovery Act. Additionally, as a measure of the stringency of the existing regulatory climate of the county, we construct a measure based on the non-attainment status of all counties in the US. As per the 1977 Clean Air Act Amendments, every county in the US is designated annu-ally as being in attainment or out of attainment (non-attainment) with national air quality standards in regards to six criteria air pollutants: carbon monoxide, sulfur dioxide, total sus-pended particulates, ozone, nitrogen oxide and particulate matter. The areas that have been designated as non-attainment regions are then subjected to more stringent controls, with the degree of stringency varying with the severity of pollution (basic, marginal, moderate, seri-ous, two categories of severe and extreme) (Tietenberg 2006). Furthermore, within any of the six criteria air pollutant categories, the county status may range from attainment of the primary standard to non-attainment. Because a county can be out of attainment in several air pollutant categories, and many heavy polluters emit numerous pollutants, we construct a dummy variable for each of the six pollutants for each facility based on its location: for each pollutant a value of 1 is given to facilities located in a non-attainment county for that pollutant and 0 otherwise. Each of the six dummy variables is summed up for all the facilities of each parent company and the resulting counts are then summed up over the six pollutants to derive theNon-attainmentvariable (as inList 2001). Higher values indicate that a larger number of facilities of a parent company are located in counties with non-attainment status for a larger number of pollutants.
A few states have also initiated mandatory P2 programs since 1988 to encourage source reduction of toxic emissions. These programs impose mandatory reporting requirements for P2 activities adopted, similar to the federal TRI, and provide technical assistance to firms in the state. Eight states have numerical goals for P2 adoption, while one state provides finan-cial assistance to firms.12We hypothesize that facilities located in states with mandatory P2 programs are more likely to adoptNew P2activities. We include a dummy equal to one
Footnote 10 continued
regulatory pressures (Henriques and Sadorsky 1996;Dasgupta et al. 2000), threat of liabilities and high costs of compliance with anticipated regulations for hazardous air pollutants (Anton et al. 2004;Khanna and Anton 2002) did motivate adoption of environmental management practices, but their direct effect on environmental technology adoption has not been examined.
11Information about the pollution prevention practices adopted by firms is available to regulators only with
a lag of 1 or 2 years. Hence we do not expect current inspections and penalties to be influenced by current pollution prevention decisions.
12Mandatory P2 programs started in 1988 with Washington, followed by Massachusetts and Oregon in 1989.
if a facility is located in a state with a mandatory P2 program and zero otherwise. These dummies are then summed over the facilities of a firm to obtain theMandatory P2 Policy variable, which provides a measure of the extent to which a firm is facing regulatory pressure to report/adopt P2 activities.
As a proxy for anticipated costs of compliance, we include the volume ofHazardous Air Pollutants(HAP) consisting of 189 toxic chemicals listed in Title III of the 1990 Clean Air Act Amendments. These were expected to be regulated under New Emissions Standards for HAP from 2000 onwards. We expect that firms with a largerHAPface a greater threat of anticipated regulations and are more likely to adopt pollution prevention technologies to obtain strategic advantage over competitors by reducing HAP emissions ahead of time.
2.3 Other Firm-Specific Characteristics
We also control for other factors that could also influence the adoption rates of pollution prevention practices. In addition to regulatory pressures, market pressures from consumers and environmental organizations could also lead firms to undertake pollution prevention.13 Several studies have shown that consumer willingness to pay premiums for environmentally friendly products and the desire to relax price competition can lead some firms to produce higher quality environmental products to differentiate themselves from other firms (Arora and Gangopadhyay 1995;Cremer and Thisse 1999;Amacher et al. 2004;Deltas et al. 2008). For example, Starbucks consumers pressured the coffee chain to purchase only from suppli-ers who grow coffee beans in a bird-friendly-fashion (Greenbiz News 2004). We extend the demand-side pressures to include the demand for innovation by other stakeholders, such as environmental and citizen groups and activists. These groups can express their preferences through boycotts and adverse publicity which can affect the reputation of a firm (Baron and Diermeir 2007).
We proxy consumer pressure by a dummy variable,Final Good, which is equal to one for firms that produce final goods and zero for those that produce intermediate goods.14We measure pressure by environmental groups through an explanatory variable,Environmental Activism, which is defined as the ratio of per capita membership in environmental organi-zations in a state relative to that in the entire US. We obtain a measure of environmental activism for each parent company by averaging the values for all its facilities located in different states.15Higher values of this variable indicate that a firm has its facilities in states with relatively high per capita membership in environmental organizations.
Additionally, we recognize that the costs of adopting pollution prevention practices and the effectiveness of pollution prevention as a strategy for reducing emissions may vary with the scale of toxic releases. If larger toxic polluters face larger (smaller) costs of abatement
13Consumer preferences for green products may manifest themselves through movements in demand and
rel-ative prices in the product markets. This parallels the argument put forth bySchmookler(1962) andGriliches
(1957) that demand-pull can explain innovative activity by firms as they strive to deliver the preferred goods in the market (Dosi 1982).
14Empirical evidence does suggest that firms that produce final goods and that were larger toxic polluters in
the past were more likely to participate in voluntary environmental programs and adopt EMSs (see survey in
Khanna 2001;Anton et al. 2004).
15Studies also show that community characteristics can influence the level of public pressures for reducing
pollution (Arora and Cason 1999;Hamilton 1999). Pressure from environmental groups, proxied by member-ship in environmental organizations, was found to influence participation in voluntary programs (Welch et al.
1999;Karamanos 2000) and reduction in intensity of use of certain toxic chemicals (Maxwell et al. 2000).
using pollution prevention methods, then one would observe a negative (positive) association between the emissions reported to the TRI and pollution prevention activities. Since current emissions are endogenous, as they are affected by the level of pollution prevention activ-ities, we use laggedToxic Releases(choosing a 5 year lag) to ensure that endogeneity is not an issue even in the presence of serial correlation. While it is also possible that firms emitting releases with a higher toxicity index may be more concerned about regulatory or public scrutiny and potential liabilities and thus, may have greater incentives to adopt P2 techniques, the inclusion of laggedToxicity-Weighted Releasesas an explanatory variable in the models do not alter any of our results. Further laggedToxicity-Weighted Releasesis never a significant variable in any of our models; hence we chose to exclude it from our models.
We control for the number of pollution reduction opportunities a firm has by including theNumber of Chemicalsemitted as an explanatory variable. This variable is the count of chemicals reported by the firm which is obtained by summing up the chemicals reported by each facility over all facilites of that firm. By including this as an explanatory variable we allow for the possibility that firms that report a largerNumber of Chemicalsmay adopt more pollution prevention practices, without imposing a proportional relationship between theNumber of ChemicalsandNew P2.
We also include theNewness of Assetsof a firm, itsMarket Share of Salesand itsSalesas explanatory variables.Newness of Assets, measured by the ratio of total assets to gross assets (as inKhanna and Damon 1999;Cohen et al. 1995), indicates how depreciated a company’s assets are and is thus a proxy for the cost of replacement of equipment. Total assets are current assets plus net property, plant and equipment plus other non-current asserts. Gross assets are total assets plus accumulated depreciation on property plant and equipment. Higher values of this variable indicate newer assets. The newer the equipment, the more costly it would be to replace it, which may be a barrier to innovative activities to prevent pollution. Newer equipment may also be more efficient and less polluting; reducing the need for making the modifications needed to prevent pollution. We expect that firms with older assets may, thus, be more likely to adopt moreNew P2.16
We include theMarket Shareof a firm in terms of industry sales as an explanatory variable to control for any effects of industry leadership on the incentives for innovation. There is a considerably large theoretical and empirical literature analyzing these effects and yielding ambiguous predictions (see survey byCohen and Levin 1989). Some have supported the Schumpeterian argument that monopolists or market leaders can more easily appropriate the returns from innovative activity. Others argue that insulation from competitive pressures breeds bureaucratic inertia and discourages innovation.17Market share can also be a proxy for a firm’s innovativeness and technical capabilities as innovative and technically capable firms tend to dominate their markets. Finally, we include theSalesof a firm as a measure of firm size. Larger firms may have more resources to adopt pollution prevention practices. They are also likely to be more visible and thus targets of social pressure by stakeholders
16Studies find that firms with older assets were more likely to participate in voluntary environmental programs
(Khanna and Damon 1999) and adopt a more comprehensive environmental management system (Khanna and
Anton 2002).
17In the context of quality provision,Spence(1975) shows that this depends on the relationship between the
because they may be held to higher standards. Such firms may also be more vulnerable to adverse effects of a tarnished reputation.18
3 Empirical Model
Our empirical model consists of aNew P2adoption Eq.1which relates the number ofNew P2 techniquesYi t, adopted by theith firm at timetto a vector of observed exogenous variables and other firm-specific characteristics,Xi t, theTQEMadoption decision,Ti t, and unobserved factors,ε1i t.
Yi t =αXi t+βTi t+ε1i t (1)
Since the New P2 variable ranges from 0 to 284 in our sample (Table1), it is reasonable to treat it as a continuous variable, and we thus use standard least squares treatment effects methods (Wooldridge 2002) to estimate the models. Contemporaneous values of explanatory variablesXi tare used to explainNew P2in Eq.1, except for five-year lagged values of toxic releases andHAP, because emissions might be jointly determined with theNew P2adoption decisions; unobserved factors influencingNew P2adoption are likely to influence current emissions. However, our results are robust to using current emissions as a regressor with past emissions as an instrument. Since the distributions ofHAPandToxic Releasesare highly skewed to the right and to allow for diminishing marginal effects these variables onNew P2, we include the square roots of these variables as explanatory variables. We also esti-mated models using (untransformed) levels of these variables and found that the signs and statistical significance of these and other explanatory variables were unaffected. We handle unobserved firm heterogeneity using two distinct models that make different assumptions about the error specification. First, we estimate a pooled model and allow serial correlation among error terms with a formε1i t = ρ1ε1i t−1 +ui t where E(ui t) = 0,E(u2i t) = σu2 andCov(ui t,ui s)= 0 ift =susing thePrais and Winsten(1954) algorithm. This model assumes that unobserved heterogeneity evolves slowly over time and thus has imperfect per-sistence.19Second, we estimate the models using a random effects specification to account for the possibility that unobserved heterogeneity is time invariant, and thus can be captured by unobservable time invariant firm-specific effects.
The coefficient ofTQEMrepresents the average treatment effect ofTQEMadoption on New P2adoption levels. We recognize that theTQEMadoption decision,Ti t, may be endog-enous because the unobserved variables that influenceTQEMmay be correlated with the unobserved variables that influenceNew P2equation. For example, one such unobserved variable could be the ‘green’ preferences of the current management which would affect both the decision to undertakeTQEMand undertake moreNew P2even after conditioning for observed variables. The bias onβin (1) could be positive ifTQEMis more likely to be adopted by such firms. However, the bias could be negative if firms with an inherently low scope for pollution prevention activities do not find the adoption cost ofTQEMworthwhile. A test for the endogeneity ofTQEM(Wooldridge 2002) rejects the null hypothesis that it is an exogenous variable at the 1% significance level. To deal with this endogeneity problem, we instrument forTQEMusing the 5 year lagged values of the following variables: square
18Larger firms have been found to be more likely to participate in the chemical industry’s Responsible Care
Program (King and Lenox 2000), Green Lights, Waste Wise, and 33/50 programs (Videras and Alberini 2000) and in Climate Challenge (Karamanos 2000).
root of toxic releases, square root of R&D intensity, square root of sales, and number of facilities. We find these four variables to be statistically predictors of TQEM adoption (see
Harrington et al. 2008). Lagged toxic releases reported to theTRIis a measure of the scale of the environmental problem, while lagged sales are a measure of the economies of scale and firm size which could then influence the firm’s ability to bear the fixed costs of adoption. R&D intensity is a proxy for the technical capacity of firms, while number of facilities of a firm could influence the firm’s costs of coordinating a common management system within the corporation and the gains from implementing a uniform approach towards environmental management.
4 Data Description
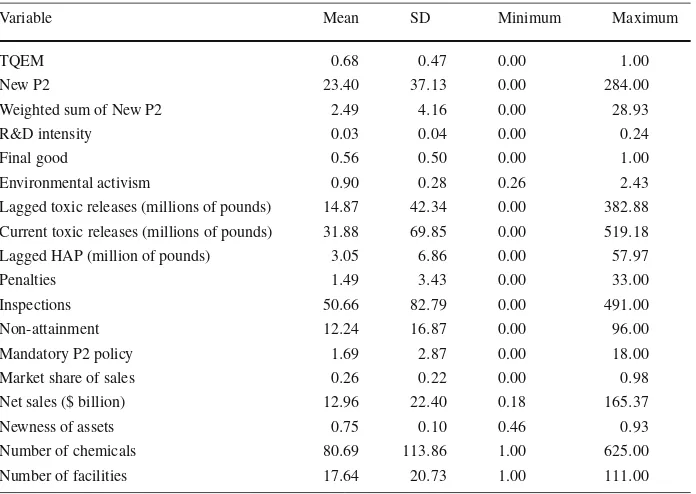
The sample consists of S&P 500 firms which responded to the Investor Research Responsibil-ity Center (IRRC) survey on corporate environmental management practices adopted by them and whose facilities reported to the TRI at least once over the period 1994–1996 or 1989– 1991 (since we are using five-year lagged values of toxic releases as explanatory variables). The IRRC data provide information about the adoption of TQEM by parent companies over the period 1994–1996. Focusing on the early to mid 1990s allows us to examine adoption of TQEM after the concept was introduced but before it became almost universally adopted. The TRI contains facility-level information on releases of chemical-specific toxic pollutants and on the pollution prevention activities adopted by firms since 1991. It also provides data onHAP. To match the TRI dataset with the IRRC, we construct unique parent company identifiers for each facility in the TRI database, and then aggregate all chemical and facility level data to obtain parent company level data.20We dropped the chemicals which had been added or deleted over the period 1989–1996 due to changes in the reporting requirements by the USEPA. This ensures that the change in toxic releases in our sample over time is not due to differences in the chemicals that were required to be reported. Of the S&P 500 firms, only 254 firms reported to the TRI at least once during the period 1989–1996. Of these firms, an unbalanced panel of 184 firms responded to the survey by the IRRC in at least one of the three years. Restricting our sample to the firms for which complete data for estimating Eqs.1–2 were available resulted in 463 observations belonging to 174 firms for estimating Eq.1and 422 observations belonging to 167 firms for estimating Eq. 2. Summary statistics for the variables used here are presented in Table1.
The TRI instructs firms to report the new P2 activities adopted by them in that year. How-ever, it is possible that some firms might be reporting all (cumulative) P2 activities adopted by them instead of only the incremental ones. To check if this was the case we examined the annually reported P2 counts by each facility belonging to S&P 500 firms and reporting to TRI for each chemical for the period 1992–1996 and compared it with their reports for the previous period (1991–1995). We then derived the change in the reportedNew P2count for a total of 74,780 instances at the chemical-facility level. If firms were inadvertently reporting all P2 activities adopted instead ofNew P2activities, we would expect that the annual count
20To match the facilities with their parent companies, a combination of the Dun and Bradstreet number,
Table 1 Descriptive statistics (1994–1996)
Variable Mean SD Minimum Maximum
TQEM 0.68 0.47 0.00 1.00
New P2 23.40 37.13 0.00 284.00
Weighted sum of New P2 2.49 4.16 0.00 28.93
R&D intensity 0.03 0.04 0.00 0.24
Final good 0.56 0.50 0.00 1.00
Environmental activism 0.90 0.28 0.26 2.43
Lagged toxic releases (millions of pounds) 14.87 42.34 0.00 382.88 Current toxic releases (millions of pounds) 31.88 69.85 0.00 519.18
Lagged HAP (million of pounds) 3.05 6.86 0.00 57.97
Penalties 1.49 3.43 0.00 33.00
Inspections 50.66 82.79 0.00 491.00
Non-attainment 12.24 16.87 0.00 96.00
Mandatory P2 policy 1.69 2.87 0.00 18.00
Market share of sales 0.26 0.22 0.00 0.98
Net sales ($ billion) 12.96 22.40 0.18 165.37
Newness of assets 0.75 0.10 0.46 0.93
Number of chemicals 80.69 113.86 1.00 625.00
Number of facilities 17.64 20.73 1.00 111.00
Summary statistics are presented forN=422
of P2 reported would be increasing or stay constant over time for all years. Our investigation focused at the facility level on the premise that any misinterpretation of the instructions in the TRI would be at the facility rather than chemical level. In particular, we have calculated the number of facilities for which the reported P2 counts were non-decreasing for all chemicals. We found that this was the case for only 236 facilities (5.68% of all S&P facilities reporting to TRI) and represents only 0.67% of the chemical-facility pairs (because these facilities have a much lower than average number of chemicals).21Therefore, even if there was any
misinterpretation of the survey question, it impacted at most a small fraction of the data. An equally likely possibility is that the P2 count was indeed non-decreasing for all the chemi-cals and time periods for these facilities. We thus feel confident thatNew P2does measure incremental adoption of pollution prevention activities by a firm that year.
The number of environmentalCivil Penaltiesand the number ofInspectionsare derived from USEPA’s Integrated Data for Enforcement Analysis (IDEA) database. Since these data are reported at the sub-facility level, inspections and penalties of all sub-facilities of each parent company are added up to get parent company level data.
The S&P 500 Compustat database, now known as Research Insight, is the source of parent-company level financial data on net sales, total assets, gross assets and R&D expendi-tures.Market sharedata are obtained from Ward’s Business Directory using parent company names. TheFinal Gooddummy is constructed based on the firm’s four-digit SIC code (as
21In terms of total sample, this translates to 502 out of 74,780 chemical-facility pairs. Additionally, these
described inHarrington et al. 2008). The primary SIC code of a parent company is that reported in the Research Insight database. If that was missing, then we use the SIC code in Ward’s Business Directory to construct theFinal Gooddummy.
TheNon-attainmentstatus of counties is obtained from the USEPA Greenbook.22These data are matched with the TRI using the location information of each facility. The data on Environmental Activismare obtained at the state level for 1993 fromWikle(1995).23Data on state P2 policies are obtained from the National Pollution Prevention Roundtable.24
5 Results
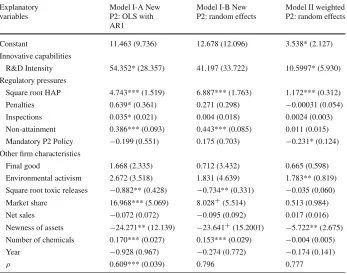
We estimate several different models to examine the determinants ofNew P2adoption. We first examine the results of models that include only the exogenous explanatory variables and firm-specific characteristics and excludeTQEM. Models I-A and I-B (Table2) explain adoption ofNew P2, assuming AR1 error structure and random effects, respectively. Model II usesWeighted P2as dependent variable. The coefficients of all variables will also include any indirect effects the associated factors will have through their influence onTQEMadoption. We report the estimates of the autocorrelation parameter for the AR1 model, as well as the point estimate of the variance of the random effect component as a fraction of overall variance for the random effects models. The AR1 models strongly support the validity of assuming an AR1 error process against the alternative of ani.i.d.error distribution. The high share of the overall variance attributed to the random effects component underlines the importance of controlling for unobserved heterogeneity. We then estimate and report the results of the full structural system which includes theTQEMvariable, appropriately instrumented, in Table3. Results from the linear regressions forNew P2(Models I-A and I-B) consistently support our hypotheses that current and anticipated regulatory pressures, as proxied byPenalties, Inspections, HAP and Non-Attainmenthave a statistically significant positive impact onNew P2adoption, with the exception ofInspectionsandPenaltieswhich have a statistically insig-nificant coefficient in Model I-B. Among these proxies for regulatory pressures, onlyHAP has a statistically significant impact on theWeighted P2measure of adoption of pollution prevention techniques (Model II). Recall thatWeighted P2differs fromNew P2in that it attaches a higher weight to P2 adoption by facilities with a higher share of toxic emissions within the firm. Therefore, it is possible that existing regulatory pressures primarily impact the P2 activities of those facilities that have a smaller share of the firm’s toxic releases. AnticipatedHAPregulations, however, do motivate a higher level ofWeighted P2adoption in addition to a higher level ofNew P2adoption. This indicates that regulations targeted at toxic releases were more effective in motivating P2 adoption by the pollution intensive facil-ities within firms as compared to command and control regulations aimed at other pollutants. Interestingly, we find that a Mandatory P2 policy has a statistically insignificant impact on New P2adoption in models I-A and I-B and only a weakly significant but negative impact in Model II.
We find some support for our hypothesized impact of internal firm capabilities on pollu-tion prevenpollu-tion adoppollu-tion; Model I-A and Model II show thatR&D Intensityhas a positive
22Can be found athttp://www.epa.gov/oar/oaqps/greenbk/anay.html.
23It is based on data on membership in 10 environmental organizations, namely African Wildlife
Founda-tion, American Birding AssociaFounda-tion, The Nature Conservancy, World Wildlife Fund, Zero Population Growth, American Rivers, Bat Conservation International, Natural Resources Defense Council, Rainforest Action Network, and Sea Shepherd Conservation Society.
Table 2 Determinants of the adoption of pollution prevention techniques Explanatory
variables
Model I-A New P2: OLS with AR1
Model I-B New P2: random effects
Model II weighted P2: random effects
Constant 11.463 (9.736) 12.678 (12.096) 3.538* (2.127)
Innovative capabilities
R&D Intensity 54.352* (28.357) 41.197 (33.722) 10.5997* (5.930) Regulatory pressures
Square root HAP 4.743*** (1.519) 6.887*** (1.763) 1.172*** (0.312)
Penalties 0.639* (0.361) 0.271 (0.298) −0.00031 (0.054)
Inspections 0.035* (0.021) 0.004 (0.018) 0.0024 (0.003)
Non-attainment 0.386*** (0.093) 0.443*** (0.085) 0.011 (0.015) Mandatory P2 Policy −0.199 (0.551) 0.175 (0.703) −0.231* (0.124) Other firm characteristics
Final good 1.668 (2.335) 0.712 (3.432) 0.665 (0.598)
Environmental activism 2.672 (3.518) 1.831 (4.639) 1.783** (0.819) Square root toxic releases −0.882** (0.428) −0.734** (0.331) −0.035 (0.060) Market share 16.968*** (5.069) 8.028+(5.514) 0.513 (0.984)
Net sales −0.072 (0.072) −0.095 (0.092) 0.017 (0.016)
Newness of assets −24.271** (12.139) −23.641+(15.2001) −5.722** (2.675) Number of chemicals 0.170*** (0.027) 0.153*** (0.029) −0.004 (0.005)
Year −0.928 (0.967) −0.274 (0.772) −0.174 (0.141)
ρ 0.609*** (0.039) 0.796 0.777
N=422. Values in parentheses are standard errors
* Significant at 10%; ** Significant at 5%; *** Significant at 1%;+Significant at 15% level
Theρfor the AR1 model refers to the autocorrelation parameter, while for the random effects model, it refers to variance of the random effects component as a fraction of overall variance
and statistically significant impact onNew P2. We also find that other firm characteristics matter. Lagged Toxic Releases and Newness of Assets both have a negative significant impact onNew P2, whileMarket shareandNumber of chemicalshave significant positive effects.
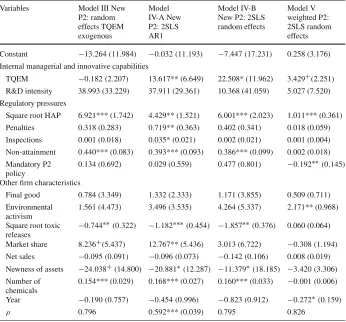
In Table3, we present the results of models that include the impact ofTQEMadoption on P2 activity. Model III estimates a random effects model that disregards the endogeneity of theTQEMadoption decision. The model that ignores the panel structure but assumes an AR1 structure of the error terms yields similar results as Model III and is not shown. Model IV-A and IV-B examine the impact ofTQEMonNew P2using the significant determinants ofTQEMadoption identified in Table2as instruments forTQEM. Model IV-A assumes an AR1 error structure, while Model IV-B is a random effects model. Model V is similar to Model IV-B, but usesWeighted P2as dependent variable.
Table 3 Impact of TQEM on pollution prevention adoption Constant −13.264(11.984) −0.032(11.193) −7.447(17.231) 0.258 (3.176) Internal managerial and innovative capabilities
TQEM −0.182(2.207) 13.617** (6.649) 22.508* (11.962) 3.429+(2.251) R&D intensity 38.993 (33.229) 37.911 (29.361) 10.368 (41.059) 5.027 (7.520) Regulatory pressures
Square root HAP 6.921*** (1.742) 4.429** (1.521) 6.001*** (2.023) 1.011*** (0.361) Penalties 0.318 (0.283) 0.719** (0.363) 0.402 (0.341) 0.018 (0.059) Inspections 0.001 (0.018) 0.035* (0.021) 0.002 (0.021) 0.001 (0.004) Non-attainment 0.440*** (0.083) 0.393*** (0.093) 0.386*** (0.099) 0.002 (0.018) Mandatory P2
policy
0.134 (0.692) 0.029 (0.559) 0.477 (0.801) −0.192∗∗(0.145) Other firm characteristics
Final good 0.784 (3.349) 1.332 (2.333) 1.171 (3.855) 0.509 (0.711) Environmental
activism
1.561 (4.473) 3.496 (3.535) 4.264 (5.337) 2.171** (0.968) Square root toxic
releases
−0.744∗∗(0.322) −1.182∗∗∗(0.454) −1.857∗∗(0.376) 0.060 (0.064) Market share 8.236+(5.437) 12.767** (5.436) 3.013 (6.722) −0.308(1.194)
Net sales −0.095(0.091) −0.096(0.073) −0.142(0.106) 0.008 (0.019) Newness of assets −24.038+(14.800) −20.881∗(12.287) −11.379∗(18.185) −3.420(3.306)
Number of chemicals
0.154*** (0.029) 0.168*** (0.027) 0.160*** (0.033) −0.001(0.006) Year −0.190(0.757) −0.454(0.996) −0.823(0.912) −0.272∗(0.159)
ρ 0.796 0.592*** (0.039) 0.795 0.826
N=422. Values in parentheses are standard errors
* Significant at 10%; ** Significant at 5%; *** Significant at 1%;+Significant at 15%
Theρfor the AR1 model refers to the autocorrelation parameter, while for the random effects model, it refers to variance of the random effects component as a fraction of overall variance
and after accounting for that, its direct effect is smaller. On the other hand, the effects of variables proxying for regulatory pressure, particularlyHAPandNon-attainment, appear to be primarily direct effects onNew P2. This is consistent with the results obtained by
Harrington et al.(2008) which show thatR&Dintensity has a significant influence onTQEM adoption while regulatory pressures do not. We do not find any robust evidence about the significance ofPenaltiesandInspectionsas they are only significant in the AR1 models. However, their coefficients are always positive. We also find thatTQEMhas a statistically significant (at 15% only) and positive effect onWeighted P2(Model V), while the effects of other variables remain as discussed above. These results suggest thatTQEMleads even the more pollution intensive facilities within firms to adopt more pollution prevention activities. Further,Weighted P2is lower among firms in states with aMandatory P2program, which is also the case in Table2, Model II.
Among the other firm characteristics,Toxic Releases,Newness of Assets, andNumber of Chemicals, have a statistically significant effect onP2adoption. The effect ofNumber of Chemicalswas as expected; the more opportunities a firm has to adopt pollution prevention technologies the more such technologies it will adopt. The negative sign ofNewness of Assets is also as expected. Firms with newer assets may find it more costly to adopt pollution pre-vention technologies, or may already have highly efficient and less polluting technologies which reduce their need to adopt more prevent pollution. We find a fairly robust negative and statistically significant sign forToxic Releasessuggesting that firms that were relatively small toxic polluters had lower costs of abatement of toxic releases using pollution prevention technologies. The effects of other firm characteristics, such asMarket shareis not robustly significant across all the models.25 The effects of other external pressures from environ-mental groups, communities or consumers on adoption of pollution prevention techniques, as proxied byEnvironmental ActivismandFinal Good, are also not statistically significant except for Model V whereEnvironmental Activismis positive significant. The effects of firm characteristics and the magnitudes of their coefficients are very similar in models that include TQEMand those that excludeTQEMas a variable.
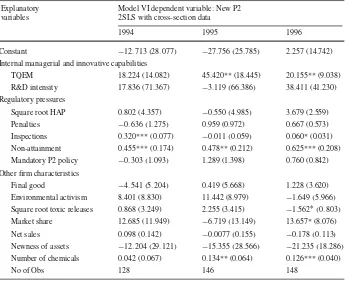
To further test the robustness of our results and the appropriateness of the instrumental variable approach, we explainP2adoption separately for 1994, 1995 and 1996 in Table4. Model VI (like Models III–V) uses lagged values of the square root of toxic releases, square root of R&D intensity, square root of sales and number of facilities as instruments.
We find thatTQEMis a positive determinant ofNew P2in in each of the years, although the effect is statistically significant only in 1995 and 1996. This is despite the fact that the number of observations in each year, and particularly in 1994, is much smaller than for the entire sample. Our results for the other explanatory variables are also robust, in that none of these variables changes signs in a statistically significant way.
6 Conclusions
The objective of this paper is to study the factors that influence the voluntary adoption of technologies that reduce toxic pollution at source in a sample of S&P 500 firms. Particular attention is devoted to examining the impact of a firm’s management system and of external regulatory pressures on the adoption of pollution prevention technologies. In addition, we investigate the role played by internal capabilities in influencing incremental adoption of
25We find low correlation between Toxic Releases and other firm characteristics, suggesting that the lack of
Table 4 Impact of TQEM on pollution prevention adoption in 1994, 1995 and 1996 Explanatory
variables
Model VI dependent variable: New P2 2SLS with cross-section data
1994 1995 1996
Constant −12.713(28.077) −27.756(25.785) 2.257 (14.742)
Internal managerial and innovative capabilities
TQEM 18.224 (14.082) 45.420** (18.445) 20.155** (9.038)
R&D intensity 17.836 (71.367) −3.119(66.386) 38.411 (41.230) Regulatory pressures
Square root HAP 0.802 (4.357) −0.550(4.985) 3.679 (2.559)
Penalties −0.636(1.275) 0.959 (0.972) 0.667 (0.573)
Inspections 0.320*** (0.077) −0.011(0.059) 0.060* (0.031) Non-attainment 0.455*** (0.174) 0.478** (0.212) 0.625*** (0.208) Mandatory P2 policy −0.303(1.093) 1.289 (1.398) 0.760 (0.842) Other firm characteristics
Final good −4.541(5.204) 0.419 (5.668) 1.228 (3.620)
Environmental activism 8.401 (8.830) 11.442 (8.979) −1.649(5.966) Square root toxic releases 0.868 (3.249) 2.255 (3.415) −1.562∗(0.803)
Market share 12.685 (11.949) −6.719(13.149) 13.657* (8.076)
Net sales 0.098 (0.142) −0.0077(0.155) −0.178(0.113)
Newness of assets −12.204(29.121) −15.355(28.566) −21.235(18.286) Number of chemicals 0.042 (0.067) 0.134** (0.064) 0.126*** (0.040)
No of Obs 128 146 148
Values in parentheses are standard errors
* Significant at 10%; ** Significant at 5%; *** Significant at 1%
these technologies. More generally, our study makes a contribution to the broader literature that studies the determinants of environmental innovation by firms.
Our main econometric findings are as follows. First, regulatory pressure from current and anticipated regulations plays an important role in motivating voluntary environmental inno-vation. In contrast, other firm-specific characteristics are found to have an insignificant effect on firm behavior, except for the consistently significant and negative significant impact of Newness of Assets. Pressure from existing regulations, particularly those associated withHAP and criteria air pollutants inNon attainmentareas, is found to be strongly associated with adoption of more P2 practices by a firm but only some of these regulatory pressures have an impact on the adoption of P2 practices by the most polluting facilities of these firms. Second, adoption ofTQEMdoes indeed motivate the adoption of more pollution prevention technol-ogies. Thus, managerial innovations, such as adoption ofTQEM, lead firms to be innovative in their approaches towards environmental management. Third, technological capability is an important determinant of a firm’s adoption of pollution prevention technologies. Fourth, firms with a relatively higher volume of toxic releases face higher costs of abatement using pollution prevention technologies.
pollution prevention techniques are sufficient (or more effective than mandatory approaches requiring pollution prevention) for achieving the goals of the Pollution Prevention Act, it does show that efforts to encourage voluntary changes in a firm’s management system while maintaining a strong regulatory framework and a credible threat of mandatory regulations can be effective in moving firms towards those goals.
This analysis has several policy implications. It shows the extent to which policy makers can rely on environmental management systems to induce voluntary pollution prevention. It also shows the role that regulations can play in motivating innovative methods for pollu-tion control. By distinguishing between different types of regulatory pressures, this analysis shows that regulatory pressures targeted towards hazardous toxic releases and criteria air pol-lutants are more effective than others in inducing the pollution intensive firms and facilities within firms to adopt pollution prevention practices. The results obtained here also highlight the importance of providing technical assistance to firms that may not have the capacity to undertake innovative pollution prevention activities. Lastly, by identifying the types of firms less likely to be self-motivated to voluntarily adopt pollution prevention practices, this anal-ysis has implications for the design and targeting of policy initiatives that seek to encourage greater pollution prevention.
Acknowledgements We would like to thank participants in the Program for Environmental and Resource Economics Workshop at the University of Illinois, participants in the Department of Agricultural Economics and Rural Sociology seminar at Pennsylvania State University and participants in the AERE session at the American Agricultural Economics Meeting in Providence, Rhode Island for helpful comments and discus-sion. We thank Farzad Taheripour for assistance with the data compilation. We would also like to thank Jay Shimshack for helpful discussion. Financial support from the EPA STAR program grant no. R830870 is gratefully acknowledged.
References
Amacher GS, Koskela E, Ollikainen M (2004) Environmental quality competition and eco-labeling. J Environ Econ Manage 47(2):284–306
Anderson S, Daniel J, Johnson M (1999) Why firms seek ISO certification: regulatory compliance or compet-itive advantage?. Prod Manage 8(1):28–43
Anton W, Deltas G, Khanna M (2004) Environmental management systems: do they improve environmental performance?. J Environ Econ Manage 48(1):632–654
Arimura T, Akira Hibiki H, Johnstone N (2007) An empirical study of environmental R&D: what encourages facilities to be environmentally innovative? In: Johnstone N (ed) Environmental policy and corporate behaviour. Edward Elgar Publishing Limited, pp 142–173
Arimura T, Hibikid HA, Katayama H (2008) Is a voluntary approach an effective environmental policy instru-ment? A case for environmental management systems. J Environ Econ Manage 55:281–295
Arora S, Cason T (1999) Do community characteristics influence environmental outcomes? Evidence from the toxics release inventory. South Econ J 65(4):691–716
Arora S, Gangopadhyay S (1995) Towards a theoretical model of voluntary overcompliance. J Econ Behav Organ 28:289–309
Barla P (2007) ISO 14001 certification and environmental performance in Quebec’s pulp and paper industry. J Environ Econ Manage 53:291–306
Baron DP, Diermeir D (2007) Strategic activism and nonmarket strategy. J Econ Manage Strategy 16(3): 599–634
Barrett S (1992) Strategy and the environment. Colombia J World Bus 27:202–209
Blundell R, Griffith R, van Reenen J (1995) Dynamic count data models of technological innovation. Econ J 105:333–344
Breeden K, Fontaine M, Kuryk B (1994) Integrating product quality and environmental performance through innovation—the L’Oreal case. Total Qual Environ Manage Spring:309–317
Canon de Francia J, Garces-Ayerbe C, Ramirez-Aleson M (2007) Are more innovative firms less vulnerable to new environmental regulation?. Environ Resour Econ 36:295–311
Christmann P (2000) Effects of “best practices” of environmental management on cost advantage: the role of complementary assets. Acad Manage J 43(4):663–680
Chynoweth E, Kirschner E (1993) Environmental standards provide a competitive advantage. Chem Week 16:46–52
Cleff T, Rennings K (1999) Determinants of environmental product and process innovation. Eur Environ 9(5):191–201
Cohen WM, Levin RC (1989) Empirical studies of innovation and market structure, handbook of industrial organization. In: Schmalensee R, Willig R (eds) Handbook of industrial organization, 1st edn, vol 2, Chap 18. Elsevier, pp 1059–1107
Cohen W, Levinthal D (1989) Innovation and learning: the two faces of R&D. Econ J 99:569–596 Cohen W, Levinthal D (1994) Fortune favors the prepared firm. Manage Sci 40(2):227–251
Cohen W, Finn SA, Naimon JS (1995) Environmental and financial performance: are they related?. Investor Research and Responsibility Center, Washington, DC
Cothran MC (1993) Proactive environmental activity eases permitting process. J Environ Plan Summer: 293–300
Cremer H, Thisse JF (1999) On the taxation of polluting products in a differentiated industry. Eur Econ Rev 43(3):575–594
Crow M (2000) Beyond experiments. Environ Forum, May/June:19–29
Dahlstrom K, Howes C, Leinster O, Skea J (2003) Environmental management systems and company perfor-mance: assessing the case for extending risk-based regulation. Eur Environ 13:187–203
Dasgupta S, Hettige H, Wheeler D (2000) What improves environmental compliance? Evidence from Mexican industry. J Environ Econ Manage 39(1):39–66
Dean TJ, Brown R (1995) Pollution regulation as a barrier to new firm entry: initial evidence and implications for future research. Acad Manage J 38:288–303
DeCanio SJ, Dribble C, Amir-Atefi K (2000) The importance of organizational structure for the adoption of innovations. Manage Sci 46(10):1285–1299
Decker CS (2003) Corporate environmentalism and environmental statutory permitting. J Law Econ 46(1):103–129
Deltas G, Harrington DR, Khanna M (2008) Markets with (somewhat) environmentally conscious consumers, Working Paper. Department of Economics, University of Illinois, Urbana-Champaign
Dierickx IK, Cool K (1989) Asset stock accumulation and sustainability of competitive advantage: comment; reply. Manage Sci 35(12):1504–1514
Donnenfeld S, White L (1988) Product variety and the inefficiency of monopoly. Economica 55(219):393–401 Dosi G (1982) Technological paradigms and technological trajectories: a suggested interpretation of the
deter-minants and directions of technological change. Res Policy 11(3):147–162
Downing PB, White LJ (1986) Innovation in pollution control. J Environ Econ Manage 8:225–271 Florida R (1996) Lean and green: the move to environmentally conscious manufacturing. Calif Manage Rev
39(1):80–105
Florida R, Davison D (2001) Why do firms adopt advanced environmental practices (and do they make a difference). In: Coglianese C, Nash J (eds) Regulating from the inside: can environmental management systems achieve policy goals?. Resources for the Future, Washington, DC pp 82–104
Florida R, Jenkins PD (1996) Adoption of organizational innovations by Japanese transplants. Heinz School Working Paper, Carnegie Mellon University, Pittsburg, PA August
Frondel M, Horbach J, Rennings K (2007) End-of-pipe or cleaner production? An empirical comparison of environmental innovation decisions across OECD countries. In: Johnstone N (ed) Environmental policy and corporate behaviour. Edward Elgar Publishing Limited, pp 174–212
Gray W, Shadbegian R (1995) Pollution abatement costs, regulation, and plant-level productivity. NBER Working Papers: 4994
Gray W, Shadbegian R (1998) Environmental regulation, investment timing, and technology choice. J Indus Econ 46(2):235–256
Greenbiz News (2004)http://www.greenbiz.com/news/reviews_third.cfm?NewsID=26691
Griliches Z (1957) Hybrid corn: an exploration in the economics of technological change. Econometrica 25:501–522
Hamilton JT (1999) Exercising property rights to pollute: do cancer risks and politics affect plant emission reductions. J Risk Uncertain 18(2):105–124
Hemphil TA (1993/1994) Corporate environmentalism and self-regulation: keeping enforcement agencies at bay. J Environ Regul, Winter. 145–154
Henriques I, Sadorsky P (1996) The determinants of an environmentally responsive firms: an empirical approach. J Environ Econ Manage 30:381–395
Howard J, Nash J, Ehrenfeld J (2000) Standard or smokescreen? Implementation of voluntary environmental code. Calif Manage Rev 42(2):63–82
Innes R, Sam AG (2008) Voluntary pollution reductions and the enforcement of environmental law: an empir-ical study of the 33/50 program. J Law Econ 51(2):271–296
Jaffe AB, Palmer K (1997) Environmental regulation and innovation: a panel data study. Rev Econ Stat 79: 610–619
Karamanos P (2000) Voluntary environmental agreements for the reduction of greenhouse gas emissions: incentives and characteristics of electric utility participants in the climate challenge program. Working Paper, Sanford Institute of Public Policy, Duke University
Khanna M (2001) Nonmandatory approaches to environmental regulation: a survey. J Econ Surv 15(3): 291–324
Khanna M, Anton W (2002) Corporate environmental management: regulatory and market-based pressures. Land Econ 78:539–558
Khanna M, Brouhle K (forthcoming) Effectiveness of voluntary environmental initiatives. In: Delmas M, Young O (eds) Governing the environment: interdisciplinary perspectives, Chap 6. Cambridge University Press, Cambridge, UK
Khanna M, Damon L (1999) EPA’s voluntary 33/50 program: impact on toxic releases and economic perfor-mance of firms. J Environ Econ Manage 37(1):125
King AA, Lenox MJ (2000) Industry self-regulation without sanctions: the chemical industry’s responsible care program. Acad Manage J 43(4):698–716
King AA, Lenox MJ (2001) Who adopts management standards early? An examination of ISO 14001 certifi-cations? Acad Manage Proc :A1–A6
Lanjuow JO, Mody A (1996) Innovation and the international diffusion of environmentally-responsive tech-nology. Res Policy 25:549–571
List J (2001) US county-level determinants of inbound FDI: evidence from two-step count data model. Int J Indus Organ 19:953–973
Lutz S, Lyon TP, Maxwell JW (2000) Quality leadership when regulatory standards are forthcoming. J Indus Econ 48(3):331–348
Maxwell WJ, Decker C (2006) Voluntary environmental investment and responsive regulation. Environ Resour Econ 33:425–439
Maxwell WJ, Lyon T, Hackett S (2000) Self-regulation and social welfare: the political economy of corporate environmentalism. J Law Econ 43(2):583–617
McGee NC, Bhushan AK (1993) Applying the baldridge quality criteria to environmental performance: lessons from leading organizations. Total Qual Environ Manage Autumn 2(1):1–18
Milliman SR, Prince R (1989) Firm incentives to promote technological change in pollution control. J Environ Econ Manage 17:247–265
Nakamura M, Takahashi R, Vertinsky I (2001) Why Japanese firms choose to certify: a study of managerial responses to environmental issues. J Environ Econ Manage 42:23–52
Nash J, Nutt K, Maxwell J, Ehrenfeld J (1992) Polaroid’s environmental accounting and reporting system: benefits and limitations of a TQEM assessment tool. Total Qual Environ Manage Autumn:3–15 Pickman HA (1998) The effect of environmental regulation on environmental innovation. Bus Strategy
Envi-ron 7(4):223–233
Ploch DJ, Wlodarczyk J (2000) Naugatuck glass: an update on environmental sucesses with the system’s approch. Environ Qual Manage Autumn:75–78
Porter ME, van der Linde C (1995) Toward a new conception of the environment competitiveness relationship. J Econ Perspect 9(4):97–118
Potoski M, Prakash A (2005) Covenants with weak swords: ISO14001 and facilities’ environmental perfor-mance. J Policy Anal Manage 24:745–769
Prais SJ, Winsten C (1954) Trend estimators and serial correlation. Cowles Commission Discussion Paper, No 383. Chicago
President’s Commission on Environmental Quality (1993) Total quality management: a framework for pollu-tion prevenpollu-tion. Quality Environmental Management Subcommittee. Washington DC, January Rondinelli DA, Berry M (2000) Corporate environmental management and public policy: bridging the gap.
Am Behav Sci 44(2):168–191