INTERNATIONAL UNION FOR CONSERVATION OF NATURE
Integrated Watershed Conservation
and Management Plan:
Published by: IUCN Nepal Country Office
Reproduction of this publication for educational or other non-commercial purposes is permitted without prior written consent from the copyright holder provided the source is fully acknowledged.
Reproduction of this publication for resale or other non-commercial purposes is prohibited without prior written permission of the copyright holder.
ISBN: 978-9937-8222-8-2
Editing, Design & Layout: Amit Pradhan
Available from: IUCN Nepal, P.O. Box 3923, Kathmandu, Nepal
Tel: (977-1) 5528781, Fax: (977-1) 5536786
Steering Committee
Rajendra Khanal, IUCN Nepal
Banshi Moktan, CETD Nepal
Arjun Niraula, APEC Nepal
Deepak Paudel, Lead Consultant
Fulltime Technical Team
Deepak Paudel, Watershed Management and Climate Change, Hydrologist
Prakash Karn, Environmental Economist
Dambar Singh Pujara, GIS
Sanjeeb Dhungal, Social Data Management
Sachin Shrestha, Social Data Management
Thematic Team
Dil Kumar Limbu, Biologist
V.N. Jha, Livestock Management
Sharmila Ranabhat, Gender & Social Inclusion
Management Logistic Team
Indira Kandel, Meteorologist
Rajendra Rimal, Field Coodinator
Kedar Neupane, Logistic Management & Field Coordinator
Keshab Rijal, Logistic Management & Field Coordinator
Balandu Hamal, Logistic Management & Field Coordinator
Ananda Shrestha, Logistic Management & Field Coordinator
Acknowledgements ... i
Study Team ... ii
Table of Contents ... iii
List of Photos ... viii
List of Figures ... ix
List of Tables ... xi
List of Annexes ... xii
Acronyms and Abbreviations ... xiii
Chapter 1: Introduction ...1
1.1 Background ... 1
1.2 The need for the Study ... 2
1.3 Objectives of the Study ... 3
1.4 Scope of the Study ... 3
1.5 Methodoloy ... 4
1.5.1 Desk Work: Literatures Review, Watershed Delineation , Mappings, and Questionnaire Preparation ... 5
1.5.2 Field Work: Thematic Map Verification, Sampling, Household Survey, Multi-stakeholder Consultations, Key Informants Interviews ... 6
1.5.3 Office Work: Data Entry, Processes, Analysis and Report Preparation Stakeholder Consultation Meetings and Report Preparation ...9
1.6 Expected Outcome ... 9
1.7 Sardu Watershed Management Plan: Vision, Mission, Guiding Principles and Objectives ... 9
1.7.1 Vision ... 9
1.7.2 Mission ... 9
2.1 Introduction ... 11
2.2 Physiography ... 11
2.3 Geology ... 11
2.4 Climate, Drainage Network and Hydrology ... 13
2.4.1 Climate ... 1 3 2.4.2 Drainage Networks and Drainage Density: Sardu River System ... 1 4 2.5 Socio-economic Profile and Responses ... 17
2.5.1 Demography and Population Projection ...17
2.5.2 Economic Activities, Production, and Food Sufficiency ...19
2.5.3 Energy Consumption and Fuel wood Demand Projection ...23
2.5.4 Awareness and Responses ...23
2.6 Conclusions ... 27
Chapter 3: Physical Assessment: Land use, Land capability, Risks and Water Status ...29
3.1 Introduction ... 29
3.2 Land Use Change and Land Capability ... 29
3.2.1 Landform and Land systems of the Watershed ... 2 9 3.2.2 Slope Classes of the Watershed ...31
3.2.3 Existing Land use and Land cover (LULC) and Practices ...34
3.2.4 Land Use Changes ...35
3.2.5 Soil loss Prediction from the Watershed ...39
3.2.6 Land Capability Classification ...40
3.3 Climatic Trends and Risks to Disasters ... 42
3.3.1 The Context ... 4 2
3.3.2 Climatic Trends ... 4 3
3.3.3 Vulnerable System/Sectors ... 4 4
3.4 Water Status ... 50
3.4.1 Specific to Water Availability ... 5 0 3.4.2 Specific to Existing Water Supply System from the Watershed ... 5 2 3.4.3 Water Demand and Supply from Sardu Watershed ... 5 4 3.4.4 Specific to Water Quality ...54
3.5 Conclusions ... 56
Chapter 4: Bio-diversity Condition in the Watershed ...58
4.1 Introduction ... 58
4.2 Floral Diversity ... 58
4.3 Fauna Diversity ... 59
4.4 Conclusions ... 59
Chapter 5: Economic Valuation of the Services and Major Benefit-Costs ...60
5.1 Introduction ... 60
5.2 Economic Valuation: Lessons Learned ... 60
5.2.1 Valuing Goods & Services ... 6 1 5.2.2 Valuing Water as a Goods ...62
5.3 Economic Value of Water and Other Resources from Sardu ... 62
5.4 Major Benefits & Costs ... 63
5.5 Conclusions ... 64
Chapter 6: Services Management: Gender and Social Inclusions Aspect ...65
6.1 Introduction ... 65
6.2 Gender Role in the Watershed in Different Aspects ... 65
6.4 Land Ownership Situation ... 68
6.5 Ownership of Livestock ... 68
6.6 Involvement in Social Organization ... 69
6.7 Conclusions ... 69
Chapter 7: Problems Identification and Analysis of Issues in View of Conservation Aspect ...70
7.1 Introduction ... 70
7.2 The Problems ... 70
7.3 The Issues ... 70
7.3.1 Lands, Land Use and Planning ... 7 1 7.3.2 Water Source Conservation and Water Supply Management ... 7 3 7.3.3 Forestry and Bio-diversity ... 7 4 7.3.4 Agriculture ... 7 5 7.3.5 Disaster Risks Reduction ...76
7.4 Conclusions ... 77
Chapter 8: Proposed Programmes: Locations, Policy, Strategies and Activities ...78
8.1 Thoughts ... 78
8.2 Purpose of the Program ... 78
8.3 Proposed Land use ... 80
8.4 Proposed Programmes ... 81
8.4.1 Improved Environment forForest Conservation and Rich
Biodiversity and for Sediment and Solid Waste Management ... 8 1
8.4.2 Soil Conservation, Landslide Control and Flood
Management and Land Utilizations ... 8 3
8.4.3 Stream & Rainwater Harvesting ... 8 5
8.4.4 Capacity Development Programme (Livelihood Enhancement
Program - Poverty Reduction - A Multi-pronged Approach) ... 8 6
8.4.7 Promotion Bio-Industrial Watershed ... 8 9
8.4.8 Institutional Development, Monitoring and Research ... 9 1
8.5 Conclusions ... 92
Chapter 9: Collaborative Approach for Sustainability of the Sardu Watershed Management Through Innovative Scheme ...93
9.1 Introduction: Major Innovative Financial Mechanisms for Conservation ... 93
9.1.1 Public Payment Schemes (PPS) ... 9 3 9.1.2 Voluntary Contractual Arrangements (VCAs) Named as PES ... 9 3 9.2 Local Experience - Nepal’s Initiatives ... 94
9.3 PES in Sardu Watershed: Results and Discussions ... 95
9.3.1 General Criteria for PES ... 9 5 9.3.2 Feasibility of PES in Sardu Watershed: ... 96
9. 3.3 Discussions ...97
9.4 A Framework for PES like Scheme for Sardu Watershed Management ... 99
9.4.1 Conservation Fund (PES like Scheme) ... 99
9.4.2 Execution Mechanism for PES like Scheme ...100
9.5 Conclusions ... 101
Chapter 10: Conclusions and Recommendation ...102
Photo 1: Watershed Demarcation and Verification
Using GIS Maps & GPS, Transect Walk and the Local Consultations ... 6
Photo 2: Discussion on Sampling and Orientation to Enumerators on Questionnaire ... 7
Photo 3: Several Discussions with Expert and Communities ... 8
Photo 4: Coding Household Survey Questionnaire ... 8
Figure 2.1: Base Map of the Study Watershed ... 12
Figure 2.2: Mean Monthly Temperature Recorded at Dharan during 1998-2008 ... 13
Figure 2.3: Average Annual Rainfall at Selected Stations ... 13
Figure 2.4: Mean Monthly Rainfall Estimated for the Watershed ... 14
Figure 2.5: Rainfall atthe Watershed by Season ... 14
Figure 2.6: Drainage Map of Sardu with Stream Order ... 15
Figure 2.7: Peak Flood Discharge Estimated at Outlets of Sardu River for Different Return Periods ... 16
Figure 2.8: Population Distribution in the Watershed by Religions ... 17
Figure 2.9: Education Status in the Watershed ... 17
Figure 2.10 Population Projection within the Watershed by 2025 ... 18
Figure 2.11: Major Income Sources in the Watershed ... 19
Figure 2.12: Distributions of Toilets by Types and Regions in the Watershed ... 21
Figure 2.13: Settlements with Access to Road Networks ... 22
Figure 2.14: Fuel Wood Consumption within the Watershed Based on the Data Survey, 2009 ... 23
Figure 2.15: Fuel Wood Demand Projection in the Watershed ... 23
Figure 2.16: Existing Community’s Participation for Cropping Practices ... 24
Figure 2.17: District Wise Watershed Condition and Priority Map ... 26
Figure 3.1: Land System Classes for Sardu Watershed ... 30
Figure 3.2: DEM Map of the Watershed Based on Topographical Map of 1996 ... 32
Figure 3.3: Slope Map of the Watershed Based on Topographical Map of 1996 ... 33
Figure 3.4: Land Use and land Cover Changes in 1978 ... 36
Figure 3.5: Land Use and Land Cover Changes in 1996 ... 37
Figure 3.6: Land Use and Land Cover Changes in 2009 ... 38
Figure 3.9: Risk Maps of Upper Sardu Khola ... 47
Figure 3.10: Extreme Rainfall Trends in 24 Hours at Dharan Station (1798-2008) ... 48
Figure 3.11: Number of Days Vs Extreme Rainfall Amount at Dharan Station ... 48
Figure 3.12: Hydrograph for Sardu, Khardu and Both at Confluence ... 50
Figure 3.13:Water Supply from Sardu and Khardu by NWSC ... 52
Figure 3.14: Community’s Practices for the Solid Waste Management ... 55
Figure 3.15: Community's Perception Specific to Water Quality ... 56
Figure 8.1: Existing Land Use of the Watershed ... 79
Figure 8.2: Proposed Land Use of the Watershed ... 79
Figure 8.3: Proposed Programmes for Sustainable Sardu Watershed Management ... 80
Figure 8.4: Triangular Relationship of Promotion of Bio Industrial Watershed in the Watershed Region ... 90
Table 2.1: Stream Order and Length in Sardu River System ... 14
Table 2.2: Caste/Ethnic Distribution by Regions in the Watershed ... 17
Table 2.3: Existing Livestock in the Watershed by Regions ... 20
Table 2.4: Tabulated Figures on Community’s Willingness for the Conservation of the Watershed ... 25
Table 3.1: Ecological Wise Land System Classes of the Watershed ... 31
Table 3.2: Slope Classes of the Watershed with Coverage Areas in Ha and in % ... 31
Table 3.3: General Features of the Existing Land Use and Land Cover Types of the Watershed ... 34
Table 3.4: Slop Wise Land Use and Coverage ... 35
Table 3.5: Land Use and Land Cover Changes in the Watershed from 1978 to 2009 ... 35
Table 3.6: Aggregate Land Use Changes Over the Last 32 Years in the Watershed ... 39
Table 3.7: Land Capability Classes and its Appropriate Use ... 40
Table 3.8: Monthly Flow Estimation for Sardu and Khardu Catchments in Cumecs ... 51
Table 3.9: Major Tributaries of Sardu River Supply Water to Dharan People ... 53
Table 3.10: Water Availability in the Major Tributaries in the Sardu Watershed ... 54
Table 3.11: Community’s Respondents About the Use of Fertilizers and Pesticides in the Watershed ... 55
Table 4.1: Floral Diversity in the Watershed ... 58
Table 4.2: Fauna Diversity in the Watershed ... 59
Table 5.1: Economic Values of the Services ... 63
Table 6.1: Time Contribution for Different Activities in Hours Per Day by Male, Female and Children in the Watershed ... 66
Table 6.2: Involvement of Male and Female in Decision Making Process ... 67
Annex 1: Structured and Semi-structured Questionnaires Followed in the Study ... 108
Annex 2: Salient Features of the Watershed ... 117
Annex 3: Agriculture Production Scenario in the Watershed ... 117
Annex 4: Income Sources with the Tentative Amount Per Year in the Watershed ... 118
Annex 5: Multi-stakeholder’s Respondents for the Promotion of People-nature Relationship ... 119
Annex 6: Listing Flora (Plants) and Fauna (Animals) in the Watershed ... 121
Annex 7: Proposed Vegetation for Bio-engineering Works in the Watershed Area ... 125
Annex 8: Existing Native Cultivated Plants in the Study Area ... 126
Annex 9: Common Fauna of Sardu Watershed Area ... 127
Annex 10. Listing of the Problems Identified in the Watershed Area ... 128
Annex 11: Proposed Irrigation Ponds and Drinking Water Reservoir ... 129
Annex 12: Suitability Map for a Proper Land Used Practices for Cultivation ... 130
ADB Asian Development Bank
amsl Above Mean Sea Level
APEC Association for Protection of Environment and Culture,
Biratnagar
BISEP-ST Bio-diversity Sector Program for Siwaliks and Terai
BS Bikrum Sumbat
CARE Nepal Cooperation for American Relief Everywhere
CBDPP Community Based Disaster Preparedness Program
CBS Central Beaurue Statistics
CCA Climate Change Adaptation
CETD Centre for Environment and Tourism Development, Dharan
CFUCs Community Forest Users Committee
DD Drainage Density
DDC District Development Committee
DEM Digital Elevation Model
DFID Department for International Development
DHM Department of Hydrology and Meteorology
DIWC & WSMC Dharan Integrated Watershed Conservation and Water Supply
DNP Dharan Nagar Palika
DoMG Department of Mines and Geology
DRR Disaster Risk reduction
DoSCWM Department of Soil Conservation and Watershed
Management
EVA Economical Valuation Analysis
FAO Food Agricultural Organization
FGD Focus Group Discussion
GDP Gross Domestic Product
GIS Geographical Information System
HHs Households
HMG/N His Majesty's Government of Nepal
ICIMOD Inter-national Center for Integrated Mountain Development
IPCC Intergovernmental Panel of Climate Change
IUCN International Union for Conservation of Nature
JICA Japan International Co-operation Agency
LEK Local Ecological Knowledge
LULSA Land use and Land System Analysis
MLD Millions Litre per Day
MPN Most Probable Number
Mt Metric Tonne
NPC National Planning Commission
NTFP Non Timber Forest Products
NRs. Nepali Rupees
NWSCD Nepal Water Supply Corporation Dharan
PEK Public Ecological Knowledge
PES Payment for Eco system Services
PGIS Participatory Geographical Information System
PVA Participatory Vulnerability Analysis
RBA Rapid Bio-Diversity Assessment
SABO Soil Erosion Control (Japanese word)
SPSS Statistical Programme for Social Survey
TDN Total Digestible Nutrient
UN United Nation
UNDP United Nation Development Program
US$ United State Dollar
VDC Village Development Committee
WECS Centre for Water and Energy Secretariat
Chapter 1
Introduction
1.1 Background
Sardu watershed is a major source of drinking water for Dharan Municipality. The watershed is important not just as a source of drinking water but also provides provisioning services like food, fodder, fresh water and energy to upstream and downstream areas. Apart from the above mentioned services it also provides ecosystem services like supporting services (nutrient cycling, soil formation and primary production), regulating services (climate regulation, flood regulation, diseases regulation and water purification) and cultural services (aesthetic, spiritual, educational, recreational service). The importance lies in not just contributing to the ecological and livelihoods requirements of Dharan city and surrounding villages but also to the development of the entire eastern region of the country.
However in the recent years, the inhabitants of Dharan Municipality have been facing water shortage. It has been reported that the people residing within the watershed have also been facing scarcity of environmental services, particularly in food production, fodder, potable and irrigation water supply. As a result, upstream and downstream people who receive benefits through the natural services provided by the watershed have started blaming each other for the reduction in the benefits and services. For example, a case of displacement from the upstream of the watershed occurred in 1976. It was assumed that the upstream people had heavily encroached on the water sources and polluted the watershed. As a result, the local indigenous inhabitants (209 families) were relocated from the watershed to Bayarban Village Development Committee (VDC) in Morang District.
The problems regarding the encroachment of water sources and overexploitation of watershed services by people living upstream have led to scarcity of drinking water
downstream particularly in Dharan city. This has now become a great challenge for the entire watershed region. The root causes of the problem have been identified as:
• Lack of authority to conserve the natural resources in the watershed area;
• Lack of adequate knowledge about conservation of the resources; and
• Lack of integrated programs for sustainable development of the watershed area.
In order to address such issues, IUCN Nepal, has been playing a major role in the conservation of natural resources in the region as well as other parts of the country. IUCN along with Association for Protection of Environment and Culture (APEC), Biratnagar, a member organization of IUCN and Center for Environment and Tourism Development (CETD), Dharan, a local partner organization initiated a study of Sardu Watershed Plan by assessing environmental services available in the area. The main focus of the study was the sustainable conservation of natural services provided by the watershed through the
This study was conducted under the project funded by Department for International Development (DFID). The project aimed at achieving improvement of governance through changes in legal and policy frameworks at the national and sub-national levels that empower local communities and institutions in decision making processes and through strengthened land and resource rights that increase accountability and transparency in decision making
structures.
The study was based on Sardu watershed to maintain single line policies and regulations incorporating vulnerable groups having fair and equitable access to natural resources in general, and community forestry and watershed management systems in particular. During the course of implementation, several output documents had to be produced that would benefit the local stakeholders as well as influence the policy level decision-makers.
1.2 The Need for the Study
As mentioned above, the local government played a vital role in displacing the local communities from upstream of the watershed in 1976 to make Dharan and surrounding areas water secured. Although the present system has been able to achieve water sufficiency in the city and in providing other services to the communities within the watershed for the last 25 years, new issues and challenges for the management of natural assets have emerged in recent years. Some of the major issues are:
• Rapid population growth;
• Overexploitation of the natural resources;
• Human intervention on lands in the name of different developments being carried out without any environmental impacts studies;
• Poor knowledge of agriculture practices;
• Very limited farm land;
• Low productivity of the land;
• Lack of appropriate technologies;
• Poor farming practices;
• Dependence on firewood for energy; and
• Rapid in-migration on flood zones.
Government of Nepal had adopted the watershed management through participatory approach during 1990s and the approach is still being followed in the country. The approach has not been able to address the issues of natural resources management and community development. However, the planning was widely based on local people’s participation yet the watershed was not given priority by the local government and concerned stakeholders. Further, a systematic study of the watershed problem had not been carried out previously, although there have been some analysis of the status of the watershed in terms of water quality and land use practices after 2000. The finding of these studies highlighted poor quality of water in Sardu River and poor productivity of land in the region. In addition, with the development of market economy; local government, local consumers and Dharan civilians have been facing water scarcity as well as shortages of other natural resources.
Based on these analyses, it seems that many areas remain to be understood properly for sustainable watershed management. Trends in changes of environmental services, in regard to their values and consumption by local communities living in and around the watershed needs to be understood properly. Besides these, approach and efforts to promote sound soil
conservation and watershed management practices at grassroots of rural and urban societies and way of linking upstream and downstream needs to be identified for sustainable watershed management. Hence, this study has the following objectives.
1.3 Objectives of the Study
The overall objective of the study was to prepare a report of a collaborative and
participatory watershed conservation plan and draft mechanisms for cost and benefit sharing as well as forming linkages between upstream and downstream of the Sardu watershed.
The specific objectives of the assignment were:
• To assess economical valuation of watershed services particularly water and forest;
• To develop a mechanism for the application of the PES scheme in the watershed for good governance, management and for sustainable conservation of the watershed;
• To find out conflicts among stakeholders on management of Sardu watershed and its possible solutions; and
• To prepare a watershed management and conservation plan based on the land capability in order to increase water supply for drinking and agriculture and to maintain a natural system within the watershed area.
1.4 Scope of the Study
The following scopes were undertaken in the study:
• Workout the economic valuation of watershed services, particularly the direct use values of water and forest and get benefit cost ratio for the development of the watershed;
• Develop a mechanism of cost and benefit sharing for upstream and downstream resource users;
• Design elements of payment mechanism and recommend a model of PES
mechanisms for upstream conservation initiatives and downstream water availability for drinking water, agriculture in the watershed;
• Assess legal and regulatory framework for the mechanism of PES;
• Prepare a baseline information about the watershed and socio-economic situation of the communities in the watershed;
• Review the relevant literatures regarding PES mechanism and valuation of services and conservation measures;
• Delineate watershed boundary and compute the area;
• Carry out digitization of different features of the watershed and classify the land classes;
• Carry out the land capability classification;
• Obtain the average slope of the watershed and classify the lands into different slopes;
• Develop drainage map and compute drainage and drainage density of the watershed;
• Estimate and observe the runoff of the Sardu River;
• Workout the existing land cover and land use patterns of the watershed and compute the land coverage;
• Delineate the area of existing land use and proposed land use with proper management and conservation measures;
• Estimate soil loss and sediment yields before and after conservation measures;
• Recommend control measures for watershed management;
• Determine the existing condition of socio-economical profiles of the watershed;
• Workout the climatic situation of the watershed: annual, seasonal and monthly trends of maximum and minimum rainfall and temperatures;
• Prepare a draft report of watershed conservation plan by incorporating the outcomes of the economic valuation of the services and PES mechanism;
• Carry out a consultation meetings with concerned stakeholders for the discussion on the draft report; and
• Prepare the final report of the conservation plan and other several reports of economic analysis;
1.5 Methodology
Participatory Geographical Information System (PGIS); Economic Valuation Analysis (EVA) using total economic value framework and market price for those services which are traded in the market and the opportunity cost of time for not traded in the market; PES mechanism strategy using national and international practices and local context potential assessment; and Rapid Biological Assessments (RBA).The following steps were carried out in the study.
1.5.1 Desk Work: Literatures Review, Watershed Delineation, Mappings and Preparation of Questionnaires
Several published and unpublished reports, journals and texts books from different sources like IUCN Nepal, International Center for Integrated Mountain Development (ICIMOD), Department of Soil Conservation and Watershed Management (DSWM), Water and Energy Commission Secretariat(WECS), websites and the others relevant information were reviewed to conceptualize the principles of watershed management and conservation, conservation measures and land capability, water and soil conservation, economic valuation of watershed services including use and non-use, methodology for the Payment for
Environmental Services(PES) scheme etc. Documents of government policies and strategies, legal instruments like regulation, acts and International legal systems in distribution of natural resources were also considered in the literature review. The secondary data related to demography and the physical, environmental and economic development, and natural resources and environmental services were collected from the concerned municipality and Village Development Committee (VDC) profiles. The collected information/data were compiled and reviewed.
Similarly, topographic maps (Sheet Nos. 2687-02C, 2687 01D at a scale of 1:25000) compiled from 1: 5000 scale aerial photography taken in 1992 and field verification carried in 1995 and published in 1996 by the Survey Department, Government of Nepal, were used to get the topographical data and information about drainage, land use, land cover, trails, buildings/houses, build up areas and other infrastructures, forest lands and agricultures lands etc.
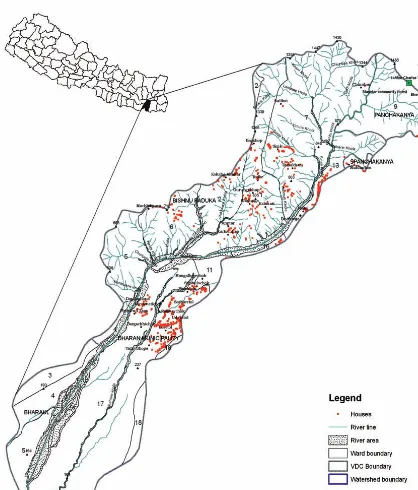
Watershed boundary was delineated on topographical maps at a scale of 1:25 000 on the basis of the principle of surface water divide with an outlet ridge-line using Geographical Information System (GIS). The base map of Sardu was prepared by incorporating major land features like boundary, rivers, buildings and ward and VDC boundaries (Figure 2.1). Structural and semi-structural questioners were developed to extract primary data related to social, natural and environmental status from the field (Annex 1).
Besides the literature reviews the following works were also carried out during the desk work:
• Preparation of different thematic maps like drainage map, existing land use map, DEM map, slope map, land classes map, etc.;
• Preparation of questionnaires for the Focus Group Discussion(FGD) and Households Surveys to be used during the field study;
APEC was formed and likewise part time sub-consultants in different subjects were also involved in the study and they were led by the lead consultant;
• Collecting secondary information regarding the hydrological and meteorological data from the Department of Hydrology and Meteorology (DHM); and
• Assessing climatic trends and estimated surface water flow in the Sardu River using empirical formula.
1.5.2 Field Work: Thematic Map Verification, Sampling, Household Survey, Multi-stakeholder Consultations and Interviews of Key Informants
Transect Walk
Delineated watershed boundary was verified in close consultation with local stakeholders and communities. The corrections were made on the base map based on the transect walk in the field. During the verification, sensitizations about the methods followed for the
demarcation of the watershed boundary were also carried out among the local organizations and political parties. As a result, the local people including reporters and journalists became aware about the watershed and its process of delineation.
Sampling
The household survey was carried out in three regions: upstream, midstream and downstream. The watershed has been divided into these regions on the basis of availability and uses of resources and on the basis of land system of the watershed.
Upstream includes ward 7 of Bishnupaduka VDC, Bhedetar market and Panchkannya VDC. The upstream from where Nepal Water Supply Corporation (NWSC) gets its water is also rich in flora and fauna. The population density is comparatively lower in upper region than in other regions. The total household number in the region is about 144.
Likewise, midstream also lies in upland and it covers wards 2, 1, 6 (partially) and 5 (partially) in Bishnupaduka VDC and physiographically the region lies mostly under the Siwalik area. Total household number in the region is about 331 and the potential water sources are high. But the region is vulnerable to landslides and erosions and it has more agriculture lands than any other regions of the watershed.
Downstream region lies in the lowland of the Dhahran municipality and comprises of wards 13, 16, 11, 17 & 18. This region is at risk of flood and bank cutting. About 2434 households are there in this region. It should be noted that complete areas of ward nos. 13, 16, 11, 17 and 18 are not included within the Watershed.
Several discussions amongst the study team including the local enumerators of this study, local organizations and scholar from Louisianan University were carried out to determine the sampling size for the household survey and to finalize the draft of structural questionnaires. On an average, 25% of the total households (564 HHs) including 33.8% in upstream, 23.3% in midstream and 18% in downstream of the watershed were taken for sampled household size. After identifying these three clusters (upstream, midstream and downstream) and the household numbers within each cluster, random sampling method was used to identify the sampled households. After having the first sampled households, 2nd sampled households were selected by skipping specific number and this was done till the end of desired sample size. The same process was applied in each cluster to identify each sampled households. 16 enumerators were involved in the survey of the households. The household survey questionnaires were tested by involving the enumerators and the questionnaires were finalized after consultation with them. All the enumerators were given orientation classes to familiarize themselves with the questionnaires and also to help them understand the context of the study.
Focus Group Discussions (FGD), Key Informants Interviews and Multi-stakeholders Discussions
Focus group discussions were carried out to identify the issues, problems and their causes and consequences. The FGDs were done during the field visits amongst Bhedetar and Tamkham communities in upstream, Bhanjayng, Karkichhap communities in midstream and with Rai tole, Phusere, and Devitole communities in downstream. The discussions mainly focused on the resources availability, its distribution and management among the communities living in the regions. The checklist prepared for the FGDs has been attached in the annex 1.
The interviews with key informants were carried out separately. The key informants involved in the discussions were political parties, VDC secretariats of Bishnupaduka and Panchkannya, Executive Officer of Dharan municipality, Federation of Nepalese Chamber of Commerce and Industry (FNCCI), Dharan, Civil societies, Nepal Journalist Association, Dharan, Community Forest Users Committee (CFUCs), Water Users Committee, Army Engineer Unit, Dharan, Police office, Hotel Association, Academic institutions etc.
Photo 3: Several Discussions with Experts at Field Level
1.5.3 Office Work: Data Entry, Processes, Analysis and Report Preparation
The household survey data and information were firstly compiled and checked. All the variables were coded and entered into the Statistical Programme for Social Survey (SPSS) program. Before coding and entering the data, the data managers were given orientation to help them understand the context of the study. Final tables were obtained after analyzing the entered data using SPSS.
Likewise, the inputs obtained from field verifications on base map, land use change map and other thematic maps were entered into the GIS and the final maps were acquired on respective themes.
Stakeholder Consultation Meetings and Report Preparation
Stakeholder consultation meetings were carried out on the discussions of inception and progress reports. The discussions basically concentrated on the delineation of watershed and the issues of the watershed management. The inputs obtained from the discussions were incorporated into the report. The write-up on the gender and social inclusions and biodiversity issues were collected from respective part time consultants. After compilation of the reports, including the economic valuation of the services, final report was prepared and submitted.
1.6 Expected Outcome
The expected outcome of the study is a report describing Watershed Conservation Plan and PES mechanism for the conservation of the Services of the watershed.
1.7 Sardu Watershed Management Plan: Vision, Mission, Guiding
Principles and Objectives
The Sardu Watershed Management Plan has been made with a vision, mission and specific objectives while incorporating the general principles of the watershed management. This plan is based on interactive research of Sardu watershed and is expected to be
implemented through the proposed PES mechanism. By providing opportunities for close involvement in the research, the local stakeholders assumed ownership of the programme and understood and adopted the findings. The vision of the plan was to find the reflection of feelings and experiences about importance of the watershed.
1.7.1 Vision
“The vision for Sardu watershed management plan is one of a healthy ecosystem with excellent water quality and quantity, sound environment with good relationship among stakeholders and healthy communities with sustain able economies that respect the cultural and social values of the communities served.”
1.7.2 Mission
Evidently, the watershed has been visualized as the “Heart for Dharan City” and promoting it as an amalgamation of environmental services along with he concept of community development through collaborative approach would go a long way in maintaining ecological sustainability of the watershed.
1.7.3 Objectives of the Plan
The following were the objectives of the plan:
• To maintain the integrity of the ecosystem in the watershed while making development decisions;
• To integrate watershed services into community development and soil conservation;
• To adopt collaborative and participatory approach for the promotion and development of environmental services; and
• To maintain a linkage between upstream, midstream and downstream communities for sustainable watershed management.
1.7.4 Principles of Watershed Management
• The Sardu Watershed Management Plan is viewed not only as a product but also as a part of an ongoing process. As new information/issues are obtained, the plan can be revisited and refined where necessary;
• The authorities, the concerned stakeholders including the local community leaders must be fully committed to sincerely introduce and execute programs that are directed towards the benefit of the people living in and around the watershed regionl;
• Although the integration of environmental and socio-economic issues was initiated more than a decade ago through Service Economy, Environment and Democracy (SEED) approach, the actual implementation, particularly in economy, environment and democracy sector has not been yet institutionalized in local level planning. Hence, development decisions are required to balance the distribution of socio-economic benefits while maintaining the integrity of the watershed ecosystem. Based on the fundamentals of development, this plan is guided by collaborative approach with active participation of upland and lowland communities. This approach includes variety of partners (upland, lowland communities, Dharan citizens, experts, concerned authorities, etc.) in a variety of roles that are generally related to the goals of environmental conservation and sustain able use and equitable sharing of resource and benefits;
• Nation’s knowledge and other local knowledge can be used in implementing the plan; and
• The institutional condition of the watershed management is weak. Conflicts are likely to arise for acquiring watershed services and mainly for water consumption. If such situations arise, all the concerned stakeholders should be carried in a single platform by building partnership and all the issues related to watershed services should be
Chapter 2
Study Area: Sardu Watershed
2.1 Introduction
This chapter deals with the study area mainly in two aspects: bio-physical profiles and socio-economic profiles. Physiography, geomorphology, climate, drainage, hydrology and vegetation of the study area are highlighted in this chapter.
2.2 Physiography
Sardu Watershed is located between 26o 45' 57.7" to 26o 52" 30.95"N and 87o 12' 20.43" to
87o 19' 20.20"E in Sunsari district of the eastern development region of Nepal (Figure 2.1).
The watershed has expanded from the foothills of Mahabharat range in Northern region (Chiuribas hills in central part, Bhedetar in eastern part and Silkot hills in western part) to Coniferous forest range in the Southern region. The area covers 39.35 sq km and comprises of mid-hills, Siwalik and Terai in the district. Its elevation ranges from 150m amsl at the point where tributaries of Sardu River meet in Charkosejhhadi (Coniferous forest) in the south to 1580m amsl at Chiuribas hill point in the north. The watershed’s maximum north-south and east-west aerial distances are 15.2 km and 4.9 km respectively. The longest length of the main channel of Sardu River (max length of travel of water) is about 17 km.
Wards 7, 1, 2, 5, 6 and 4 of Bisnupaduka VDC and ward 9 of Panchkannya VDC and wards 11, 13, 16, 17, 18 of Dharan Municipality lie within the watershed. Dharan is the nearest city of the watershed. The salient features of the watershed are attached in annex 2.
The watershed is palm shaped. The compactness coefficient and the form factor are1.81 and 0.024 respectively. The overland flow phase is predominant over the channel flow. Upstream of the watershed (above 1000m amsl) is confined but it is free when the river passes across the Dun valley and Siwalik and alluvial plain regions. Hence, the flow in the main channel is dependent on the land use practices. The size of the watershed is determined by its coverage area which is equivalent to 39.35 sq km. The average slope of the watershed is about 8.4% based on the date computed using Digital Elevation Model (DEM) in GIS environment. This is significant from conservation point of view.
Quantitative analysis has been carried out for the evaluation and for assessing the morphological characteristics of the watershed. The estimation in the report is based on the topographical map of 1996 that was pictured in 1992 by Department of Survey, Government of Nepal.
2.3 Geology
A distinct geological characteristic is found in the upper and lower reaches of the
biotic schist with consolidated quartzite and phylite limestone. Middle catchment comprises of poor consolidated sediment, alluvial complex and older alluvium. Active alluvium and older alluvium are present in the south of the watershed. Loamy skeletal is the texture of the upstream of the watershed. Likewise, the texture of the middle reaches of the watershed is sandy, loamy and contains boulders, whereas downstream of the watershed/lower reach encompasses sandy and loamy/boulders.
2.4 Climate, Drainage Network and Hydrology
The basic parameters of the hydrology are precipitation, humidity and runoff. The other parameters affecting the hydrology of watershed are drainage networks, vegetative covering and physiographic characteristics. Drainage pattern is a major factor influencing erosion and runoff patterns in the watershed. In general, high drainage density affects runoff pattern.
2.4.1 Climate
Since the elevation of the Sardu River is less than 1580m amsl, the watershed experiences two climatic classes: warm temperate climate above 1000m amsl and sub-tropical monsoon climate below 1000m amsl. The upstream of the watershed experiences warm annual average temperature ranging 15-20 0C whereas mid stream and downstream regions experiences
subtropical climate of annual temperature exceeding 20 0C. There are four distinct seasons
with respect to precipitation: dry pre monsoon (Mar - May) characterized by thunderstorm in the subtropical region; wet monsoon (June - Sept) with heavy precipitation; Post monsoon (Oct - Nov) with relatively moist air and winter (Dec - Feb) with dry air.
Temperature
Climatic station is not available within the watershed. The station in Dharan bajar of Index 1311, (located at about 2 km east from the watershed at an altitude of 440m amsl) is the nearest climate station to the watershed. It has been used for tempera-ture assessment in the study, though it has no long termtemperature data records.
The mean monthly average temperature at the station is 24.3 0C. The mean
maximum and minimum temperatures are 29.60C and 19.6 0C respectively. The temperature
record shows that normally May is the hottest and January the coldest month of the year. The highest normal and the lowest normal temperature at the station are 36.1 0C and 6.0 0C
respectively (Figure 2.2).
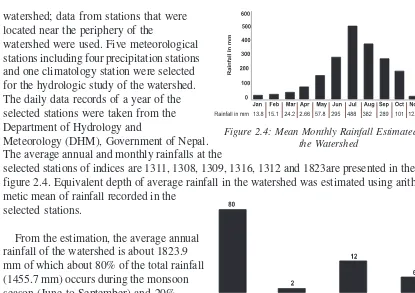
Rainfall
The watershed is rain fed run-off; therefore precipitation on the watershed determines the water availability in the river system. In this context, the study assessment of rainfall trends of the watershed is considered as a major parameter to determine the run-off generation in the river system of the watershed. Given that none of the
meteorological stations are located within the
Figure 2.2: Mean Monthly Temperature Recorded at Dharan during 1998-2008
watershed; data from stations that were located near the periphery of the
watershed were used. Five meteorological stations including four precipitation stations and one climatology station were selected for the hydrologic study of the watershed. The daily data records of a year of the selected stations were taken from the Department of Hydrology and
Meteorology (DHM), Government of Nepal. The average annual and monthly rainfalls at the
selected stations of indices are 1311, 1308, 1309, 1316, 1312 and 1823are presented in the figure 2.4. Equivalent depth of average rainfall in the watershed was estimated using arith-metic mean of rainfall recorded in the
selected stations.
From the estimation, the average annual rainfall of the watershed is about 1823.9 mm of which about 80% of the total rainfall (1455.7 mm) occurs during the monsoon season (June to September) and 20% (368.2 mm) during the rest of the year.
Rainfall analysis shows that about 80% of the total annual rainfall occurs during the monsoon period (June to September), 2% during the winter period (December to February), 12% in pre-monsoon (March to May) and 6% in post monsoon (October to November).
2.4.2 Drainage Networks and Drainage Density: Sardu River System
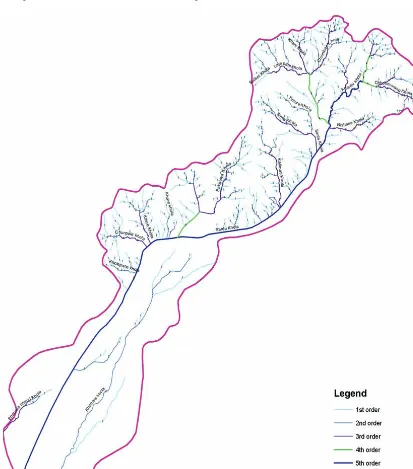
Sardu River originates in the foot hills of Mahabharat at an altitude of 1580m amsl. Within the watershed the total length of the main channel of the river is 17.17 km. The river flows through the the Siwalik (3.32 km), inner valley (6.20 km) and alluvial plains (7.58 km) and finally across the outlet at an altitude of 150m amsl. Its major tributaries are Khardu Khola, Chhotimorang khola, Lampate Khola, Chiuribas Khola, Khani Khola and Sulikot Khola. These rivers originate in the foothills of Mahabharat zone and Siwalik. The other tributaries are Timure Khola, Simle Khola, Tamakham Khola, Kalimati Khola, Machhamara Khola and Pakuwa khola. The source of Kavre khola and Chunpole khola lies in the Shiwalik zone. In recent years, many other gullies and rain-fed streams have sprouted in the river system.
The Sardu watershed is drained by more than 497 streams and rivers including distributaries with a total length of 142.85 km (Table 2.1). The stream order,
tributaries and rivulets of Sardu River were classified and their respective lengths were computed by using GIS on topographic map (1:25000). The computed lengths of the streams are presented in the table 2.1. The
Figure 2.4: Mean Monthly Rainfall Estimated for the Watershed
Figure 2.5: Rainfall at the Watershed by Season
Table 2.1: Stream Order and Length in Sardu River System
Stream Order Number of Streams Length in Meters
Sardu River is a fifth order river (Figure 2.6). The first order river plays a very significant role in deteriorating the watershed due to erosion.
The drainage density (DD) of the entire watershed is 4.54 km per km2. The density of the
major catchments Sardu and Khardu are significant for supplying drinking water to Dharan municipality. Drainage density of Sardu is 5.57 km per km2 which is greater than of Khardu
(4.85 km per km2). It means that the Sardu catchment is more susceptible to erosions in
comparison to khardu catchment with respect to stream networks.
The general slope of Sardu River is 8.4% and is distributed from North to South with varying topographic units. It is 24.74% in the Siwalik (above 600m amsl), 4.84 % in the fan zone (300-600 m amsl) and 2.05 %( <300m amsl) in the alluvial plain.
Hydrology: Prediction of Design Peak Runoff Rate-Discharge
Sardu watershed is not a river gauged basin. Therefore, peak discharges for various return periods were estimated at the outlet of the watershed using empirical relations. Further, rational method was used to estimate the peak discharge for the return periods of 10 years, 25 ears and 50 years. Water & Energy Commission Secretariat (WECS) approach which was modified by the Department of Hydrology and Meteorology was also used for the estimation of peak flood runoff for the different returns periods of 2 years, 10 years, 25 years and 50 years. The computed results are presented in the figure 2.7.
Figure 2.7 shows that the peak discharges estimated by using WECS approach at the outlet (150m amsl of the watershed) ranges from 54 cumecs to 239 cumecs for the return periods of 2 years to 50 years. The figure also shows that the peak discharges, estimated by using the rational approach at the outlet ranges from 318 cumecs to 397 cumecs for the return period ranging from 10 years to 50 years.
2.5 Socio-economic Profile and Responses
2.5.1 Demography and Population Projection
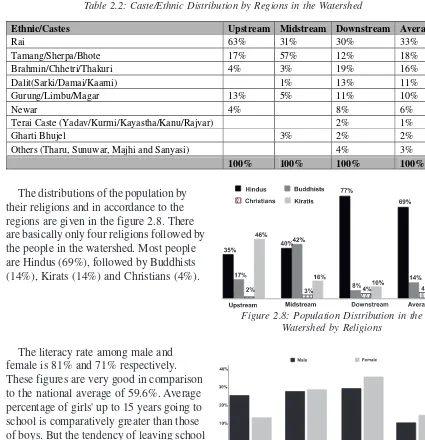
There are around 2909 households in the watershed. The distributions of the households’ in accordance to the upstream, midstream and downstream regions are 144, 331 and 2434 respectively. Total population in the watershed is about 11,319 comprising of 49% male and 51% female. Population density is the highest downstream with 669 persons per sq km, second is midstream with 116 persons per sq km and upstream has a density of 90 persons per sq km. On an average, the family size is about 5.3 persons/HH in the watershed. There are more than 22 ethnic/castes groups in the watershed (Table 2.2).
The distributions of the population by their religions and in accordance to the regions are given in the figure 2.8. There are basically only four religions followed by the people in the watershed. Most people are Hindus (69%), followed by Buddhists (14%), Kirats (14%) and Christians (4%).
The literacy rate among male and female is 81% and 71% respectively. These figures are very good in comparison to the national average of 59.6%. Average percentage of girls' up to 15 years going to school is comparatively greater than those of boys. But the tendency of leaving school by girls is higher than that of boys, as a result, the percentage of male having SLC
Figure 2.8: Population Distribution in the Watershed by Religions
Figure 2.9: Education Status in the Watershed Table 2.2: Caste/Ethnic Distribution by Regions in the Watershed
Ethnic/Castes Upstream Midstream Downstream Average
or above (14.8%) is higher than that of female (12%). But the percentage of higher education even of male is not satisfactory. Poverty is the main cause of poor education status in the watershed. Both male and female are compelled to quit their desire of higher education because of poverty. Male usually go to nearest city (mostly to Dharan city) as well as abroad for labours works and female are engaged in household works.
During the 1990s, nearly 22 %, 27%, and 4% of households form hills and mountain districts had migrated downstream (left bank of Sardu River-into flood zones-Dharan city), midstream and upstream of the watershed respectively. The migrated population mainly came from Bhojpur, Dhankuta and Khotang districts. The other districts from where people had migrated are Sunsari, Morang, Taplejung, Terahathum, Udayapur, Solukhumbu, Jhapa, Panchthar etc. There are more than 15 driving factors that had compelled people to migrate into the watershed. Nearly 28% population said that they migrated due to better facilities and livelihoods in Dharan city. Only 14% people stated natural disasters and Maoist insurgency as the cause for their migration. Migration trends in lower and middle part of the watershed have been increasing; thereby encroachment towards flood zone in the left bank of Sardu has enhanced and forest areas have been cleared for the settlements and agriculture use in the uphill of middle and upper parts of the watershed.
Population Projection
It has been projected that by the year 2025 with a growth rate of 1.97% in upland and 4.43% in lowland, the population would reach approximately 20,287 within the watershed. The break up in accordance to the three regions would be approximately 926 in upstream, 1,936 in midstream and 17,425 in downstream. The population growth in downstream is expected to be comparatively higher than in up and midstream regions (Figure 2.10). This is because most of the opportunities and facilities in terms of living standards and livelihoods are better in the municipality region which lies in the downstream. Likewise, the population projected by the year 2030 is approximately 2,77,365 in the municipality.
Institutions
There are significantly lower number of social organizations and institutions in the
watershed as compared to other similar watersheds. Their involvement in the conservation of the watershed is also not substantial.
There are 7 community forest organizations in the watershed, namely, Nametar Community Forest (covering Khardu catchment); Nisan Saranga Community Forest
(covering Chhotimorang and Nisane Catchments); Sagunri Community Forest (covering Sardu and Kalimati catchments); Karkichhap Community Forest (covering forest around
Karkichhap); Gaundhara Community Forest (covering Pakuwakhola and Machhamara catchments); Jalkannya Community Forest (covering Khare Khola and Machhamara Catchments); and Bhaldunga Community Forest (covering Kavre, Chunpole and Kholepani Khola Catchments). The first three community forest organizations lie in the upstream of the watershed and the rests are in mid and downstream regions. All these community forests had not been handed over to the communities by the government till this study was conducted. Some of them were under the process of being handed over to the communities but few of them were still in the process of registration. Due to lack of resources to strengthen their capacities to conserve, the forest areas have been exploited and have steadily decreased over the years. However, they have begun conservation practices on their own efforts.
Likewise, the 13 water user groups existing in the area are Khanepani Upabhokta Samiti; Water User Committee, Dharan 11 and 17; Gauritole Water User Committee, Dharan 13; Kalikhola Water User Committee; Sumnima and Naulobast Water User Committee; Jorsokhuwa Water User Committee; Loktantrik Basti Water User Committee; Water Management Coordination Committee, Dharan 11; Ganatantra Water User Committee, Dharan 13; Water User Committee, Dharan 16; Shree Kalikhola Water User Committee, Dharan 16; Phokland Water User Committee, Dharan 17; and Koloni Marga Water User Committee.
2.5.2 Economic Activities, Production and Food Sufficiency
General
Wage labour, agriculture (including livestock), overseas work and self employment through trades are the major sources of livelihood in the watershed. The major source of sustenance of 42% family is wage labour, agriculture 23%, self employment 14%, foreign employment 13% and 8% other sources. Furthermore, agriculture and livestock is the main source of livelihood for 92% family in midstream region of the watershed. Incomes from labour works are major source of livelihoods for nearly 33% population in upstream and for 48% population in downstream.
Per capita incomes of the people in upstream, midstream and downstream are NRs.3,480/-NRs. 11,683/- and NRs.3,480/-NRs. 12,669/- respectively. These figures are comparatively lower than the national per capita income of the year 2007/08 (US $470/-) (US $1= approx NRs. 70/-). These figures show that people’s income in downstream is more than in midstream and upstream. Incomes from private jobs and daily wages notably contribute to the increment of the total income of the communities in downstream region. Meanwhile, per capita income of midstream communities is 3 times higher than that of upstream communities. Livestock productions and overseas work significantly contribute to the midstream income (Annex 4).
Land Holdings and Production
So far as the land distribution in the watershed is concerned, only 51% families on average have their own lands for agricultural farming and of these, 77% families live in upstream, 66% in midstream and 46% families in downstream regions. Further, the irrigated land (Khet) in the watershed is only 27 ha, whereas non-irrigated land (Bari) is about 83 ha. 3 ha of the irrigated land fall in the upstream region, 14 ha in the midstream region and 11 Ha in the downstream region.
Annual average household's production is about 103 kg and 99 kg of vegetable and fruits in upstream and midstream regions respectively. The agriculture productions including cereal productions are listed in the tables in detail and are presented in annex 3.
Food production (cereal crops) in the watershed is trivial and is not meeting the
requirements of the existing population. In addition, total food available in the watershed is only 77.5 mt per year but the food requirements for upland people (2452) at the rate 223 kg person (DSCO, 2006) is 547 mt per year. The food is deficit by 85% in the watershed. This is because of low productivity of land , insufficient land for cereal crops production, conventional farming practices, lack of irrigation facilities etc. Although the land availability for cereal production is very limited in the watershed, the production can be increased by conservation farming practices along with the use of modern techniques, technologies and practices. So, high value crops, nitrogen fixing crops, and agro-biodiversity should be promoted in the watershed rather than cereal crops.
Livestock and Fodder Status
The number of goats in the watershed, particularly in the uphill regions (upstream and midstream) is substantial. It means that the people in uphill depend on goat business for their income generation. Currently the average number of livestock is about 17 per HH but it was 26 per HH five years ago.
The livestock density is higher in upstream than in the midstream and the highest lies in the downstream regions (Table 2.3). But the annual livestock production is comparatively more in midstream (NRs. 9984/- per HH) than in the upstream regions (NRs. 985/- per HH).
Table 2.3: Existing Livestock in the Watershed by Regions
Livestock Types Livestock in No.
Upstream Midstream Downstream Average
Cattles 605 602 30 1237
Buffalos 0 10 20 30
Goats 1445 1548 650 3643
Total 2050 2160 700 4910
Figure 2.12: Distributions of Toilets by Types and Regions in the Watershed
It was noted that open grazing system takes place in entire regions of the watershed. Because of open grazing, particularly in upstream region, the region is prone to soil erosions. So far as the fodder status within the watershed is concerned, annual fodder requirements (in terms of Total Digestible Nutrient -TDN) for existing livestock heads of 4910 is 1231 mt but the availability is 2323 mt. Though there is surplus of fodder, the production of resources from the livestock is not significant in quantity. This is mainly due to lack of proper knowledge about livestock management and its benefits.
Infrastructures
Road networks in downstream is comparatively better than upstream and midstream (Figure 2.13). Every cluster in downstream has access to road networks and one can reach Kosi Highway within an hour (in Panchkanny VDC). Dharan-Dhankuta road connects VDCs located in the north and south of the downstream region. But, very few villages of
Bishnupaduka have access to motorable earthen roads. The topography in Bishnupaduka VDC is not suitable for the construction of roads by using heavy machinery equipments. Yet, rural earthen road networks are being constructed haphazardly without undertaking any precautions to control erosion and landslides. Few examples of such constructions are roads from Dharan municipality to Bhanjyag in Bishnupaduka, from Dharan (Phusre) to Tamakham in Bishnupaduka, and from Bhedetar to Dhankuta through Chiuribas Danda. Meanwhile, several roads have emerged from Kosi Marga to different villages in Panchkanny VDC without any EIA or IEE studies. As a result the watershed faces real dangers of soil erosions and mass landslides during heavy rainfall.
The toilet facilities are not satisfactory in the watershed. Although almost 85% households have toilet facilities in the upstream region, only 23 % are pakki (with safety tanks) and remaining are pit toilets. About 15% households have no toilet facilities. Meanwhile, only 60% families in midstream have toilet facilities and 40% use open space as toilets (Figure 2.12). Likewise, 76% family has toilet facilities in downstream and the rest use open spaces. There is a high possibility of surface water
contamination in the Sardu River due to inadequate quantity and quality of toilet facilities.
Nearly 57% households have access to drinking water supplied by community-led management and the rest have access to drinking water that is managed by the water corporations in downstream region of the watershed. About 77% households in the upstream region and 92% households in the midstream region have public taps.
2.5.3 Energy Consumption and Fuel Wood Demand Projection
Fuel wood is the main source of energy for the people in the watershed. People spend 4-5 hrs a day to collect one bundle of fuel wood (about 40 kg - locally called
Bhari) from the forest, whereas only 1-2 hours was needed to collect the same amount of fuel wood a decade ago. The sources for fuel wood have been
decreasing in the recent years and this is mainly due to increase in population and lack of alternative sources of energy in the region. The fuel wood consumption rate (on average1030 kg) is highly greater in the
watershed than national per capita consumption rate (402.76 kg per year)1. The consumption
rate of the upstream people is greater than the national rate by 120%. Likewise the consump-tion rate is larger than naconsump-tional rate in midstream by 408% (Figure 2.14). These figures indicate that consumption of fuel wood is one of the major causes of deforestation in the region. It also shows that forest quality is poor in the watershed in general and is worst in midstream region.
The projected fuel wood demand on the base of national per capita consumption rate in the next 15 years will be about 8,171 mt for a total population of approximately 20,287 (Figure 2.15).
2.5.4 Awareness and Responses
Level of awareness and responses were assessed in Micro and Macro levels in view of sustainable watershed management. The awareness of and responses to negative changes differ greatly between the micro (farm/village communities) and macro (policy and plan makers and key stakeholders) levels2. Conservation practices to sustain watershed condition
are of major concern in the watershed. In view of this, level of awareness and responses to negative changes found in the study were assessed by taking the perceptions of communities
Figure 2.14: Fuel Wood Consumption within the Watershed Based on the Data Survey, 2009
Figure 2.15: Fuel Wood Demand Projection in the Watershed
within the watershed at micro level and of major stakeholders at macro level (watershed beneficiaries in Dharan city).
At Micro Level
On the bases of conservation, only 35% people in upstream and midstream believe that the watershed is in good condition. Only 22% of the communities in downstream believe that the watershed condition has been maintained at a
satisfactory level in the last 5 years. As per the perception of the communities and our field visits there is an urgent need for proper conservation plan and its implementation.
It was found that almost 72% people practice up-down ploughing for cultivation on the slope lands. Likewise, only 12 % farmers’ use terrace cropping and just 6% people practice cropping by making water outlets to control rill erosions. Almost 91% of the communities still don’t know about the inter-cropping practices on slope lands in the upland regions (Figure 2.16).
About 56% people in the upstream region say that the availability of water has been decreasing in recent years due to severe deforestation but only 28 % people residing in downstream region agree to this. This statement gives us various conclusions: Downstream communities lack knowledge about the relationship of conservation of water sources and water availability; communities in upstream are much more aware about the importance of forest in the region; loss of forest has seen significant in recent years and thereby
communities within and outside the watershed are not only aware about the importance of conservation of watershed but are also conscious about the causes and consequences of deforestation. However, communities in the up-hill region (mostly in Bisnupaduka VDC) lack technical knowledge about conservation and at the same time they do not have any other option but to be dependent on fuel wood for their livelihood.
Community’s perception on importance of Sardu watershed gives us a clear picture on the importance and urgency for development of conservation plans. Responses on the impor-tance of watershed in regards to its services were collected from the communities. For example, around 61% of the communities said that the watershed was essential for water services. Nearly 60% people stated that the watershed was valuable for resource like wood and fuel wood. About 53% believed that boulders/pebbles/stones were important services that were obtained from the watershed and 51% believed that the watershed was the main source for fodder. According to farmers, the other services that are being provided by the watershed are natural herbs, fruits, agriculture products, animals, grazing, fish, irrigation etc. (Details of bio-diversity services available in the watershed are given in the next chapter)
On an average, about 63% of the communities believed that severe impacts would happen on their livelihoods if prohibitory mechanism took place for the collection of the watershed services. For sustainability of the watershed, perceptions of the communities need to be transformed and a concept of a win-win relationship between supply of watershed services and community’s needs need to be built. Communities believe that this can be achieved through: Capacity development programs (responded by 50%), alternative energy and
capacity building for scientific agriculture framings, control mechanism on the uses of services, replacement of settlements (responded by 33% people) from flood and crack zones and also from the areas where water sources are available. Community’s willingness to control negative changes that are occurring in the watershed is tabulated and presented in the table 2.4.
At Macro Level
Responses through policy and planning to negative changes in the watershed had been initiated many years ago. For example, upland part of the watershed was prohibited for settlements after enacting the oral declaration in the legal documents (in Nepal Rajpatra). The declaration concerning the protection of the watershed area was declared by Late King Birendra Bir Bikram Shah Dev in 1976. In the following years, 209 houses were relocated to Morang district (for details please consult compiled documents in CETD, Dharan). The watershed supplies drinking water for about 85% of the total population of Dharan Municipality, however, in the recent years, public of Dharan municipality have been facing severe shortage of drinking water both in quality and quantity.
A few rules and policies are made for sustainable watershed management in the country, for example, Soil and Watershed Conservation Act, 1982 (section 1) defines the soil and watershed conservation. According to the act, “soil and watershed conservation means the work of protecting or saving any area from such natural disasters as floods, landslides and soil erosion, keeping the volume and flow of water in normal condition, for
maintaining the purity of the flow of water without letting it get muddy. The act also focuses on declaration of protected watershed area (section 3).” But the act does not give a clear concept of the meaning of watershed. It only gives the definition of soil and watershed conservation and it does not address the concept of sustainable watershed management.
GoN has the following targets regarding environmental management for watershed and aquatic ecosystems (NWP, 2005):
• by 2027, a management plan nationally important watersheds and aquatic system are prepared and initiated;
• by 2007, water quality and wastewater quality standards are developed and enforced;
• by 2017, full-scale environmental protection and management protects are implemented in all priority watershed and aquatic ecosystems;
• by 2017, stakeholders’ participation in environmental protection and management is provided for;
• by 2027, quality of watersheds is increased by 80% in all regions; and
• by 2027, adequate water quality is attained for aquatic habitat, including fish, human consumption and recreation, in all rivers and lakes.
Table 2.4: Tabulated Figures on Community’s Willingness for the Conservation of the Watershed
What Would be Your Contribution for the Management of the Watershed?
Responded by
Physical contribution (Sram daan) 47%
Money 42%
Don't know/ can't say 11%
What Role do You Play on the Upper Part to Conserve the source?
Responded by
Do want to involve but need a sustainable mechanism with programs
80%
Do not want to involve at all 3%
In order to address the above targets, National Water Plan recommends 10 major programmes for the sustainable watershed management (2002-2027). The activities are as follows:
• Improve environmental database system;
• Map important, critical and priority watershed and aquatic ecosystems;
• Develop water and wastewater quality standards and regulations;
• Implement water conservation education programme;
• Implement nationally important watersheds and aquatic ecosystems protections, rehabilitations and management programmes;
• Develop strategic environmental assessment in water resources management;
• Ensure compliance with environmental impact assessment;
• Promote community participation in the management of watershed and aquatic ecosystems;
• Enhance institutional capacity and coordination; and
• Develop watershed management policy.
The programmes mentioned above were made on the basis of watershed conditions district-wise prioritized by the Department of Soil Conservation and Watershed Management (Figure 2.17). According to the watershed condition map, watersheds that lie in the Sunsari District are under good condition (shown by green color on the map). The studied Sardu watershed was good condition in 1980s but the watershed has now been deteriorating in the recent years.