©
,
-
!
.
/
,
0
1
2
#% )%3 4 5 0
&%1 ,
6
&%1)
Postgraduate Programe Doctoral of Economics Science, Faculty of Economics and Business, Diponegoro University
2)
Faculty of Fisheries and Marine Science, Diponegoro University
3)
Faculty of Economics and Business, Diponegoro University, Indonesia Jl. Prof. Soedarto SH. UNDIP, Tembalang, Semarang. 50275
Email: [email protected]
Received: February 28, 2014, Accepted: April 22, 2014
.57 7
The purpose of this study was to develop the model of profit estimation in Aquaculture. This research used a model of von Bertalanffy length growth combined with the length weight relationship, and developed an equation of time harvest to produce the target of fish weight as the market preferences. That also developed an equation to estimate the fish biomass, and the profit in aquaculture. The Profit is a total of revenue minus total of cost. Both the harvested biomass of fish and price of fish affect the revenue of aquaculture. The components of costs were a cost of seed procurement, cost of feed procurement, cost of transportation of products and the daily cost. The daily cost of aquaculture in floating cages were a cost of labour, cost of vitamins, cost of energy, cost of assets depreciation, cost of supporting equipment and cost of maintenance assets that converted to IDR (Indonesian Rupiah) (day) 1. The research proved if lthe model in this study could be used to estimate the profit of aquaculture. In case of red culture (floating cage) in Reservoir of Wadaslintang, aquaculture at 120 days produced a fish average weight of 200 g (profit IDR. 13,507,167), then at 143 days produced 250 g (profit IDR. 17,975,723), at 164 days produced 300 g (profit IDR. 21,853,697), at 185 days produced 350 g (profit IDR. 25,387,418), at 204 days produced 400 g (profit IDR. 28,181,081), at 223 days produced 450 g (profit IDR. 30,507,200), and at 242 days produced 500 g (profit IDR. 32,297,418).
8 26 : profit, von Bertalanffy, floating cage, Red , Reservoir of Wadaslintang
97 (1: 7 (9
The goal of business activities is getting the profit, including aquaculture. Aquaculturists or fish farmers need an information about how much the profit of aquaculture in several business scenarios. Information of profit in several scenarios could be used to set the strategies of aquaculture and to minimize the risk of business.
Each type of business has some different characteristics. The modelling of aquaculture business could not ignore the biology factors of fish cultured. The biology characteristic of fish cultured influence both a revenue and costs, then also influence the profit of aquaculture business. So, the modelling of profit estimation in Aquaculture could use a bioeconomic approach.
Bioeconomic is a multiple approach study which combine science of biology, mathematic and economic. The application of bioeconomic in aquaculture need a growth model of fish, both an individuals and biomass of fish. The growth of fish is influenced by several factors, that is an average growth of fish, initial fish populations and mortality rates. The biomass of fish influence both a revenue and costs of aquaculture. Total revenue is multiplication price and biomass of fish. Biomass growth also affects the total cost, especially the cost of feed procurement and cost of transportation harvesting.
There was several studies of aquculture bioeconomics. Bjorndal (1988) developed a general rule in the optimization of
the harvest time. The Model of Bjorndal used Beverton Holt growth model to optimize the profit of aquaculture, but Bjorndal ignored fixed capital in the decision harvest. Arnason (1992) addressed the interdependence of optimal feeding path and harvesting time. Arnason continued the study of Bjorndal (1988), but the Model of Arnason assumed the profit optimization was be influenced only by feeding and harvest time factors. Heap (1993) also continued the study of Bjorndal (1988) and Arnason (1992). But Heap focused on optimalization of the feeding process to generate optimal profits. Strand and Mistiaen (1999) also continued the study of Bjorndal (1988) and Arnason (1992) by incorporating a piecewise continuous price factors in the model. The model of Strand and Mistiaen assumed that the fish cultured was a single fish with no natural mortality. Antonelli, Bischi, and Lamantia (2005) were develop the bioeconomic model of the interaction between aquaculture and open sea fisheries. Yu and Leung (2006) were develop the bioeconomic model of optimal partial harvesting schedule for aquaculture operations.
cost (cost of harvest labour, transportation cost and interest on operating cost).
The purpose of this study was to develop the model of profit estimation in Aquaculture. Indonesia have some major aquaculture commodities, including Shrimp, Milkfish, Cat Fish, Seaweed, Grouper, , Common Carp and Red . In this study, the model of profit estimation was applied to the red culture in floating cages in the Reservoir of Wadaslintang, Indonesia.
7- ; 91 -7<(1
This research used applied research approach. Applied research is application research to solve the spesific problems, and could be divide of evaluation research, research and development, and action research (Kuncoro, 2003). The aquaculturist need a profit model to estimate their profit in several scenarios based on market preference, especially a size of fish harvested.
This research used both the primary and secondary data. The secondary data collected from several references, including the government publications, journals and data owned by aquaculturist. The primary data were collected by observation and indepth interview with the key informants, including an aquaculturist, and fish traders. The respondent of aquaculturist is the Cooperative of Serba Usaha Bersama Maju Sejahtera management. This research used a several data, including aquaculture cost, price of fish, fish growth, length of fish, weight of fish, FCR (Food Convertion Ratio), initial weight of fish, density of fish, and Mortality Rate (MR).
Projection of cashflow (both cash inflow and cash outflow) would be implemented to analysis a business feasibility of aquaculture. Financial analysis used net present value (NPV), internal rate of return (IRR) and payback periods. In this research, inflation rate would be assumed 5%/years dan discount rate would be assumed 12%.
The growth of fish has certain characteristics, which each species has different characteristics. In this study, fish growth used the von Bertalanffy length growth model, by the
equation (equation 2). Estimation to K and to used an equation
(3). estimated the time of aquaculture (ta) to produce a certain fish
weight as the target and also to estimated the fish biomass at ta
(Bta).
The profit of business is depend on a revenue and cost. The profit of aquaculture at time ta (Πta) is the total of revenue
cultured (day), so equation of t and Wta are:
MR = SRta/ta (10)
Nta = No(1 MR.ta) (11)
Bta = Wta.No.(1 MR.ta) (12)
Maximum fish biomass (Bmax) could be estimated by the first
derivative of the fish biomass equation (12) to ta equal to zero
or dBta/dta = 0. Based on equation (9), the equation to estimate
the aquaculture time to generate the target of size harvest (Wta)
was:
Total of revenue is influenced by the biomass of harvested fish (Bta) and the price of harvested fish (Pfi). Total of costs
depreciation (Cdp), cost of supporting equipment procurement
(Cst) and cost of maintenance assets (cam) were converted to
units of IDR/day.
TRta = Bta.Pfi (14)
TCta = Cs + Cfe + Ctr+ Cdy.ta (15)
The cost of procurement of seeds is influenced by the price of seeds (Ps), and biomass of seeds in the initial period which
conversion ratio (FCR). The cost of transportation of products is influenced by a tariff of transportion (Ptr) and fish biomass.
Cs = Ps.No.Wo (16)
Cfe = (BtaNo.Wo) FCR.Pfe (17)
Ctr = Bta.Ptr (18)
In intensive aquaculture, the procurement cost of artificial fish feed has a large proportion in the composition of costs. Furthermore, by using equation (7), (14), and (15), the equation of profit is: aquaculture. However, if the method of culture does not using floating cages, it is necessary to adjust the cost, especially the component of daily cost (Cdy). If Winf, K, to, tao, ta, b, No, MR,
Pfi, Ps, Wo, FCR, Pfe, Ptr and Cdy are known, so the profit of
aquaculture could be estimated. If aquaculturist have Wta as the
target of fish size harvested, so by use equation (9) could be
Aquaculturist or fish farmers at Reservoir of Wadaslintang Indonesia inconsolidated in Cooperative of & ! '
( & ( . Aquaculturist of Red
() ) at Reservoir of Wadaslintang use
floating cage. There are several size of floating cage in Reservoir of Wadaslintang, but this research assumed:
• 1 unit of floating cage have 12 cage. Cage size was 5x5x5 m3. The investment cost of floating cage was IDR. 88,000,000 (unit) 1. Floating cage could be used 10 years. • The investment cost of boat was IDR. 5,000,000. The boat
could be used 5 years.
• The investment cost of machine to boat was IDR. 5,000,000. The boat machine could be used 5 years. • The size of fingerling was 25 g. Initial of fingerling was
4,000 fish (unit)1 of floating cage. The price of fingerling was IDR. 20,000 (kg) 1.
• The cost of maintenance assets was IDR. 1,200,000 (years)
1
.
• The aquaculture periods was 4 months per cycle.
• The cost of vitamins was IDR. 1,000,000 (cycle) 1 of • Food conversion ratio (FCR) was 1,3.
• The cost of transportation of products was IDR 1,000 (kg)
1
.
• The average of fish harvested was 250 g.
• The survival rate (SR) of fish cultured was 80% for 4 months, or the mortality rate (MR) was 0,1,667% (days) 1. • The price of fish harvested was IDR. 17,000 (kg) 1.
Financial analysis could be done by use above data. The forecasting of cashflow in bussiness of red culture in Reservoir of Wadaslintang would be done in 10 years.
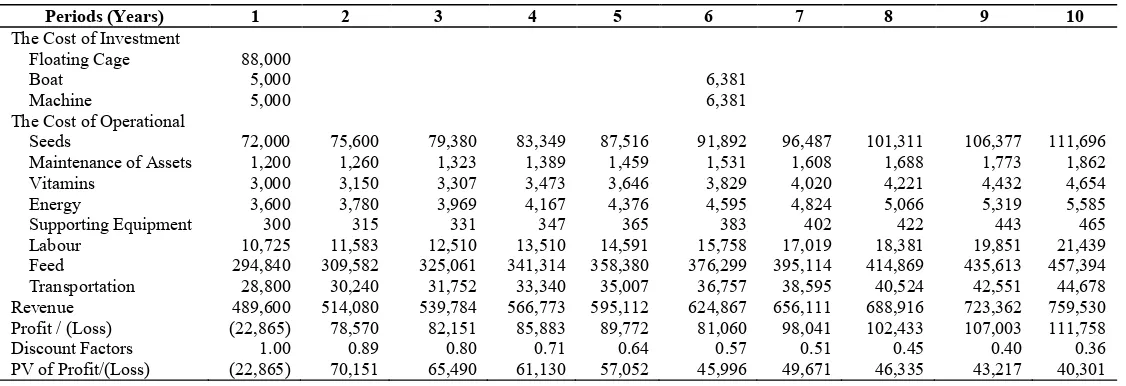
Table 1. The Cashflow Projection
, $= % # ) & + > ? @ ' A #*
The Cost of Investment
Floating Cage 88,000
Boat 5,000 6,381
Machine 5,000 6,381
The Cost of Operational
Seeds 72,000 75,600 79,380 83,349 87,516 91,892 96,487 101,311 106,377 111,696
Maintenance of Assets 1,200 1,260 1,323 1,389 1,459 1,531 1,608 1,688 1,773 1,862
Vitamins 3,000 3,150 3,307 3,473 3,646 3,829 4,020 4,221 4,432 4,654
Energy 3,600 3,780 3,969 4,167 4,376 4,595 4,824 5,066 5,319 5,585
Supporting Equipment 300 315 331 347 365 383 402 422 443 465
Labour 10,725 11,583 12,510 13,510 14,591 15,758 17,019 18,381 19,851 21,439
Feed 294,840 309,582 325,061 341,314 358,380 376,299 395,114 414,869 435,613 457,394
Transportation 28,800 30,240 31,752 33,340 35,007 36,757 38,595 40,524 42,551 44,678
Revenue 489,600 514,080 539,784 566,773 595,112 624,867 656,111 688,916 723,362 759,530
Profit / (Loss) (22,865) 78,570 82,151 85,883 89,772 81,060 98,041 102,433 107,003 111,758
Discount Factors 1.00 0.89 0.80 0.71 0.64 0.57 0.51 0.45 0.40 0.36
PV of Profit/(Loss) (22,865) 70,151 65,490 61,130 57,052 45,996 49,671 46,335 43,217 40,301
Note: Unit in IDR. 1,000 (except a ), and PV is present value.
Application of equation (4) could to estimate the length weight relationship of red tilapia. To estimate the value of a and b could use an equation:
LnWt = Lna + bLt (20)
Equation (20) was applied to the case of red culture in floating cages in the Reservoir of Wadaslintang, Indonesia. Based on the analysis, the length weight relationship of red culture in floating cages in the Reservoir of Wadaslintang were:
W = 0.016 Lt3,005 (21)
Infinity length (Linf) of red tilapia estimated at 50.04 cm and
infinity weight (Winf) estimated at 2.095 kg. From several
studies in various locations, red has a diverse both the infinity length and infinity weight. The research of Grammer,
(2012) proved if tilapia () , Linnaeus,
1758) in Coastal of Mississippi (USA) could reach a length of 40 cm and a weight of 1,293 g. The study of El Bokhty (2010) in Manzalah Lake (Egypt) showed that the red
() ) has an infinity length of 22.67 cm. The
research of Ahmed . (2003) showed that )
in Kaptai Dam (Bangladesh) has an infinity length of 55.59 cm with equation total of length (TL) weight (W) follows the equation W = 0.0366 TL 2,844. The research of Dache (1990) proved that the infinity length of the fish
) in Lake Victoria (Kenya) were 61.3 cm.
The research of Asila and Okemwa (1999) showed that
) (L) in Lake of Victoria (Kenya) has an
infinity length about 122 cm.
In this study, the K value estimated at
0.00294133586234927 and value t0 is 2.21945945860328. By
using equations (1) and (6), the equation length and weight of red tilapia cultured in floating cages in the Reservoir of Wadaslintang as the following equation:
[
0.00294(t 2.219)]
t 50,041 e
L = − − − (22)
[
0.00294(t 2.219)]
3,005 t2.095,47
1
e
W
=
−
− − (23)Figure 1. Simulation of Length (cm) and Weight (g) Red Growth
Equation (13) could be estimated the time of aquaculture to produce a certain size of fish harvest as the target. If the target of fish size were 0.2 g, the time of aquaculture were 120 days.
If the target of fish size were 0.25 g, the time of aquaculture were 143 days. If the target of fish size were 0.3 g, the time of aquaculture were 164 days.
-10 20 30 40 50 60
0 1000 2000 3000 4000
Days Cm
-500 1.000 1.500 2.000 2.500
0 1000 2000 3000 4000
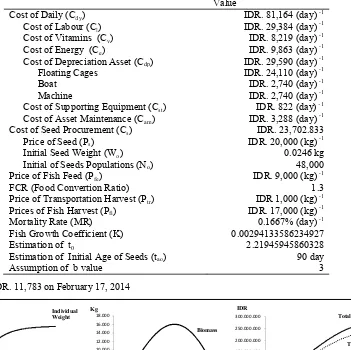
Profit estimation of red tilapia culture in floating cages in the Reservoir of Wadaslintang used several assumptions:
Table 2. Assumptions to Profit Estimation
Value
Cost of Daily (Cdy) IDR. 81,164 (day)
1
Cost of Labour (Cl) IDR. 29,384 (day) 1
Cost of Vitamins (Cv) IDR. 8,219 (day) 1
Cost of Energy (Ce) IDR. 9,863 (day) 1
Cost of Depreciation Asset (Cdp) IDR. 29,590 (day) 1
Floating Cages IDR. 24,110 (day) 1
Boat IDR. 2,740 (day) 1
Machine IDR. 2,740 (day) 1
Cost of Supporting Equipment (Cst) IDR. 822 (day) 1
Cost of Asset Maintenance (Cam) IDR. 3,288 (day) 1
Cost of Seed Procurement (Cs) IDR. 23,702.833
Price of Seed (Ps) IDR. 20,000 (kg) 1
Initial Seed Weight (Wo) 0.0246 kg
Initial of Seeds Populations (No) 48,000
Price of Fish Feed (Pfe) IDR. 9,000 (kg) 1
FCR (Food Convertion Ratio) 1.3
Price of Transportation Harvest (Ptr) IDR 1,000 (kg)
1
Prices of Fish Harvest (Pfi) IDR. 17,000 (kg) 1
Mortality Rate (MR) 0.1667% (day) 1
Fish Growth Coefficient (K) 0.00294133586234927
Estimation of t0 2.21945945860328
Estimation of Initial Age of Seeds (tao) 90 day
Assumption of b value 3
Note: U.S. $ 1 equal to IDR. 11,783 on February 17, 2014
Figure 2. Simulation of Weight Individual Fish, Fish Biomass, Revenue, Cost and Profit
In the beginning, fish biomass has asignificant growth, but at any given time they decreasing caused by the mortality rate. The growth pattern of fish biomass affects to pattern of both cost and revenue. The largest proportion of costs in floating cages of red culture was the cost of feed. On the red culture in floating cages, artificial feeding was intensified because fish density was relatively high and the availability of natural feed was insufficient to meet the nutritional needs of fish cultured. For comparison, the study of
Rahayu (2011) proved that the cost proportion of feed procurement in the red culture in running water pond in Klaten Indonesia could reach 65.55% of the total of cost.
In principle, the business need to take into account the market demand, which the market has a certain preference. Based on the survey results, aquaculturist at Subdustrict of Wadaslintang harvested the red in range betwen 200 500 g. The fish harvested sold in fresh fish condition to local market in Regency of Wonosobo and Regency of Kebumen.
Table 3. Profit Estimation
5 B 3 < $0% ! 7 $ 2 % $ 1 % $ 1 % , $ 1 %
200 120 130,795,505 117,288,338 13,507,167
250 143 155,842,184 137,866,461 17,975,723
300 164 177,912,243 156,058,545 21,853,697
350 185 198,621,299 173,233,881 25,387,418
400 204 215,762,779 187,581,698 28,181,081
450 223 231,055,830 200,548,630 30,507,200
500 242 244,230,200 211,932,782 32,297,418
0 2.000 4.000 6.000 8.000 10.000 12.000 14.000 16.000 18.000
0 100 200 300 400 500 600
80
.
! 7 $1 2 %
0,0 0,5 1,0 1,5 2,0 2,5
0 500 1000 1500 2000 2500 80
! 7 $1 2 %
0
(50.000.000) -50.000.000 100.000.000 150.000.000 200.000.000 250.000.000 300.000.000
0 50 100 150 200 250 300 350
7
7
,
! 7 $1 2 %
The aspects of market preference do not be ignored, because the aquaculturist could not force consumers to buy the fish on based not their preference. But, market preference are dynamic and there are the possibility of inter regional markets have a different preference.
(9 ;:5 (9
Profit estimation model in this study could be applied to estimate the profit of aquaculture in a certain of fish size target. In case of red culture use floating cage in Reservoir of Wadaslintang, aquaculture at 120 days produced a fish average weight of 200 g, and get profit IDR. 13,507,167. Aquaculture at 143 days produced a fish average weight of 250 g, and get profit IDR. 17,975,723. Aquaculture at 164 days produced a fish average weight of 300 g, and get profit IDR. 21,853,697. Aquaculture at 185 days produced a fish average weight of 350 g, and get profit IDR. 25 387 418. Aquaculture at 204 days produced a fish average weight of 400 g, and get profit IDR. 28 181 081. Aquaculture at 223 days produced a fish average weight of 450 g, and get profit IDR. 30 507 200. Aquaculture at 242 days produced a fish average weight of 500 g, and get profit IDR. 32,297,418.
89( ;-1C- -975
Thanks to Prof. Dr. Purbayu, Dr. I.B. Hendrarto, Dr. A.S Kurnia, Dr. H. Sasana, Dr. D. Harwanto and Prof. Dr. AN Bambang who have given advice to the writer in finishing this research.
-3- -9 -5
Ahmed, K.K.U., S.M.N. Amin, G.C. Haldar, and S. Dewan. 2003. Population Dynamics and Stock Assessment of
) (Linnaeus) in the Kaptai Reservoir,
Bangladesh. * +, , 50 (1) : 47 52.
Antonelli, G., G. I. Bischi, and F. Lamantia. 2005. Mathematical Bioeconomic Modelling of The Interaction Between Aquaculture and Open Sea Fisheries. Editor: Kenneth J Thomson and Lorenzo Venzi. 95th EAAE Seminar, Civitavecchia (Rome), 9 11 December 2005.
Arnason, R. 1992. Optimal Feeding Schedules and Harvesting Time in Aquaculture. Marine Resource Economics, 7: 15 35 pp.
Asila, A.A. and E. Okemwa. 1999. Growth Parameters for
(L), - (Forsskal),
) (L), $ (Burchell)
and Synodontis Species Derived from Tag Return. KMFRI; Kenya, 204 207 pp.
Bjorndal, T. 1988. Optimal Harvesting of Farmed Fish.
# , 5: 139 159.
Dache, S.A.O. 1990. Observations on the Fisheries, Growth
and Mortality Rate of ) (Tilapia) in
the Nyanza Gulf of Lake Victoria. Kenya Marine and Fisheries Research Institute, 59 65 pp.
El Bokhty, E.E.B. 2010. Fisheries Management of
) and ) Caught by
Trammel Nets and Basket Traps in Lake Manzalah, Egypt.
+ & 2 (1): 51 58.
Grammer, G.L., W.T. Slack, M.S. Peterson and M.A. Dugo.
2012. Nile Tilapia ) (Linnaeus, 1758)
Establishment In Temperate Mississippi, USA: Multi Year Survival Confirmed by Otolith Ages. . * % 7: 367 376.
Heap, T. 1993. The Optimal Feeding of Farmed Fish.
# , 8: 89 99
Kuncoro, M. 2003. Metode Riset untuk Bisnis dan Ekonomi. Erlangga; Jakarta.
Rahayu, W. 2011. Analisis Pendapatan Usaha Pembesaran Ikan
Nila Merah () sp) pada Kolam Air Deras Di
Kecamatan Polanharjo Kabupaten Klaten. + * /*
7(1): 1 13.
Springborn, R.R., A.L. Jensen, W.Y.B. Chang, and C. Engle. 1992. Optimum Harvest Time in Aquaculture: an Application of Economic Principles to a Nile tilapia,
) (L.), growth model. .
, 23: 639 647.
Strand, I., and J.A. Mistiaen. 1999. Optimal Feeding and Harvest Time for Fish with Weight Dependent Prices.
# , 13: 231 246.
Yu, R. and P. Leung. 2006. Optimal Partial Harvesting
Schedule for Aquaculture Operations. #