AUTHOR
COPY
Journal of the Operational Research Society (2009) 60, 1670 --1673 2009 Operational Research Society Ltd. All rights reserved. 0160-5682/09 www.palgrave-journals.com/jors/
Criteria for a tournament: the World Professional
Snooker Championship
SR Clarke1, JM Norman2,∗
and CB Stride2
1Swinburne University, Hawthorn, Victoria, Australia; and2University of Sheffield, Sheffield, UK
Desirable qualities of a tournament are fairness (the better the player, the better his chance of success), balance (few one-sided matches) and efficiency (long enough to benefit the more skillful yet being completed within schedule). The World Professional Snooker Championship is examined to see how well it meets these criteria.
Journal of the Operational Research Society(2009)60,1670 – 1673. doi:10.1057/jors.2008.126 Published online 19 November 2008
Keywords:sports; statistics; snooker
Introduction
A well-designed tournament should be fair, balanced and effi-cient. A fair tournament is one in which the better the player, the greater his chance of winning. In practice, it would be unfair, for example, if the more skillful players in the tour-nament were made to play elimination matches among them-selves before playing against the less skillful players. An objective for a balanced tournament might be to reduce the number of one-sided matches, which might be achieved if players enter the tournament at different stages, according to their ability. Thus, a balanced tournament might be one in which each competitor has the same chance of winning his first match. Finally, an efficient tournament might be one in which the number of games played is just sufficient to estab-lish with some probability the best player, having regard to the expense of a long tournament and the need to provide entertainment for spectators.
Related work
There is a copious literature concerned with tourna-ment design, much of it concerned with the issue of fairness—ensuring that the best player is the player most likely to win and that players progress in the tournament in accordance with their skill (see, eg McGarry and Schutz, 1997; McGarry, 1998). Seeding players entering the tour-nament has attracted much attention (Hwang, 1982). Israel (1982) is one of several authors to point out that seeding may not ensure that the strongest players necessarily do well, though adaptive seeding (modifying seeding after each round of a tournament) may remedy this (Chen and Hwang, 1988;
∗Correspondence: JM Norman, University of Sheffield, 9 Mappin Street,
Sheffield S1 4DT, UK.
E-mail: [email protected]
Glickman, 2007). Appleton (1995) has simulated various tour-nament designs to assess the likelihood of the winner being the best of the entrants. In an analysis of a particular compe-tition, Clarke (1996) shows how different tournament designs can change the winning probabilities of competitors.
The issue of balance has given rise to several papers. Konig (2000) discusses the competitive balance of Dutch soccer. He draws attention to the uncertainty in the outcome of an indi-vidual match and the uncertainty of the outcome of the tourna-ment as a whole, a distinction also made by Scarf and Bilbao (2006). Soccer is in a sense, an unstable game in that because few goals are scored, match results often do not reflect the relative abilities of the two teams taking part (Lundh, 2006). Soccer’s instability in this sense may be contrasted with the stability of racquet sports, where a player with a little more than 50% probability of winning a point may have a high probability of winning the match (Clarke and Norman, 1979). An unbalanced match is of little benefit to players or spec-tators and many tournament organizers arrange for competi-tors to enter at different stages according to their ability. In the FA Cup, the teams in the top three divisions of English football enter only at the third round proper. Perhaps seeding is appropriate only in the later stages of a tournament, when players are of high and near equal ability.
AUTHOR
COPY
SR Clarkeet al—Criteria for a tournament 1671
Szymanski (2003) is concerned with the contribution that economics can make. He remarks that sporting contests are of interest, particularly financial interest, to organizers, competitors and fans and comments that much of the existing literature fails to define the objective of the sporting contest. How well this objective is realized is a measure of a contest’s efficiency.
In the remainder of this paper, we analyse a particular tournament, the annual World Professional Snooker Cham-pionship, and determine how well the criteria of fairness, balance and efficiency are satisfied. The championship, although watched by millions, has attracted little academic attention, apart from Colwell and Gillett (1987) who consider the expected length of the final match of the tournament.
The World Professional Snooker Championship
The championship takes place in the Crucible Theatre in Sheffield each year. A total of 32 players enter the first round proper, half of them the first 16 in the world rankings and the other half qualifiers from a preliminary tournament. The 16 top-ranking players are seeded according to their rankings so that, for example, if the No. 1 player beats his (qualifying) opponent in the first round he will meet in the second round the No. 16 player if the No. 16 player has beaten his own opponent. If the No. 1 player and the No. 2 player continue to win their matches, they will meet at last in the final round. The qualifying entrants are randomly allocated to matches against the 16 top-ranked players. In 2007, there were 85 entrants to the qualifying rounds. Ten competed in the first round, the five winners entering the second round, joining 27 other players. In each of the third, fourth and fifth rounds, 16 players joined the tournament, the winners proceeding to the next round or to the first round of the tournament proper. Players entered these preliminary rounds according to their status in the rankings; the higher their ranking, the later they entered the tournament.
A similar arrangement was followed in the years from 2004 to 2006, though in 2004 with a much larger than usual entry; the first full round had 64 players, who competed among each other to determine 32 entrants to the next round, these winners playing each other to determine who should enter the following round and play 16 entrants from the ranking lists.
In each of the preliminary rounds and in the first round of the tournament proper, the winner is the first to win 10 frames. In the televised rounds, the number of frames in each match has varied over the years. In the 2007 Championship, in the second round and the quarter finals the winner was the first player to win 13 frames, in the semi-finals the first to win 17 frames and in the final the first to win 18 frames.
Players claim that a longer match gives them more chance of showing their superiority and it is true that, other things being equal, a weaker player has a greater chance of winning in a shorter match.
Fairness and balance: the probability of winning a match
In this section, we consider the last three qualifying rounds and the first round of the championship proper, which takes place at the Crucible theatre under television cameras. Thus we consider four rounds in each of 4 years, with 16 matches in each round. Of the 256 matches, however, two were walkovers and one was unfinished, as one of the players withdrew through illness. These three matches have been excluded from the analysis.
For each match we recorded the score of the losing player, the year in which it was played, the round, and whether the match was won or lost by the player entering the tournament in that round, his lower-ranked opponent having qualified by winning his match in the previous round. We also recorded the rank of both players in each match, taken from the ranking lists published at the start of the season. For some players, mostly entering the third round (the first round we consider) as qualifiers, rankings were not available and we assigned to them a rank of 100. All these factors might influence the outcome of a match and because the outcome of a match may be considered to have one of two values (whether it is won or lost by the entering player), a conventional regression approach is inappropriate. An approach is needed that takes account of a categorical dependent variable.
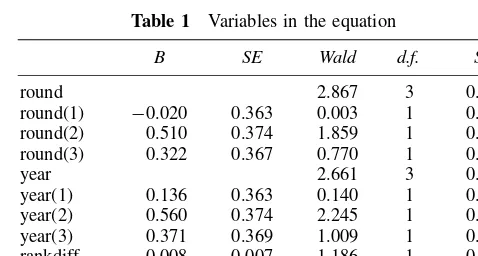
A logistic regression was therefore performed to assess the impact of a number of factors on the likelihood of a new entrant winning his match. The model contained as indepen-dent variables: the year in which the match was played, the round and the difference in rank between the player entering the tournament and his opponent. The full model containing all predictors was not statistically significant and explained less than 1% of the variance of the dependent variable and as shown in Table 1, none of the independent variables made a statistically significant contribution to the model. It seems that a player entering the tournament has about the same proba-bility of winning his first match, whatever the round at which he enters.
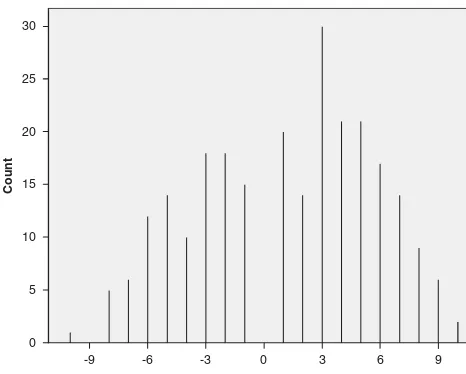
The scores of the 253 matches are shown in the bar chart of Figure 1. The scores (with the score of the entering player given first) are shown in the order 0–10, 1–10, 2–10, . . . ,
Table 1 Variables in the equation
B SE Wald d.f. Sig.
AUTHOR
COPY
1672 Journal of the Operational Research Society Vol. 60, No. 129
Figure 1 Distribution of match scores.
9–10, 10–9, 10–8, 10–7, . . . , 10–0, a ranking from the worst to the best, from losing 10 frames and winning none to winning 10 frames without reply. For simplicity, the various results are shown as ‘points’, a measure of the entering player’s performance. The ‘points’ may be interpreted as net frames (frames won minus frames lost) won by the entering player,
ranging from−10 to+10.
Of the 253 matches, 154 were won and 99 lost by players entering the tournament and playing their first match. Thus we
may take 154/253=0.609 as an estimate of the probability
that a player entering the tournament wins the match. The mean losing score in the 154 matches won by the entering player was 5.63, while the mean losing score in the 99 matches lost by the entering player was 6.17. The difference is not surprising, as we would expect a losing player higher up in the rankings to have a higher score than a losing player lower in the rankings.
Fairness and balance: the probability of winning a frame
If frames are independent, if a player’s chance of winning a
frame ispand if a match is won by the first player to winn
frames, then the probability of the player winning the match
P can be calculated using a negative binomial or binomial
formulation, and is given by
P=
Given a value forPof 0.609, we can find the corresponding
value ofp, using a spreadsheet or a simple computer program
written in BASIC: this turned out to bep=0.531. If a player’s
probability of winning a frame against a certain opponent is
0.531, then his probability of winning a match playing up to 10 is 0.609 and vice versa.
An alternative estimate for p is given by dividing the
number of frames won by the entering player by the total
number of frames played, givingp=2151/4008=0.537. We
note that the average number of frames played in a match is
4008/253=15.8.
Independence of frames within matches and independence between matches
Players take turns taking the opening shot of each frame, so the hypothesis that frames have independent outcomes is at least plausible. Using a spreadsheet or another related simple BASIC program, it is easy to calculate the probability that
a player entering the tournament will score 0,1,2,3. . .9
frames if he loses the match, and the probability that his
opponent will score 0,1,2,3. . .9 frames if he wins it. These
probabilities can be used to determine the expected number of scores (out of 253) of the losing player of the 154 matches in which the entering player wins and the 99 matches in which he loses. The expected numbers of scores are shown in Table 2, along with the actual numbers. The entering (higher-ranked) player’s score comes first.
The 5% chi-square critical value on 13 degrees of freedom is 22.362, so the total contribution to chi-square of 29.1 is clearly significant. The major contribution to chi-square occurs at the low scores in matches won by the player entering the tournament. Perhaps players faced with an opponent above them in the rankings give up hope of winning the match too quickly.
Table 2 Actual and expected numbers of scores
Score Actual Expected Contribution to2
AUTHOR
COPY
SR Clarkeet al—Criteria for a tournament 1673
Efficiency: how many frames are needed in a match?
As mentioned above, players may reasonably claim that a longer match gives them more chance to show their superiority over a weaker player. Equation (1) may be used to determine how long a match needs to be to give a specified probability of winning the match to a player with a specified probability of winning a frame. The analysis reported in Table 2 shows that the assumptions of independence between frames and a constant probability of winning each frame do not hold. Nevertheless, we may use Equation (1) to give useful, if only approximate, results.
Where the match is won by the first player to winNframes,
Table 3 shows the minimum value of Nto ensure a player
whose probability of winning a frame is phas a probability
of at leastPof winning the match.
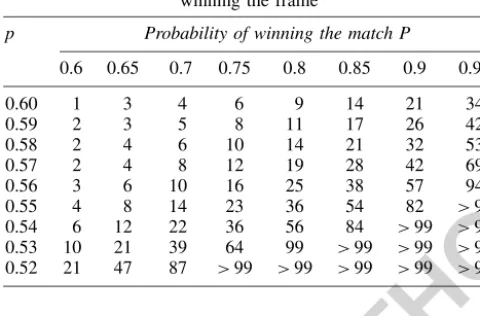
Table 3 Number of frames required to ensure certain probabilitiesPof winning the match for given probabilitiespof
winning the frame
p Probability of winning the match P
0.6 0.65 0.7 0.75 0.8 0.85 0.9 0.95 0.60 1 3 4 6 9 14 21 34 0.59 2 3 5 8 11 17 26 42 0.58 2 4 6 10 14 21 32 53 0.57 2 4 8 12 19 28 42 69 0.56 3 6 10 16 25 38 57 94 0.55 4 8 14 23 36 54 82 >99 0.54 6 12 22 36 56 84 >99 >99 0.53 10 21 39 64 99 >99 >99 >99 0.52 21 47 87 >99 >99 >99 >99 >99
From this table, we may note that in a first-to-ten frames match a player whose probability of winning a frame is 0.53 has a probability 0.60 of winning the match and a player whose probability of winning a frame is 0.56 has a probability 0.70 of winning the match and so on.
Concluding remarks
In the championship, there are relatively few one-sided matches, as can be seen in Figure 1 and because of the way in which players enter the tournament at different stages according to their position in the rankings, it may be argued that the tournament gives the better players a better chance of winning.
It is perhaps surprising that the probability of winning a match is roughly constant for the player entering the tourna-ment, whatever the round at which he enters. This suggests that the gradation of ability in the rankings is gradual and that there are not marked changes in the ability of players close to each other on the rankings. The rankings are fixed for a whole year, following the results of the World Cham-pionship, and are determined by points awarded to players
according to their progress in specific tournaments. The fore-going comments suggest that the rankings are a stable measure of players’ ability.
Determining the number of frames in a match requires a balance between the need to give the better player an appro-priate chance of winning and the need to keep matches short. In 2008 the qualifying rounds will take place in Prestatyn over 8 days and later in Sheffield over 4 days. Large crowds are not drawn to these qualifying rounds and the halls where the matches are played have to be paid for. Perhaps playing first-to-ten frames in a match, presumably arrived at through experience, is a good compromise, as indeed an inspection of the table above might suggest. Finally, particularly in the tele-vised section of the championship, there needs to be a limit to the advantage given to the better player: the audience, both in the Crucible and watching at home, will want to give the underdog a sporting chance.
References
Appleton DR (1995). May the best man win? Statistician 44(4): 529–538.
Chen R and Hwang FK (1988). Stronger players win more balanced knockout tournaments.Graphs and Combinatorics4: 95–99. Clarke SR (1996). Calculating premiership odds by computer—An
analysis of the AFL final eight playoff system.Asia-Pacific J Opl Res13: 89–104.
Clarke SR and Norman JM (1979). Comparison of North American and international squash scoring systems—Analytical results.Res Quart50(4): 723–728.
Colwell DJ and Gillett JR (1987). The expected length of a tournament final.Math Gazette71: 129–131.
Glickman ME (2007). Bayesian locally-optimal design of knockout tournaments. Presented at the International Conference on Advances in Interdisciplinary Statistics and Combinatorics, University of North Carolina, Greenboro.
Hwang FK (1982). New concepts for seeding knockout tournaments. Am Math Month89: 235–238.
Israel RB (1982). Stronger players need not win more knockout tournaments.J Am Stat Assoc76: 950–951.
Konig RH (2000). Competitive balance in Dutch soccer.J Roy Statist Soc Ser D49: 419–431.
Lundh T (2006). Which ball is the roundest—A suggested tournament stability index.J Quant Anal Sports2(3): 1–21.
McGarry T (1998). On the design of sports tournaments. In: Bennett J (ed).Statistics in Sport. Edward Arnold: London, 199–217. McGarry T and Schutz RW (1997). Efficacy of traditional sport
tournament structures.J Opl Res Soc48: 65–74.
Percy DF (2007). A mathematical analysis of badminton scoring systems. J Opl Res Soc, 7 November 2007. Advance online publication doi:10.1057/palgrave.jors.2602528.
Scarf P and Bilbao M (2006).The optimal design of sporting contests. Salford Business School Working Paper 320/06.
Schutz RW (1970). A mathematical model for evaluating scoring systems with special reference to tennis.Res Quart41: 552–561. Szymanski S (2003). The economic design of sporting contests. J
Econ Lit41: 1137–1187.