Global Change and Terrestrial Ecosystems Network of Ecosystem Warming Studies (GCTE-NEWS): Richard Alward, University of Nebraska, USA; Claus Beier, RISO National Laboratory, Denmark; Scott Bridgham, University of Notre Dame, USA; Indy Burke, University of Colorado, USA; Josep Canadell, CSIRO – Wildlife and Ecology, Australia; Terry Callaghan, Sheffield Centre for Arctic Ecology, UK; Torben R. Christensen, Lund University, Sweden; Sara Duke, University of Utah, USA; Jace Fahnestock, University of Wyoming, USA; Ivan Fernandez, University of Maine, USA; John Harte, University of California at Berkeley, USA; Greg Henry, University of British Columbia, Canada; Robert Hollister, Michigan State University, USA; John Hom, USDA Forest Service, USA; Phil Ineson, Merlewood Research Station, UK; Mark G. Johnson, U.S. Environmental Protection Agency, USA; Sven Jonasson, University of Copenhagen, Denmark; John Lee, Sheffield Centre for Arctic Ecology, UK; Sune Linder, Swedish University of Agricultural Sciences, Sweden; Anna Lukewille, Norwegian Institute for Air Research, Norway; Greg Masters,
CABI Bioscience, UK; Jerry Melillo, The Ecosystem Center, Marine Biological Laboratory at Woods Hole, USA; Anders Mickelsen, University of Copenhagen, Denmark; Chris Neill, The Ecosystem Center, Marine Biological Laboratory at Woods Hole, USA; David M. Olszyk, U.S. Environmental Protection Agency, USA; Malcolm Press, Sheffield Centre for Arctic Ecology, UK; Kurt Pregitzer, Michigan Technological University, USA; Clare Robinson, University of London, UK; Paul T. Rygiewiez, U.S. Environmental Protection Agency, USA; Osvaldo Sala, Universidad de Buenos Aires, Argentina; Inger K. Schmidt, University of Copenhagen, Denmark; Gus Shaver, The Ecosystem Center, Marine Biological Laboratory at Woods Hole, USA; Ken Thompson, Buxton Climate Change Impacts Laboratory, UK; David T. Tingey, U.S. Environmental Protection Agency, USA; Paul Verburg, Desert Research Institute, USA; Diana Wall, Colorado State University, USA; Jeff Welker, University of Wyoming, USA; Richard Wright, Norwegian Institute for Water Research, Norway
Abstract Climate change due to greenhouse gas emis-sions is predicted to raise the mean global temperature by 1.0–3.5°C in the next 50–100 years. The direct and indirect effects of this potential increase in temperature on terrestrial ecosystems and ecosystem processes are likely to be complex and highly varied in time and space. The Global Change and Terrestrial Ecosystems core project of the International Geosphere-Biosphere Programme has recently launched a Network of Ecosystem Warming Studies, the goals of which are to integrate and foster research on ecosystem-level effects of rising temperature. In this paper, we use meta-analysis to synthesize data on the response of soil respiration, net N mineralization, and aboveground plant productivity to experimental ecosystem warming at 32 research sites representing four broadly defined biomes, including high (latitude or altitude) tundra, low tundra, grassland, and forest. Warming methods included electrical heat-resistance ground cables, greenhouses, vented and unvented field chambers, overhead infrared lamps, and passive night-time warming. Although results from individual sites showed considerable variation in response to warming, results from the meta-analysis showed that, across all sites and years, 2–9 years of experimental warming in L.E. Rustad (
✉
) · J.L. CampbellNortheastern Research Station, USDA Forest Service, Durham, NH 03824, USA
e-mail: [email protected] Fax: +1-310-3771460 G.M. Marion
Desert Research Institute, 2215 Raggio Parkway, Reno, NV 89512, USA
R.J. Norby
Oak Ridge National Laboratory, Building 1059, MS 6422, Oak Ridge, TN 37831-6422, USA
M.J. Mitchell
SUNY – College of Environmental Science and Forestry, Syracuse, NY 13210, USA
A.E. Hartley
The Ecosystems Center, Marine Biological Laboratory, Woods Hole, MA 02543, USA
J.H.C. Cornelissen
Sheffield Centre for Arctic Ecology,
Department of Animal and Plant Sciences, The University, Sheffield S10 2TN, UK
J. Gurevitch
Department of Ecology and Evolution, SUNY – Stony Brook, Stony Brook, NY 11794-5245, USA
DOI 10.1007/s004420000544
L.E. Rustad · J.L. Campbell · G.M. Marion R.J. Norby · M.J. Mitchell · A.E. Hartley
J.H.C. Cornelissen · J. Gurevitch · GCTE-NEWS
A meta-analysis of the response of soil respiration,
net nitrogen mineralization, and aboveground plant growth
to experimental ecosystem warming
the range 0.3–6.0°C significantly increased soil respira-tion rates by 20% (with a 95% confidence interval of 18–22%), net N mineralization rates by 46% (with a 95% confidence interval of 30–64%), and plant produc-tivity by 19% (with a 95% confidence interval of 15–23%). The response of soil respiration to warming was generally larger in forested ecosystems compared to low tundra and grassland ecosystems, and the response of plant productivity was generally larger in low tundra ecosystems than in forest and grassland ecosystems. With the exception of aboveground plant productivity, which showed a greater positive response to warming in colder ecosystems, the magnitude of the response of these three processes to experimental warming was not generally significantly related to the geographic, climatic, or envi-ronmental variables evaluated in this analysis. This underscores the need to understand the relative impor-tance of specific factors (such as temperature, moisture, site quality, vegetation type, successional status, land-use history, etc.) at different spatial and temporal scales, and suggests that we should be cautious in “scaling up” responses from the plot and site level to the landscape and biome level. Overall, ecosystem-warming experiments are shown to provide valuable insights on the response of terrestrial ecosystems to elevated temperature.
Keywords Global warming · Meta-analysis · Soil respiration · Nitrogen mineralization · Plant productivity
Introduction
Atmospheric concentrations of CO2, CH4, and N2O have increased dramatically since the beginning of the industrial revolution largely due to human activities such as fossil fuel combustion and land-use change [Intergovernmental Panel on Climate Change (IPCC) 1996]. These gases have the capacity to trap heat in the atmosphere by absorbing infrared radiation reflected by the earth’s surface. Considerable evidence is now available showing that greenhouse gases have increased the global mean surface temperature by 0.3–0.6°C over the last century (IPCC 1996; Rind 1999; Karl et al. 2000). Current predictions based on general circulation models indicate that the mean global temperature will increase by an additional 1–3.5°C in the next 50–100 years, with greater warming occurring at higher latitudes (IPCC 1996).
Temperature is a key factor that regulates many terrestrial biogeochemical processes, such as soil respira-tion (Raich and Schlesinger 1992), litter decomposirespira-tion (Meentemeyer 1978; Jansson and Berg 1985; Hobbie 1996), N mineralization and nitrification (MacDonald et al. 1995), denitrification (Malhi et al. 1990), CH4emission (Crill et al. 1988; Crill 1991; Johnson et al. 1996), fine root dynamics (Boone et al. 1998; Pregitzer et al. 2000; Gill and Jackson 2000), plant productivity (Warren-Wilson 1957), and plant nutrient uptake (BassiriRad et al. 2000). Despite the relatively robust literature on the response of individual ecological processes to changing
temperature, a comprehensive understanding of whole ecosystem response to global warming remains elusive. For example, it is not clear which processes will be most affected by warming. How will the relative sensitivity of ecosystem respiration and photosynthesis affect net eco-system C balance? What will control or limit the magni-tude of these responses? Will the response remain constant over time? What types of ecosystems will be most affected? Will higher latitude or higher altitude ecosystems be affected more than equatorial or lower alti-tude ecosystems? Is the response linear with increasing temperature, curvilinear, humped, or is it a step function? Recently, Shaver et al. (2000) proposed a conceptual model of ecosystem response to global warming. A key element of this model is that, on a global scale, ecosystem response to elevated temperature will be more varied in time and space than the response to elevated CO2. This is because of the greater spatial and temporal variations in the projected temperature increase compared to the rela-tively uniform and continued increase in atmospheric CO2, the multitude of interacting direct and indirect physi-cal, biologiphysi-cal, and chemical processes that will potentially be affected by temperature, and the variable time scale of response to temperature of different ecosystem compo-nents. Shaver et al. (2000) also postulated that ecosystem response would be strongly affected by initial conditions, such as stocks and initial turnover rates of labile soil C and N, the relative size of the plant and soil C pools, the dominant form of available N in the soil, the soil water and precipitation regimes, the chemical composition and turnover rates of plant residues, and the longevity of indi-viduals and population turnover rates of dominant species. More research on ecosystem response to elevated temper-ature is clearly needed to validate and refine this conceptual model of ecosystem response to global warming.
Over the last 5–10 years, as predictions of global warming have become more widely recognized and accepted, the need for information on the response of eco-systems to changing temperature has been addressed by a growing number of temperature-manipulation experiments initiated around the world. These experiments have shown that rates of soil respiration generally increase with warmer temperatures (Peterjohn et al. 1993, 1994; McHale et al. 1998; Rustad and Fernandez 1998a), but the response to warming of other ecosystem processes has been more variable, and general response patterns have been difficult
to identify. For example, litter decomposition, CH4
As some of these experiments are nearing completion, and others are being planned, there is a clear need to synthesize the existing data on ecosystem response to experimental warming in order to understand differences in response to date, to develop and refine current con-ceptual and quantitative frameworks for evaluating the response of ecosystems to elevated temperature, and to provide direction for future work in this relatively new field. Meta-analysis is a technique developed specifically for the statistical synthesis of independent experiments (e.g., Cooper and Hedges 1994; Gurevitch and Hedges 1999). Although meta-analysis has generally been applied to the analysis of data gathered from published literature, it is also well suited for combining the results of experi-ments carried out by individual researchers (e.g., Hechtel and Juliano 1997) or by networks of research groups (e.g., Arft et al. 1999; Gurevitch et al. 2000). Formal meta-analysis statistical techniques have numerous advan-tages over older approaches to quantitative data synthesis, such as “vote counting”, and have increasingly been used in the ecological literature (e.g., Hedges and Olkin 1985; Gurevitch et al. 1992; Arnqvist and Wooster 1995; Gurevitch et al. 2000). Arft et al. (1999), for example, recently used meta-analysis to synthesize data from 13 circumpolar ecosystem warming research sites associated with the International Tundra Experiment (ITEX). All these sites used a common design of an open top chamber (Marion et al. 1997) and common protocols (Molou and Mølgaard 1996). Results from the ITEX synthesis showed a significant positive aboveground plant growth response to warming (Arft et al. 1999).
In the present paper, we use meta-analysis to synthe-size data on the response of three critical ecosystem processes – soil respiration, net N mineralization, and aboveground plant productivity – to experimental eco-system warming at 32 research sites representing four broadly defined biomes, including high (latitude or
alti-tude) tundra, low tundra, grassland, and forest. Warming was accomplished using electrical heat-resistance ground cables, greenhouses, vented and unvented field chambers, overhead infrared lamps, and night-time warming. Due to logistical, scientific, and financial constraints, and because the goals and study designs differed among investigations, all three processes were not measured in each experiment. Meta-analysis, however, provides us with a tool to evaluate data from a range of sites, and ask questions relative to the effects of increasing temperature on nutrient cycling and C uptake and release. These questions had been addressed previously in part by the ITEX synthesis. However, this analysis differs from the ITEX synthesis by the inclusion of belowground eco-system processes, and the evaluation of ecoeco-system response in a wider range of biomes over longer time periods, using a variety of experimental methods.
In evaluating the data in this synthesis, we hypothe-sized that increasing air and/or soil temperature in the range of ~1–5.0°C would increase rates of soil organic matter decomposition (as reflected by increased rates of soil respiration) and net N mineralization, resulting in greater nutrient availability, and consequently more rapid plant growth and greater net primary productivity (NPP). We also hypothesized that ecosystems would be more sensitive to warming at higher latitudes, because higher latitude ecosystems are typically strongly limited by both temperature and nutrients (Bliss et al. 1981; Chapin 1983; Chapin and Shaver 1985).
Methods
Experimental sites
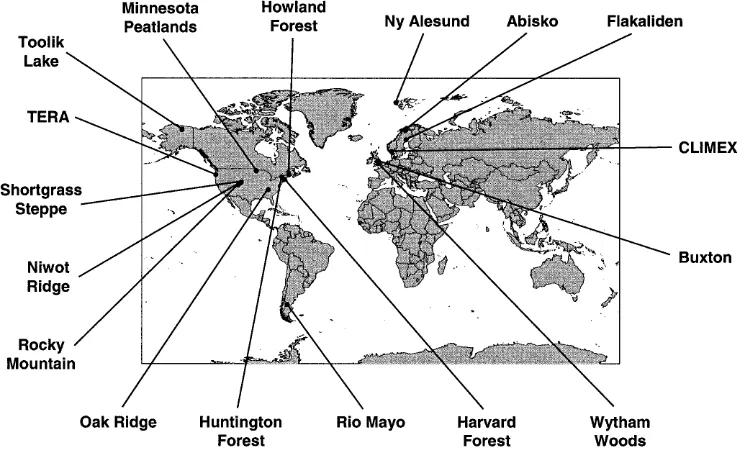
The data for this analysis came from 32 ecosystem warming experiments located from ~35–79°N latitude, with an additional site at 45°S latitude (Fig. 1). Experiments ranged in duration from Fig. 1 The Global Change and
2 to 9 years (many are ongoing). Mean annual air temperatures ranged from –9 to 14°C; mean annual precipitation ranged from 150 to 1400 mm, and length of the growing season ranged from 71 to 365 days. Additional site characteristics are given in Appendix 1. Although initiated independently and in various stages of comple-tion, all sites are part of the Global Change in Terrestrial Ecosystem (GCTE) Network of Experimental Warming Experiments (NEWS), a new initiative designed to integrate and foster research on ecosystem-level effects of rising temperature.
Each site was classified as either high (latitude or altitude) tundra (n=3), low tundra (n=14), forest (n=9), or grassland (n=6) based on latitude, mean annual temperature, mean annual precipi-tation, and dominant vegetation. A North American temperate peat bog was classified as low tundra because of similarities in vegeta-tion and soil to other low tundra sites. Vegetavegeta-tion at each site was also classified more generally as predominately woody (n=16) or non-woody (n=16). Heating was accomplished using electrical heat-resistance ground cables (n=10), vented and unvented field chambers (n=13), greenhouses (n=3), overhead infrared lamps (n=5), and night-time warming (n=1). Heating occurred either all year (n=9), during the snow-free months only (n=21), or during the winter months only (n=2).
Data collection
For each site, data were available on a variety of parameters designed to describe the general geography, climate, and environ-ment. Not all data were available from all sites. Geographic parameters included latitude and longitude; climatic data included long-term mean annual and growing season temperature, mean annual and growing season precipitation, and average length of the growing season; environmental data included dominant vegetation type, stand age, successional status, soil classification, soil texture, upper organic and mineral soil C, N, pH, and bulk density, upper organic soil horizon thickness, and foliar N of one or more species. In addition, several climatic indices were calculated for temperature, precipitation, and combined temperature and precipi-tation as follows:
Tindex=1/1+exp(1.315–0.119×mean annual air temperature) Pindex=1-exp(-0.000664×mean annual precipitation) PTindex1=min(Tindex, Pindex)
PTindex2=Tindex×Pindex
The Tindex and Pindex are based on the Miami model of relation-ships between NPP and climate (Lieth 1975). Tindex1 and PTindex2 are two approaches to combining the influences of temperature and precipitation. The first, which chooses the mini-mum of Tindex and Pindex, assumes that NPP is controlled by the more limiting factor, whereas PTindex2 assumes an interactive influence of precipitation and temperature.
Experimental response data included mean annual or seasonal air and soil temperature (C), soil moisture (g H2O g–1 dry soil),
rates of soil respiration (mg CO2-C m–2h–1), net N mineralization
(g N m–2year–1) and aboveground plant productivity for treatment
and control plots for each year of the experiments. The response of soil moisture to the treatments was evaluated to better under-stand the response of soil respiration, N mineralization, and plant growth to warming. Treatment effects on soil moisture were not interpreted to reflect future climate scenarios as changes in soil moisture will likely be more dependent on future precipitation patterns, which are expected to vary considerably by region (ICPP 1996). A measure of air or soil temperature was available for all sites, and gravimetric soil moisture data were available for 14 of the 32 sites. Soil respiration data were available for 17 of the 32 sites. In all cases, soil respiration was measured as the efflux of CO2from the soil surface, and represented the combined respiration of soil micro- and macro-organisms and plant roots. In some cases, respiration of surface vegetation such as mosses was unavoidably included. Soil respiration was measured with static closed chambers (Rochette et al. 1992) at 14 sites, dynamic flow-through chambers (Rochette et al. 1992) at two sites, and soda lime (Edwards 1975) at one site. Net N mineralization data were
available for 12 of the 32 sites for the uppermost organic soil hori-zon. Because net N mineralization in the mineral soil was only measured at two of the 32 sites, these data were not included in the analysis. All ensuing references to net N mineralization are thus for the upper organic soil horizon only. Net N mineralization was measured at all sites as the change in inorganic N (NO3+NH4) over the growing season or year using in situ incubation of soils in buried bags (Eno 1960), with incubation periods ranging from 4 to 12 weeks. Net N mineralization rates expressed on a per gram of dry soil basis were converted to g N m–2year–1using bulk density
measurements from each site. For aboveground plant productivity, we used direct estimates of NPP (annual production of biomass and litter per unit ground area) when data were available. At the Buxton Climate Change Impacts Laboratory and Wytham Woods, productivity was based on leaf area index, which has been shown to scale linearly with aboveground biomass (Hobbie et al. 1999). In expanding woody systems (Oak Ridge National Laboratory and Flakaliden), annual productivity in a given year was strongly influenced by the size of the standing crop and thus by conditions in previous years. These data were converted to relative production by dividing annual production by standing biomass at the beginning of the year. Altogether, indices of aboveground plant productivity were available for 20 of the 32 sites.
Meta-analysis
Meta-analysis was used to analyze the response of soil respiration, net N mineralization, and aboveground plant productivity to experimental warming. Meta-analysis requires the distillation of the results of each experiment in the form of a measure of the magnitude of the effect in that experiment, or the “effect size”, expressed on a common scale across studies. Here, the effect size summarizes the magnitude of the response of soil respiration, net N mineralization, and aboveground plant productivity to the warming treatment. There are various choices of effect size indices. We chose to use the “Hedges’ d index”, or standardized mean difference, which is calculated as:
where X–eis the mean of the experimental group, X–cis the mean of the control group, s is the pooled standard deviation, and J is a factor that corrects for small sample bias (Hedges and Olkin 1985; Rosenberg et al. 1997). An effect size (d) not significantly differ-ent from zero indicates no experimdiffer-ental effect, and effects sizes of 0.2, 0.5, and 0.8 or greater indicate small, medium, and large ds, respectively (Cohen 1969). Values above 0 indicate that the experi-ment had a positive effect on the variable; values below 0 indicate a negative effect.
The variance around d was calculated with standard methods, and used to determine weighted average effects across studies and the confidence intervals around those effects (Hedges and Olkin 1985; Rosenberg et al. 1997). Temporal response patterns were evaluated by categorizing the data by year. Because the results for different years in a site are not independent of one another, we then calculated a single average value across all years for each site for each of the plant and soil responses to warming. We calculated this average d across years and its variance for each site in the same way as averaging ds across studies, as the weighted average Hedges’ d and variance for Hedges’ d (e.g., Hedges and Olkin 1985). These average ds across years were then used in all subsequent analyses. We tested for agreement or disparity among categories of studies (e.g., among biomes) using a mixed model and parametric tests of homogeneity (Hedges and Olkin 1985; Rosenberg et al. 1997). Categories of studies had to include two or more sites to be included in the analysis. In some cases, the hypothesized explanatory variables were continuous rather than categorical. For the analysis of continuous data in the meta-analysis, we used weighted regressions and tested whether the slopes differed from zero using a parametric mixed model approach (Rosenberg et al. 1997; Hedges and Olkin 2000). Mean differences in rates of soil respiration, net N mineralization, Hedges’ =d X X
s J
and plant productivity between the heated plots compared to the control plots were calculated as a weighted average (calculated as a back-transformed natural logarithm response ratio; Hedges and Olkin 2000). All meta-analyses were run using MetaWin 2.0, a statistical software package for meta-analysis (Rosenberg et al. 1997).
Standard unweighted statistical analyses
In addition to using meta-analysis to evaluate the outcome of experimental warming across sites, we also used standard unweighted regression analysis to investigate the relationships between soil respiration and net N mineralization rates in the control plots and latitude, mean annual and growing season temperature and precipitation, length of the growing season, foliar N, and forest floor C, N, C/N, and pH. All unweighted (standard linear regression) analyses were run using SAS (SAS 1995).
Results
Temperature and moisture
The mean experimental increase in soil temperature across all 32 studies was 2.4°C, with a range of
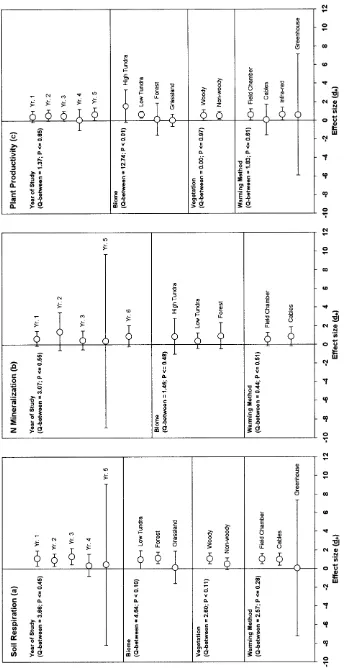
0.3–6.0°C. The response of soil moisture to this exper-imental increase in temperature was measured at 14 of the 32 sites. Results showed that soil moisture was significantly lower in the heated plots compared to the controls at nine sites, significantly higher in the heated plots compared to the controls at one site, and showed no significant change at four sites (Fig. 2a). The higher soil moisture in the heated plots compared to the control plots was typically due to pre-existing conditions. The overall grand mean effect size (d++) for the response of soil moisture to warming was –0.67, which indicated that across all sites for which we had data, soil moisture was significantly lower in the heated plots than the control plots.
Soil respiration
Mean rates of soil respiration in the control plots ranged from a low of 0.4 mg CO2-C m–2h–1at the high latitude Ny Alesund site in Svalbard, Norway to a high of
687 mg CO2-C m–2 h–1 at the Shortgrass Steppe-day
warming site in Colorado, USA, with a mean rate across all sites of 130 mg CO2-C m–2 h–1 (Table 1). When the Oak Ridge National Laboratory site was excluded from the analysis as an outlier, (due to the exceptional combina-tion of relatively high mean growing season temperature Fig. 2 Mean effect sizes (d; open circle) and 95% confidence
Table 1 Mean soil respiration rates for control and heated plots; mean delta soil temperature; mean upper organic horizon N, C and C:N; and mean foliar N at 17 experimental
ecosystem warming sites. na Not available
Site Mean soil Mean soil Data from Mean ▲▲ Mean upper Mean upper Mean Mean Species for foliar N
respiration control respiration heated the following soil organic organic upper organic foliar (mg CO2-C m–2 h–1) (mg CO
2-C m–2 h–1) years of the temperature horizon N horizon C horizon N (%)
experiment (°C) (%) (%) C:N
Abisko Nature Reserve, e.s.l. 450 m, 223.0 299.0 7 1.3 1.7 40 24 2.1 Vaccinium uliginosum
high heat study
Harvard Forest 114.0 143.0 1–5 5.1 1.7 39 24 1.7 Acer rubrum
Howland Forest 35.0 43.0 1–3 4.3 1.0 42 42 1.1 Picea rubens
Huntington Wildlife Forest, 72.0 105.0 1–2 2.6 na na na 2.4 Fagus grandifolia
2.5°C study
Huntington Wildlife Forest, 72.0 98.0 1–2 4.8 na na na 2.4 Fagus grandifolia
5.0°C study
Huntington Wildlife Forest, 72.0 82.0 1–2 6.0 na na na 2.4 Fagus grandifolia
7.5°C study
Niwot Ridge 65.0 77.0 3 2.3a na na na 2.2 Dryas octopetala
Ny Alesund 0.4 0.3 4 0.3 8.8 3 0 1.8 Dryas octopetala
Oak Ridge National Laboratory 28.0 30.0 3 1.6 na na na 2.1 Acer saccharum
Rio Mayo 9.0 13.0 1–3 1.9a na na na 0.6 Stipa sp.
Rocky Mountain Biological 193.0 179.0 4–5 1.2 na na na 2.0 Artemisia tridentata
Laboratory
Shortgrass Steppe – 687.0 890.0 1 4.0b na na na na na
day-time warming
Shortgrass Steppe – 304.0 366.0 2 0.7 0.2 1 7 1.5 Bouteloua gracilis
night-time warming
TERA 138.0 201.0 2 1.5 0.9 37 41 0.8 Pseudotsuga menziesii
Toolik Lake – wet sedge study 36.0 36.0 6 3.2 2.0 34 17 1.7 Carex rotundata
Toolik Lake – dry heath study 55.0 78.0 2–4 1.5 na na na na na
Toolik Lake – moist tussock study 103.0 124.0 2–4 1.5 na na na na na
and relatively low soil respiration related to low root density in the experimental field chambers), conventional (unweighted) linear regression showed a significant positive relationship between mean rates of soil respira-tion in the control plots and mean growing season temperature (r2=0.45, P<0.012). No other significant relationships were observed between soil respiration in the control plots and any of the other climatic or environ-mental variables evaluated in this analysis.
Mean d for individual sites ranged from a low of –0.8 at the Rocky Mountain Biological Laboratory (RMBL) site in Colorado, USA to a high of 13.3 at the Shortgrass Steppe-nightwarming (SGS-NW) site also in Colorado, USA (Fig. 2b; note, SGS-NW is not shown and was excluded from subsequent analyses because the mean d and variance for this site was over 6 times greater than for any other site, and thus SGS-NW was considered an outlier). The results appeared diverse when sites were examined individually: warming increased soil respira-tion at 11 of the 17 sites for which data were available, decreased soil respiration at one of the 17 sites, and had no effect on soil respiration at five of the 17 sites (Fig. 2b). However, d++ across all sites was 0.80, which was a large and statistically significant response to warming (Fig. 2b). Thus, across all sites, experimental warming significantly increased rates of soil respiration. The weighted mean increase in soil respiration in response to warming was 20% (with a 95% confidence interval of 18–22%), which corresponds to a mean increase of 26 mg CO2-C m–2h–1.
The temporal pattern of response was investigated by grouping the data by year of study. Non-significant
Q-between values indicated no significant differences in
soil respiration response to warming among the years of study (Fig. 3a). However, a trend for a decrease in the magnitude of response was suggested by large and statisti-cally significant positive effect sizes for year 1 (mean delta soil respiration=52 mg CO2-C m–2 h–1; d
+=1.29),
year 2 (mean delta soil respiration=23 mg CO2-C m–2
h–1; d
+=0.93), and year 3 (mean delta soil
respira-tion=14 mg CO2-C m–2 h–1; d
+=1.30), in contrast with small, non-significant effect sizes for year 4 (mean delta soil respiration=10 mg CO2-C m–2 h–1; d
+=0.37), and year 5 (mean delta soil respiration=9 mg CO2 m–2 h–1;
d+=0.46). This suggests that the response of soil respira-tion to warming may have been greater in the initial 3 years following treatment initiation than in later years. Results from the nine individual sites with 2 or more years of data showed a decline in soil respiration at four of the sites, and no trend at five of the sites.
Overall, effect sizes for the three biomes for which data were available (low tundra, forest, and grassland) were marginally different from each other at the 0.10 level (Fig. 3a). The high tundra biome was excluded from the analysis because there was only one high tundra site with soil respiration data. Effect size was greatest for the forest sites (d+=1.15) followed by the low tundra sites (d+=0.98), both of which were significantly greater than zero. Effect size for the grassland sites (d+=0.14)
was small and non-significant. Similarly, effect sizes for the woody and non-woody sites were marginally differ-ent from each other at the 0.11 level (Fig. 3a). The effect
size for the woody sites was large (d+=1.11) and was
significantly greater than zero, whereas effect size for
the non-woody sites (d+=0.51) wasnot significantly
different from zero (Fig. 3a).
The effect of the method used to warm the treatment plots on d was evaluated by grouping the data by warming methods. Non-significant Q-between values indicated that there were no detectable differences among the three warming methods for which data were available (field chambers, cables, and greenhouses; Fig. 3a). Effect sizes, however, were larger and were significant for the
field chamber and cable studies (d+=1.08 and 1.02,
respectively), whereas effect size was smaller and non-significant for the greenhouse studies (d+=0.10).
Although soil respiration exhibited a strong positive response to warming across all the experimental sites, meta-analytic weighted regression analyses showed that the magnitude of d was largely independent of the geo-graphic, climatic, and environmental factors evaluated in this study (Table 2). The only exceptions were length of the growing season which showed a slight but significant positive correlation with the magnitude of the response of soil respiration to warming (P<0.002), and upper organic horizon N concentration which showed a slight negative correlation with the magnitude of soil respira-tion response to warming (P<0.04) (Table 2). The nega-tive correlation between upper organic soil horizon N concentration and d, however, was driven entirely by the high N (8.8%) combined with the negative d (–0.38) reported for the NY_AL site. In this polar semi-desert site, upper organic soil horizon N concentrations were based only on the organic soil under vegetated parts, which covered less than 50% of the plot, and upper organic soil horizon N on a whole plot basis (including bare mineral soil) would have been below 4%. No signifi-cant relationship between d and upper organic soil horizon N concentration was observed when this site was removed from the analysis. Finally, the magnitude of the increase in soil respiration was independent of the delta soil temperature, which was calculated as the mean temperature in the heated plots minus the mean tempera-ture in the control plots.
Net N mineralization
Mean rates of net N mineralization in the upper organic soil horizon in the control plots ranged from a low of
0.02 g N m–2 year–1 at the Abisko MBL OTC site in
Pindex (r2=0.68; P<0.0009), Tindex (r2=0.39; P<0.0313), and PTindex2 (r2=0.65; P<0.0016). Mean net N mineral-ization also showed a trend of increasing rates with increasing mean annual temperature (r2=0.29; P<0.0738)
and mean measured soil temperatures (r2=0.30;
P<0.0678). A significant negative relationship was
observed between mean net N mineralization and latitude (r2=0.47; P<0.0133).
Mean ds for individual sites ranged from a low of –0.44 at the ABMBLO site in Sweden to a high of 1.62, at the nearby Abisko fellfield low heat site (AB1150LO) (Fig. 2c). As shown for soil respiration, the results at first appear to be contradictory: warming increased rates of net N mineralization at seven of the 12 sites for which data were available, decreased rates of net N mineraliza-tion at one of the 12 sites, and had no effect on net N mineralization at four of the 12 sites (Fig. 2c). However, there was a large and statistically significant effect of warming on net N mineralization when averaged across all sites. The general mean effect size (d++) was 0.71, indicating that, on average across all experiments, warming increased rates of net N mineralization (Fig. 2c). The weighted mean increase in net N mineralization due to warming was 46% (with a 95% confidence interval of 30–64%) or 0.48 g N m–2year–1.
While there was a strong and statistically significant overall effect of warming on rates of net N mineralization, no significant differences were found among classes when the data were grouped by year of study, biome (high tundra, low tundra, forest), or warming method (field chambers, cables) (Fig. 3b). In some cases there were confounding effects among classes. For example, the comparison of field chambers versus cables was largely a comparison of tundra field chambers versus forest cables. Differences between vegetation types could not be evaluated because we had only one non-woody site. With one exception, meta-analytic weighted regression analyses showed no significant relationships between the magnitude of d and the geographic, climatic
and environmental factors, or between the magnitude of
d and delta soil temperature (Table 2). The exception
was a significant positive relationship between net N mineralization and growing season precipitation (P<0.009).
Aboveground plant productivity
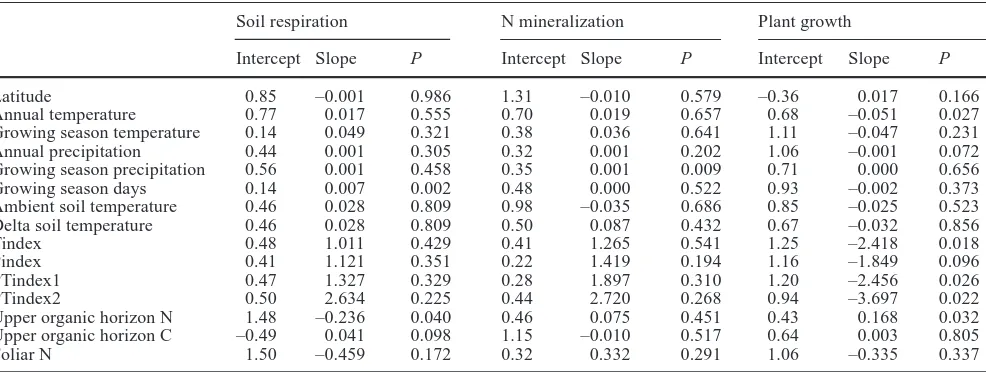
Aboveground plant productivity responses to warming were more variable than results for either soil respiration or net N mineralization, partly because of the different units in which it was measured. Furthermore, some of the sites had increasing plant biomass and increasing primary production among years while others were more mature sites, and had more uniform plant biomass and relatively constant annual productivity. Thus, it is not meaningful to present an overall mean value for plant productivity or the absolute response to warming in these experiments, or to regress plant growth on the geo-graphic, climatic and environmental variables. However, because the raw data were converted to best represent the relative response of annual plant productivity to warming on a common scale, these responses could be compared across sites with meta-analysis. Mean ds for individual sites ranged from a low of –1.24 at the TERA site in Oregon, USA to a high of 2.50 at the Abisko fell-field high heat site in Sweden (Fig. 2d). As for the other response variables, there was a diversity of responses among sites, with experimental warming increasing plant productivity at 13 of the 20 sites for which data were available, decreasing plant productivity at two of the 20 sites, and having no significant effect on plant productivity at five of the 20 sites (Fig. 2d). There was a moderate and statistically significant d++ (0.49), indicating that, when averaged across all sites, experimental warming increased aboveground plant productivity. The weighted mean increase in plant productivity due to warming was 19% (with a 95% confidence interval of 15–22%). Table 2 Weighted regression analyses results for soil respiration, net N mineralization, and plant productivity
Soil respiration N mineralization Plant growth
Intercept Slope P Intercept Slope P Intercept Slope P
Latitude 0.85 –0.001 0.986 1.31 –0.010 0.579 –0.36 0.017 0.166
Annual temperature 0.77 0.017 0.555 0.70 0.019 0.657 0.68 –0.051 0.027
Growing season temperature 0.14 0.049 0.321 0.38 0.036 0.641 1.11 –0.047 0.231 Annual precipitation 0.44 0.001 0.305 0.32 0.001 0.202 1.06 –0.001 0.072 Growing season precipitation 0.56 0.001 0.458 0.35 0.001 0.009 0.71 0.000 0.656
Growing season days 0.14 0.007 0.002 0.48 0.000 0.522 0.93 –0.002 0.373
Ambient soil temperature 0.46 0.028 0.809 0.98 –0.035 0.686 0.85 –0.025 0.523 Delta soil temperature 0.46 0.028 0.809 0.50 0.087 0.432 0.67 –0.032 0.856
Tindex 0.48 1.011 0.429 0.41 1.265 0.541 1.25 –2.418 0.018
Pindex 0.41 1.121 0.351 0.22 1.419 0.194 1.16 –1.849 0.096
PTindex1 0.47 1.327 0.329 0.28 1.897 0.310 1.20 –2.456 0.026
PTindex2 0.50 2.634 0.225 0.44 2.720 0.268 0.94 –3.697 0.022
Upper organic horizon N 1.48 –0.236 0.040 0.46 0.075 0.451 0.43 0.168 0.032 Upper organic horizon C –0.49 0.041 0.098 1.15 –0.010 0.517 0.64 0.003 0.805
Overall, no temporal patterns were observed in the response of plant productivity to warming (Fig. 3c). A significant difference in the response to warming was observed between the four biomes (Qb=12.74; P<0.01; Fig. 3c). The effect of warming on aboveground plant productivity was significantly greater than zero only for the low tundra biome, which includes the Minnesota bog and fen sites (d+=0.68). The effect of warming was much larger in the colder, high tundra biome (d+=1.22), but, due to the large confidence interval, was not significantly different from zero. The individual forest and grassland sites showed both positive and negative responses to warming, and their mean responses were near zero. The magnitude of the response to warming was independent of the method used to warm the plots (Fig. 3c).
Meta-analytic (weighted) regression analyses showed that the magnitude of d had significant or nearly signifi-cant inverse relationships with mean annual temperature (P<0.027) and mean annual precipitation (P<0.072) (Table 2), indicating that the positive response to warming was generally larger in colder systems with lower precipi-tation. This relationship was stronger when expressed relative to the climate indices. For example, there were significant inverse relationships between the magnitude of d and Tindex (P<0.018), PTindex1 (P<0.026), and PTindex2 (P<0.022). The only other environmental factor that appeared to influence plant response to warming was upper organic soil horizon N concentration, with d generally increasing with increasing organic soil horizon N concentration (P<0.032). However, no data were available on organic soil horizon N from three of the six sites that had negative responses to warming during 1 or more of the treatment years. No relationship was observed between the magnitude of d and delta soil temperature (Table 2).
Discussion
Results from this meta-analysis showed that across all sites, 2–9 years of experimental warming significantly increased soil respiration rates by 20%, organic soil hori-zon net N mineralization rates by 46%, and aboveground plant productivity by 19% across all sites. Because the evaluation of the effects of global warming on ecosystem processes is still a relatively new field of investigation, the database for this meta-analysis was small, with only 17 sites with soil respiration data, 12 sites with net N mineralization data, and 20 sites with aboveground plant productivity data. Despite these small sample sizes, the similarity in overall response patterns have important implications for terrestrial nutrient cycling and global C balance
Soil respiration
The increase in soil respiration in response to warming is consistent with results from individual in situ studies,
T
able
3
Mean net N mineralization rates for control and heated plots; delta soil temperature; mean upper or
ganic horizon N, C, and C:N;
and mean foliar N at 12 experimental
ecosystem warming sites Site
oolik Lake – wet sedge study
which have repeatedly demonstrated significant positive relationships between temperature and soil respiration (e.g., Witkamp 1966; Edwards 1975; Singh and Gupta 1977; Schleser 1982; Schlenter and Van Cleve 1985; Pinol et al. 1995). Given that soil respiration is one of the major fluxes in the global carbon cycle, with estimated
annual emissions of 68–100 Pg C year–1 (Musselman
and Fox 1991; Raich and Schlesinger 1992), a 20% increase in soil respiration would correspond to an
increased release of ~14–20 Pg C year–1. This is
2–3 times the estimated ~7 Pg C year–1of CO
2released to the atmosphere via combined fossil fuel combustion and land-use changes (Lal et al. 1995), and would provide
a strong positive feedback to global atmospheric CO2
concentrations and, consequently, warming. Caution, however, must be exercised in extrapolating results of this meta-analysis to a global basis. The increase in soil respiration reported here may be an overestimation because: (1) 13 of the 17 studies measured soil respiration only during the growing season, and the response may be smaller during the non-growing season when both roots and soil microbes are less active (Fahnestock et al. 1998; Jones et al. 1999), and (2) it is possible that the observed increases in soil respiration in response to warming are partly a transient response, reflecting the oxidation of only the most labile soil C compounds (Peterjohn et al. 1994). Once the labile soil C fractions are decomposed, the response of soil respiration to experimental warming may decline. A decrease with time in the magnitude of the response of soil respiration to experimental warming was observed at two of the nine sites for which multiple years of data were available: the Harvard Forest (Peterjohn et al. 1994) and the Huntington Forest sites (McHale et al. 1998). Results of this meta-analysis indicated a similar pattern and showed a significant positive effect of warming on soil respiration during the first 3 years of warming treatments, and no significant effect of warming on soil respiration during the fourth and fifth years of treatment (Fig. 3a). Differences in spatial and temporal response patterns may also be due to the different influences of warming on microbial vs. root respiration. These two components of total soil respiration have historically been very difficult to separate. Clearly, the longer-term response of microbial and root respiration to experimental warming is an area that warrants further study.
In reviews of the effects of temperature on rates of soil respiration, Schleser (1982) and later Kirshbaum (1995) hypothesized that the magnitude of the response of soil respiration to warming would be greater in colder, higher latitude ecosystems. Given that the soils in these ecosystems contain large amounts of organic C (Lal et al. 1995) and that the increase in temperature is expected to be greater at higher latitudes (IPCC 1996), global warming could result in a substantial release of C from soils to the atmosphere in high latitude ecosystems. Indeed, several studies have already suggested that some northern ecosystems have changed from a net C sink to a net C source (Oechel et al. 1993; Parton et al. 1995).
Results from this meta-analysis, however, showed no significant relationships between the magnitude of the response of soil respiration to warming (d) and mean annual temperature or precipitation, or mean growing season temperature or precipitation (Table 2). In fact, the only significant relationship between d and any of the climatic and environmental variables evaluated in the weighted regression analysis was a significant positive relationship between d and the length of the growing season (Table 2). This suggests that the response of soil respiration to warming was greater in warmer ecosystems. Further, there was no significant relationship between d and latitude, as had been hypothesized. The largest ds were observed for the forested sites (which tended to be mid-latitude), followed by the low tundra sites, and then the grassland sites (Fig. 3a).
In general, the mean rates of soil respiration reported here for the control plots were somewhat higher com-pared to rates reported in previous reviews (Raich and Schlesinger 1992; Raich and Potter 1995). This may be because the majority of the sites included in this synthesis measured soil respiration only during the warmer growing season, and thus did not include lower winter rates, whereas the previously published reviews selected only data sets with a full year of data. Despite this limitation, conventional (unweighted) linear regression showed a significant positive relationship between mean soil respiration rates in the control plots and mean growing season temperature. No significant relationships, however, were observed between mean soil respiration rates and mean annual temperature. Other analyses (Schleser 1982; Raich and Schlesinger 1992; Raich and Potter 1995) have shown significant positive correlations between mean annual or mean monthly rates of soil respiration and mean annual air temperature and mean annual precipitation, with mean annual air temperature being the single best climatic predictor of soil respira-tion. The relationship between soil respiration and mean annual temperature may be related in part to the signifi-cant relationship between fine root turnover and mean annual temperature (Gill and Jackson 2000).
Net N mineralization
1991; Goncalves and Caryle 1994; MacDonald et al. 1995; Hobbie 1996; Reich et al. 1997). For the 12 sites in this analysis, a 46% increase in net N mineralization corresponds to an increased internal production of 4.8 kg N ha–1year–1. This compares to atmospheric wet-plus-dry deposition inputs ranging from <5.0 kg N ha–1 year–1 in relatively pristine areas upwards to 50 kg N ha–1year–1 or more in the heavily polluted areas of the northeastern USA and Europe (Gunderson and Bashkin 1994; Vitousek et al. 1997). Because N is generally considered to be one of the key limiting nutrients in terrestrial ecosystems (Vitousek et al. 1997), a warming-induced increase in the internal production of inorganic N could stimulate plant growth and net ecosystem productivity at N-limited sites. This would effectively transfer N from soil pools with typically low C/N ratios (i.e., 30 or less) to plant biomass pools, with typically higher C/N ratios (i.e., >30), thereby increasing net ecosystem C storage (Rastetter et al. 1991, 1997). However, in N-sufficient or N-rich environments, particularly those in the northern hemisphere which are already impacted by elevated atmospheric N deposition, a warming-induced increase in internal N production could lead to or further exacerbate conditions of “N saturation”, where the input of N equals or exceeds the ability of an ecosystem to assimilate the added N (Aber et al. 1989, 1998). Joslin and Wolfe (1993) and Lukewille and Wright (1997), for example, have demonstrated warming-induced increases in soil leachate and run-off N. Symptoms of N saturation may include plant tissue nutrient imbalances, forest decline (and consequently declines in net ecosystem C sequestra-tion), increased gaseous loss of N (with consequent
feed-back to global warming as NO and N2O are
“green-house” gases), and increased N leaching from soils with consequent declines in associated surface water quality (Vitousek et al. 1997; Fenn et al. 1998).
Results from this meta-analysis showed no temporal trends in the response of net N mineralization to warming, no differences between the biomes or vegetation types, and no significant relationships between the magnitude of d and any of the geographic, climatic or environmental variables investigated. However, given the limits of the data set (i.e., seven of the 12 sites were at the Abisko Nature Reserve in Sweden, none of the sites were below 42°N latitude, and no data were available for grassland sites), broad generalizations on temporal, geographic, or climatic response patterns cannot realistically be drawn from this analysis. This underscores the need for future ecosystem warming studies to include net N mineralization measurements in their analysis.
Although the response of N mineralization to experi-mental warming did not show any significant geographic or climatic trends at this scale of analysis, rates of mean control-plot net N mineralization increased significantly with increasing mean annual precipitation, and showed a trend of increasing rates with increasing mean annual and mean measured soil temperatures. This likely reflects greater rates of microbial activity, and hence N mineralization, at warmer sites characterized by greater
precipitation. No relationships were observed between rates of net N mineralization and organic soil horizon N concentration or C/N ratios, as has been reported in other studies (MacDonald et al. 1995; Fernandez et al. 2000; Rustad et al. 2000).
Aboveground plant productivity
Experimental ecosystem warming significantly increased aboveground plant productivity by a mean of 19% across the 20 sites for which data were available (Table 4). In general, the response was greatest in the colder ecosys-tems characterized by lower mean annual precipitation, with the strongest response observed in the high and low tundra sites. The warming-induced increase in plant productivity may be a direct effect of either increased rates of photosynthesis at higher temperatures or (in those experiments with year-round warming) longer growing seasons, or an indirect effect of increased nutrient avail-ability, resulting from increased rates of litter decompo-sition and N mineralization. Both direct and indirect effects of warming could be particularly important in higher latitude arctic ecosystems, which tend to be both temperature and nutrient-limited.
Warming-induced increases in plant productivity have been reported previously for individual subarctic tundra sites (Chapin et al. 1995; Jonasson et al. 1996; Press et al. 1998; Hartley et al. 1999). Increases in plant produc-tivity would result in a greater storage of C in plant biomass (especially in systems with a significant woody component) and increased flux of C to soils in leaf and root litter. This could at least partially offset the warming-induced increase in C flux from soils to the atmosphere via soil respiration. Arft et al. (1999) reported a moderate but significant increase in plant growth during the first 3 years of treatments in the ITEX experiments, followed by no significant growth response for year 4. They suggested that the decline in growth response may be linked to resource limitations, particularly limitations in soil nutrients. In contrast, no temporal trends were apparent during the initial 5 years of warming treatments for the sites included in our analysis. The disparity in the temporal patterns presented in these two syntheses may be due to the wider range of sites included in our synthesis, with a greater representation of less nutrient-limited sites, or it could reflect differences in sample size bias. We cannot conclude from this analysis whether increases in plant productivity will compensate for greater respira-tory losses of C. However, warming-induced changes in plant productivity may well alter the global C balance.
Variation in response
555
N, C, and C:N; and foliar N at 20 experimental ecosystem warming sites
Site Mean % Data from Mean ▲▲ Mean ▲▲ Mean upper Mean upper Mean upper Mean Species for foliar N
change in the following air soil organic organic organic foliar
annual years of temperature temperature horizon N horizon C horizon N (%)
productivity the experiment (°C) (°C) (%) (%) C:N
Abisko Nature Reserve, –4.0 6 3.2 0.4 na na na 1 Empetrum hermaphroditum
Sheffield study
Abisko Nature Reserve, 9.1 3 5.1 0.8 1.4 47 34 1.7 Vaccinium myrtillus
MBL Field chamber study
Abisko Nature Reserve, 134.1 5 na 1.3 0.9 21 25 0.81 Evergreens
e.s.l. 1150 m., high heat study
Abisko Nature Reserve, 64.5 5 na 0.6 0.9 21 25 0.81 Evergreens
e.s.l. 1150 m., low heat study
Abisko Nature Reserve, 53.8 5 na 1.2 1.7 40 24 0.79 Evergreens
e.s.l. 450 m., high heat study
Abisko Nature Reserve, 33.0 5 na 0.6 1.7 40 24 0.79 Evergreens
e.s.l. 450 m., low heat study
Buxton Climate Change –0.7 1–5 na 3.0 0.7 7 10 1.46 Festuca ovina
Impacts Laboratory
Flakaliden 49.2 1–5 0.0 4.7 1.0 40 39 1.1 Picea abies
Minnesota Peatlands, bog, 9.8 1–3 na 1.6 1.1 42 38 0.89 Sphagnum acutifolia
high heat study
Minnesota Peatlands, bog, 13.1 1–3 na 2.0 1.1 42 38 0.89 Sphagnum acutifolia
medium heat study
Minnesota Peatlands, fen, 48.4 1–3 na 1.7 2.5 39 16 1.17 Rhynchospora spp.
high heat study
Minnesota Peatlands, fen, 46.1 1–3 na 1.4 2.5 39 16 1.17 Rhynchospora spp.
medium heat study
Ny Alesund 34.8 1, 3, 5 2.5 0.3 na 3 na 1.8 Dryas octopetala
Oak Ridge National Laboratory 11.2 1–4 3.3 1.6 na na na 2.05 Acer saccharum
Shortgrass Steppe – 12.0 1–2 1.0 0.6 0.2 1 7 1.5 Bouteloua gracilis
night-time warming
Rocky Mountain Biological –1.8 1–4 na 0.5 na na na 2 Artemisia tridentata
Laboratory
TERA –19.7 5 3.4 1.7 0.9 37 41 0.8 Pseudotsuga menziesii
Toolik Lake – wet sedge study 125.9 6 na 3.2 2.0 34 17 1.7 Carex rotundata
Toolik Lake – tussock study 37.6 3,9 na 2.2 0.4 17 43 1.8 Carex rotundata
observed both between sites and between years at a single site. Understanding the exceptions to the general response trends can provide useful insights on the under-lying mechanisms of ecosystem response to changes in temperature, and points to the need for caution in projecting responses based on averages.
Perhaps the most often cited explanation for the lack of response or negative response to increasing tempera-ture is the concomitant decline in soil moistempera-ture often associated with warming. For example, at individual sites, reduced or lower soil moisture has been cited for declines in soil respiration response to warming by Peterjohn et al. (1994), McHale et al. (1998), and Rustad and Fernandez (1998a); for declines in litter decomposition by Robinson et al. (1995) and Verburg et al. (1999); for increases in
CH4 consumption by Torn and Harte (1995), and for
declines in net C uptake by Saleska et al. (1999). Although not as commonly invoked, microbially-mediated responses to changes in temperature may also be affected by excess
soil moisture that would limit O2, thereby causing
decreases in aerobic processes and concomitant increases in anaerobic processes (Alexander 1977). Year-to-year or site-to-site differences in soil moisture may thus explain some of the observed temporal and spatial variation in response to experimental ecosystem warming.
The supply of soil nutrient resources (particularly N and P) and the nature and quantity of soil organic matter could influence the magnitude of ecosystem response to warming. For example, several studies have reported limited ecosystem response to warming alone, but signif-icant response to warming plus fertilization (Wookey et al. 1993, 1995; Parsons et al. 1994; Chapin et al. 1995; Press et al. 1998; Shaver et al. 1998). Arft et al. (1999) and Henry and Molau (1997) have hypothesized that the decline in the plant growth response to warming that was observed after only 3–4 years of treatment in the ITEX studies was due to limitations other than temperature, including depletion of soil nutrients. Rustad et al. (2000), meanwhile, suggested that the lower rates of soil respira-tion and more limited response to experimental warming at the Howland coniferous forest site compared to either the Harvard or Huntington Forest sites, both of which are northern hardwood forests, was due in part to the more recalcitrant quality of soil organic matter at the conifer-ous site. Similarly, Peterjohn et al. (1994) hypothesized that the marked decline in rates of soil respiration after just 1 year of warming at the Harvard Forest was due to the oxidation and resulting decline in labile soil C sources.
Higher mean annual temperatures will likely result in longer growing seasons and concomitant changes in plant phenology, including the timing of bud-break, flowering, and leaf abscission. Although this could result in greater NPP, negative effects are also possible. For example, leaf mass of Pseudotsuga menzeisei saplings grown for 4 years in outdoor, sunlit chambers was reduced in response to warming of the air by 3.5°C (Olszyk et al. 1998). The proposed explanation for this decline was that the buds were released from winter
dormancy earlier in warmer chambers, as might be pre-dicted, but this caused the needles to expand abnormally such that leaf area index, and hence plant growth, was reduced relative to that in control chambers (Apple et al. 1998). In a similar experiment with Acer saccharum and
Acer rubrum, warming also increased the length of the
growing season, but in this case stimulated productivity during the first year of warming in the heated chambers relative to the control chambers (Norby et al. 2000). In the second year of this experiment, however, unusually high summer temperatures caused stress responses in the trees in the heated chambers, and productivity was significantly reduced. This example illustrates that multiple responses to warming can occur simultaneously, and the net response may be difficult to predict.
Finally, ecosystem response to warming will certainly be affected by differences or changes in plant species composition (Harte and Shaw 1995; Hobbie 1996; Cornelissen et al. 1999), with species composition affecting other ecosystem properties such as plant growth rates, litter quantity and quality (and consequently microbial dynamics and litter decomposition), canopy structure and architecture, shading, and rooting depth, to name a few. Because changes in species composition may occur over decades to centuries, particularly in long-lived forest ecosystems, these changes may be difficult to capture under experimental conditions, which emphasizes the need for more accurate and comprehensive models of ecosystem response to environmental perturbation.
Warming methods
need to understand the relative importance of specific factors at different spatial and temporal scales, and suggests that we should be cautious in “scaling up” responses from the plot and site level to the landscape and biome level.
Conclusions
Evidence continues to accumulate that mean global temperature has increased by 0.2–0.3°C during the last 40 years, and current general circulation models suggest that the mean global temperature will increase by another 1–3.5°C in the next century (IPCC 1996). Although the number of ecosystem warming experiments around the world is growing, there remains a paucity of data on whole ecosystem response to changes in temperature. Results from this meta-analysis demonstrate that across a wide range of ecosystem types and experimental methodologies, experimental warming in the range of 0.3–6.0°C significantly increases rates of soil respiration, net N mineralization, and aboveground plant productivity. These results are consistent with (though not a direct test of) the conceptual model where warming directly increases rates of microbial processes including litter decomposition and N mineralization, thereby increasing the availability of nutrients, and, particularly in nutrient-limited ecosystems, increasing plant productivity. The increase in plant productivity may also be a result of a direct effect of warming on rates of net photosynthesis, or an extension of the growing season.
Differences among biomes were apparent for the response of soil respiration and plant productivity to warming, with the response of soil respiration generally larger in forested ecosystems compared to low tundra and grassland ecosystems, and the response of plant productivity generally larger in low tundra ecosystems than forest and grassland ecosystems. No differences between the biomes were observed for the response of net N mineralization to warming, which may be due to small sample sizes. In general, the magnitude of the response of these three processes to experimental warming was not significantly related to the various geographic, climatic, or environmental variables that we evaluated. The primary exception to this was plant productivity, which showed a significantly larger response to warming in colder ecosystems.
Although our results represent the most comprehen-sive synthesis of ecosystem response to experimental warming to date, there were major limitations to the analysis, most notably the fact that above- and below-ground processes were not typically measured in the same studies. The focus of the individual experiments tended to be directed either at soil processes or plant processes, and thus it was difficult to test integrated hypotheses relating to whole ecosystem response to warming. In fact, perhaps the most significant conclusion that can be drawn from this synthesis is the observation that more comprehensive, whole ecosystem studies are
needed in order to test the validity of both conceptual and quantitative models of ecosystem response to warming. Towards this goal, we make the following recommendations for future research on ecosystem response to global warming:
1. Focus on whole-ecosystem warming experiments. To date, the majority of studies have focused on either aboveground plant response or belowground soil response to experimental warming. Ultimately, we need to understand the integrated response of entire ecosystems to altered thermal regimes.
2. Support longer-term experiments. The magnitude and even the direction of the response to warming have been shown to change over time due to changing resource conditions, alterations in competitive inter-actions, and acclimation (Shaver et al. 2000). It is imperative to continue some studies beyond the typical 3-year funding cycle to distinguish transient response from longer-term trends.
3. Add experiments in under-represented biomes. To date, the majority of warming experiments have been conducted in north temperate, boreal and arctic eco-systems. These systems tend to be cool, moist, and strongly nutrient-limited. A clear need exists to understand the response of warmer and/or drier eco-systems to warming, including Mediterranean, desert, and tropical ecosystems, where the indirect effects of temperature on moisture will likely play a larger role in these ecosystems, and the possibility of exceeding temperature maxima should be considered.
4. Encourage common protocols. The comparison of ecosystem response to experimental warming at large temporal and spatial scales would benefit greatly from the establishment of common protocols across a coordinated global network of sites. This would allow a more direct comparison of results and would encourage continued data synthesis.
5. Combine warming experiments with gradient studies. Although experimental manipulations of soil and air temperature have provided useful insights on ecosystem response to warming on annual to decadal time frames, these types of manipulations do not simulate the gradual change in climate that occurs on the century to millennium scale. Combining results from warming experiments (annual to decadal time scale) with studies of ecosystem dynamics along natural climatic and environmental gradients (millennium time scale) would effectively put bounds on what is likely to occur on the century time scale (Callaghan et al. 1999).
6. Investigate interactions with other vectors of
environ-mental change. Ultimately we must evaluate the
Results from the existing, first-generation ecosystem warming experiments, many of which have been included in this meta-analysis, have shown that increases in temperature in the range of 0.3–6.0°C can have sig-nificant impacts on ecosystem function. Future ecosystem warming experiments need to: (1) more fully integrate the experiments at the ecosystem level, (2) investigate interactions with other vectors of environmental change, and (3) expand the spatial and temporal scales of analysis. To help accomplish this, the GCTE core project of IGBP has established a NEWS (GCTE-NEWS) to integrate and foster research on ecosystem-level effects of rising temperature. NEWS will promote the establishment of new research projects – using a variety of warming techniques including gradient and transplant studies – in biomes which are not currently investigated. The Network
will carry out periodic synthesis of results and integration through modeling with other ongoing
research efforts such as those on elevated CO2 and N
deposition.
Acknowledgements This paper contributes to the Global Change and Terrestrial Ecosystems (GCTE) core project of IGBP and to the activities of the Network of Experimental Warming Studies (GCTE-NEWS). The work was initiated with the support of the National Center for Ecological Analysis and Synthesis, a Center funded by NSF (Grant no. DEB-94–21535), the University of California-Santa Barbara, the California Resources Agency, and the California Environmental Protection Agency. We also want to thank NASA through a grant to GCTE, the National Science Foundation (Grant no. DEB-9730110), and the USDA Forest Service Northern Stations Global Change Research Program for the additional funding they provided. All experiments comply with the current laws of the country in which the experiments were performed.
Appendix 1
Site characteristics and experimental design for the ecosystem warming studies
Site Abbreviation State, country Latitude Longitude Biome Vegetation Ecosystem type Abisko Nature Reserve, AB_SHEF Sweden 68 21’N 18 49’E Low tundra Woody Open birch heath/
Sheffield study woodland
Abisko Nature Reserve, AB1150HI Sweden 68 21’N 18 49’E High tundra Woody Dwarf shrub
e.s.l. 1150 m, fellfield
high heat study
Abisko Nature Reserve, AB1150LO Sweden 68 21’N 18 49’E High tundra Woody Dwarf shrub
e.s.l. 1150 m, low heat study fellfield
Abisko Nature Reserve, AB450HI Sweden 68 21’N 18 49’E Low tundra Woody Dwarf shrub
e.s.l. 450 m, high heat study heath
Abisko Nature Reserve, AB450LO Sweden 68 21’N 18 49’E Low tundra Woody Dwarf shrub
e.s.l. 450 m, low heat study heath
Abisko Nature Reserve, ABMBLC Sweden 68 35’N 18 82’E Low tundra Woody Dwarf shrub
MBL cable study heath
Abisko Nature Reserve, ABMBLO Sweden 68 35’N 18 82’E Low tundra Woody Dwarf shrub
MBL OTC study heath
Buxton Climate Change BCCIL UK 53 20’N 2 00’W Grassland Non-woody Grassland Impacts Laboratory
Climate Change CLIMEX Norway 58 23’N 8°19’E Forest Woody Birch and
Experiment pine mixture
Flakaliden FLAK Sweden 64 07’N 19°27’E Forest Woody Planted evergreen forest
Minnesota Peatlands, bog, FRFBOGHH MN, USA 47 10’N 92°43’W Low tundra Non-woody Bog peatland high heat study
Minnesota Peatlands, bog, FRFBOGMH MN, USA 47 10’N 92°43’W Low tundra Non-woody Bog peatland medium heat study
Minnesota Peatlands, fen, FRFFENHH MN, USA 46 59’N 92°34’W Low tundra Non-woody Fen peatland high heat study
Minnesota Peatlands, fen, FRFFENMH MN, USA 46 59’N 92°34’W Low tundra Non-woody Fen peatland medium heat study
Harvard Forest HARVARD MA, USA 42 30’N 72°10’W Forest Woody Northern hardwood forest
Howland Forest HIFS ME, USA 45 10’N 68°48’W Forest Woody Spruce-fir forest Huntington Wildlife Forest, HUNT2.5 NY, USA 43 59’N 74°14’W Forest Woody Northern hardwood
2.5°C study forest
Huntington Wildlife Forest, HUNT5.0 NY, USA 43 59’N 74°14’W Forest Woody Northern hardwood
5.0°C study forest
Huntington Wildlife Forest, HUNT7.5 NY, USA 43 59’N 74°14’W Forest Woody Northern hardwood
7.5°C study forest
Site Abbreviation State, country Latitude Longitude Biome Vegetation Ecosystem type Ny Alesund NY_AL Norway 78 56’N 11 50’E High tundra Non-woody Dryas octopetala
community Oak Ridge National ORNL TN, USA 35 54’N 84 21’W Forest Woody Planted deciduous
Laboratory trees
Rio Mayo RIO_MAYO Argentina 45 25’S 70 16’W Grassland Non-woody Grass, shrub steppe Rocky Mountain Biological RMBL CO, USA 38 53’N 107°02’W Grassland Non-woody Subalpine meadow Laboratory
Shortgrass Steppe – SGS-DW CO, USA 40 49’N 104°46’W Grassland Non-woody Shortgrass steppe day-time warming
Shortgrass Steppe – SGS-NW CO,USA 40 49’N 104°46’W Grassland Non-woody Shortgrass steppe night-time warming
TERA TERA OR, USA 44 33’N 123°16’W Forest Woody Planted evergreen
trees
Toolik Lake – wet sedge TLKSED AK, USA 68 38’N 149°34’W Low tundra Non-woody Wet sedge meadow study
Toolik Lake – tussock study TLKTUS AK, USA 68 38’N 149°34’W Low tundra Non-woody Tussock tundra Toolik Lake – dry heath TOOLIKDH AK, USA 68 38’N 149°35’W Low tundra Non-woody Dry heath study
Toolik Lake – moist tussock TOOLIKMT AK, USA 68 38’N 149°35’W Low tundra Non-woody Moist tussock tundra study
Wytham Woods WYTHAM UK 51 46’N 1 20’W Grassland Non-woody Calcareous grassland
Mean annual Mean annual Mean growing Mean growing Average Warming Replicate Heating Reference temperature precipitation season season growing technology plots per duration
(°C) (mm) temperatur) precipitation season treatment
(°C (mm) (days)
–1 301 10 122 92 Field chamber 6 Field season Press et al. (1998)
–5 500 6 150 61 Field chamber 6 Field season Jonasson et al. (1993)
–5 500 6 150 61 Field chamber 6 Field season ”
–1 304 10 121 92 Field chamber 6 Field season ”
–1 304 10 121 92 Field chamber 6 Field season ”
0 228 9 126 122 Cables 4 Field season Hartley et al. (1999)
0 228 9 126 122 Field chamber 12 Field season ”
8 1292 13 408 154 Cables 5 Winter only Grime et al. (2000)
5 1400 11 810 183 Cables 1 All year Lukewille and Wright
(1997)
2 590 11 270 135 Cables 2 Field season Bergh and Linder
(1999)
3 634 13 488 183 Infrared 3 All year Bridgham et al. (1999)
3 634 13 488 183 Infrared 3 All year ”
3 634 13 488 183 Infrared 3 All year ”
3 634 13 488 183 Infrared 3 All year ”
7 1102 13 765 177 Cables 6 All year Peterjohn et al. (1994)
6 1100 11 na 168 Cables 2 Field season Rustad and Fernandez
(1998a)
4 1010 15 447 152 Cables 6 Field season McHale et al. (1998)
4 1010 15 447 152 Cables 6 Field season ”
4 1010 15 447 152 Cables 6 Field season ”
–4 930 7 na 130 Field chamber 3 Field season Welker et al. (1999)
–6 371 4 78 76 Field chamber 6 Field season Robinson et al. (1995)
14 1322 22 772 184 Field chamber 3 All year Norby et al. (1997)
8 150 11 14 152 Field chamber 10 Field season Sala et al. (1989)
5 750 9 100 61 Infrared 5 All year Harte et al. (1995)
9 322 18 225 135 Greenhouse 2 Field season Burke and Lauenroth
(1993)
9 322 18 225 135 Night warming 4 Field season Alward et al. (1999)
11 1095 na na 364 Field chamber 3 All year Tingey et al. (1996)
–9 330 9 177 71 Greenhouse 2 Field season Shaver et al. (1998)
–9 330 9 177 71 Greenhouse 4 Field season ”
–9 330 9 177 71 Field chamber 3 Field season Jones et al. (1998)
–9 330 9 177 71 Field chamber 3 Field season Jones et al. (1998)