A Survey on the Transient Stability of Power Systems with Converter Connected
Distributed Generation
Muhamad Reza
1,2 1Electrical Power System Laboratory, Delft University of Technology, Delft, the Netherlands (The author’s affiliation when the work was performed) 2
ABB Corporate Research, Västerås, Sweden
ABSTRAC T
In the classical (vertical) power systems the synchronous operation of every interconnected synchronous machine (with its inherently rotating masses – inertia) is the main requirement for stable operation. As many of the distributed generation technologies are connected to the distribution network via power electronic interfaces, and do not contain inertia, the power system may show different transient stability phenomena. In this paper, the transient stability of power systems with (inertia less) converter connected distributed generation is explored via the Equal Area Criterion method and compared with that of a traditional (vertical) power system. With the existence of a strong external system, it is found that a system with a higher level of penetration of DG exhibits better stability, as measured by improved critical clearing times of the remaining synchronous generator(s).
Keywords: converter connected distributed generation, power systems transient stability
ABSTRAK
Pada sistem tenaga listrik klasik, sinkronisasi di dalam pengoperasian seluruh generator serempak (yang masing memiliki kelembaman/momen inersia) yang terhubung pada sistem adalah persyaratan yang utama untuk kestabilan operasi system tersebut. Dengan banyaknya pembangkit listrik tersebar yang terhubung pada jaringan distribusi listrik melalui perangkat elektronika daya, yang tidak dilengkapi dengan kelembaman/ momen inersia, akan menghasilkan fenomena kestabilan yang berbeda. Di dalam makalah ini, akibat penerapan pembangkit listrik tersebar yang terkoneksi melalu perangkat elektronika data terhadap kestabilan transien dari sebuah sistem tenaga listrik akan diamati dengan menggunakan metoda ”Equal Area Criterion”. Hasil pengamatan kemudian dibandingkan dengan kestabilan transien sebuah sistem tenaga listrik klasik. Di dalam makalah ini ditemukan bahwa ketika sebuah sistem tenaga listrik masih terkoneksi dengan jaringan listrik eksternal yang rigid, maka penerapan pembangkit listrik tersebar akan meningkatkan kestabilan operasi sistem, yang ditunjukkan dengan peningkatan ”critical clearing times” dari generator serempak yang terhubung ke sistem tersebut.
Kata kunci: pembangkit listrik tersebar terhubung dengan perangkat elektronika daya, kestabilan transien sistem tenaga
listrik
INTRO DUC TIO N
Driven by the increasing environmental concerns it is expected that many new generation technologies, including renewable generation, will be connected to the electrical power system as distributed generation (DG).
Inte rfacing DG with Powe r Ele ctronics
T here are a lot of different DG technologies, based on distinct energy sources, such as co-generation, wind turbines, small hydro and fossil-fuelled generators, photovoltaic systems, fuel cells and micro-generation [1]. T hese DG units, especially the ones whose prime movers are based on renewable energy sources with intermittent characteristics (like wind and solar), are mostly connected to the distribution network via power electronic interfaces, which are primarily used to maximize the energy yield [2].
Note: Discussion is expected before June, 1st 2007. The proper discussion will be published in Electrical Engineering Journal volum e 7, num ber 2, Septem ber 2007.
Ine rtia of Synchronous Ge ne rator
T he transient stability is defined as the property of a power system to return to a stable operating point after the occurrence of a disturbance [3, 4]. Traditio-nally, the transient stability problem is to maintain the synchronous operation of the synchronous generators in the system, i.e. to keep the operation speed of the rotors of all synchronous generators constant, which will result in constant angular position between two machines [3, 5].
T he fundamental equation that governs the rotational dynamics of the synchronous generator is represented by means of the swing equation [3, 5]:
2
2 2
a m
s H d
e
P P P
dt δ
ω = = −
[pu] (1)
rotational losses in pu., Pe is the electrical power crossing the air gap in pu., Pa is the accelerating power in pu., ωs synchronous speed in electrical units in rad/s and t is the time in s.
T he more rotational mass the synchronous generator has, the less the generator rotor will respond to an accelerating or decelerating tendency due to a disturbance.
C O NVERTER C O NNEC TED DISTRIBUTED GENERATIO N
When DG is connected to power systems via a power electronic interface, no inertia is added to the system because:
• T he DG itself generates DC power (i.e. f = 0), e.g. photovoltaic and fuel cells (figure 1).
• T he inertia of the DG whose prime mover invol-ves rotating masses is ‘hidden’ behind the power electronic interface by decoupling the mechanical rotor speed of the DG with the electrical frequency of the grid (figure 2).
DC- generated power to Grid
Figure 1. Connecting DG with DC output power to the power system
to Grid
Figure 2. Connecting DG with rotating machines to the power system via a power electronic interface
T hus, in the above-mentioned situations, the DG will not change the acceleration or deceleration of the synchronous generators in the grid, in case of a mismatch between generation and load in the system [4].
Transient Analysis S imulation
In this study, the transient behavior of a power system with converter connected DG is investigated by means of simple test system (shown in figure 3) that consists of 5 buses:
• Bus 2 is an infinite bus (to represent an intercom-nection with a large external system),
• A plant containing similar and coherent CGs (every CG implemented in this bus is identical and the rotors of all the machine rotate and swing
coherently just like all the rotors are mechanically coupled) is connected to bus 1,
• T he load that is represented as constant impedance during the transient analysis is connected to bus 5. DG supplying only active power is connected to bus 5 and modelled as negative load.
Figure 4 shows the reactance diagram of the pre-fault test system. T able 1 lists the values of the parameters used in the test system.
8
Figure 3. One-line diagram of the test system
+
Figure 4. Reactance diagram of the test system in the pre-fault (steady- state) situation
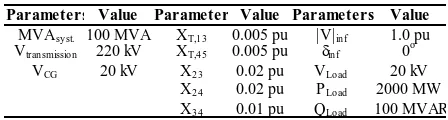
T able 1. Values of the parameters used in the simu-lation
Parameters Value Parameter Value Parameters Value MVAsy st. 100 MVA XT,1 3 0.005 pu |V|in f 1.0 pu
T en cases are developed by gradually increasing the amount of converter connected DG. T he DG is connected at the same bus as the load (bus 5) and supplies active power only. T herefore, the DG is regarded as negative load in the load bus. In the first case (case 1), no DG is connected in the load bus, and the load is completely supplied by 10 identical CG units in bus 1. By increasing the DG penetration level in steps of 10 % of the active load, one CG unit is shutdown in every case, which results in an altered value of Xd’ too (since the CGs are assumed to be in
T able 2. Values of the parameters used in the 10
T he constant load model Y5,Load (figure 4) is
calcu-lated as:
T he impact of converter connected DG during the fault (transient situation) is modelled in such that the DGs disconnect during the fault, so that (during the fault) no negative load is implemented (PDG in
equation (2) equals to zero). T he values of V5 in
equation (2) are obtained by running a load flow program with PSS/E 25.4 on the pre-fault condition of every case. T he transient stability of the test system is investigated by applying a temporary three-phase fault to a transmission line in the middle of line 3-4 (See figure 3).
Since the test system can be regarded as a single machine infinite bus (SMIB) system (since all the synchronous machines in bus 1 are coherently operated) the Equal Area Criterion [6] is used to investigate the transient stability phenomena of each case in every scenario. To assess the transient stability performance, one indicator is used, namely the critical clearing time (tcr), which is defined as the maximal
time needed to clear the fault present in the system without causing instability.
By deriving the admittance matrix Ybus (5x5), along
with the corresponding reduced admittance matrix
' bus
Y
(2x2), that explicitly relates bus 1 and bus 2, the values of Pe (thus Pc, Pmax, andδ), of every case andevery (sub-) scenarios (in both pre/post fault and during fault conditions) for equations (3)-(6) [4, 6, 7], are calculated. Subsequently, the critical angles (δcr)
are calculated using the equal area criterion (equation (7)) [3, 5]. Finally, the corresponding critical clearing times (tcr) – the time needed to achieve the critical
angles (δcr) – are computed iteratively using equations
(8)-(10) [5].
m e during fault e pre post fault m
P P P
Where is the transient internal voltage of CG in
pu., is the transient voltage of the infinite bus, i.e.
1.0 in pu., P
m is the shaft power input less rotational
losses in pu., ' ,
1 2
Y
θ
12' , are respectively theadmittance (in pu.), angle ( in rad), and susceptance ( in pu.) elements of reduced
'
Pe,pre/post faultare the electrical power crossing the air gap
during fault and pre-/post-fault ( both in pu.), δ0, δcr,
max
δ
are respectively the initial-, critical-, andmaximum- rotor angles (all in rad.) (See Figure 6),
n
δ
∆ ,
δ
nare respectively the change in angle and theangle in the n-interval iteration ( both in rad), f is
system frequency in Hz., is the iteration time
interval in s, and P
t ∆
a,n is the accelerating power at the
middle of the iteration interval in pu.
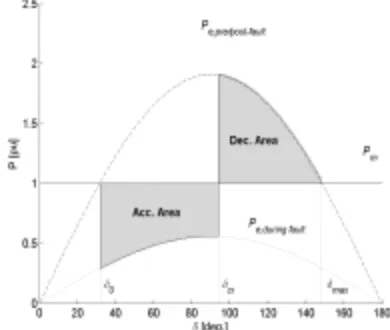
Figure 6. Plot of power-angle curves typically found in every simulation case, showing the initial
(δ0), critical (δcr), and maximum (δmax)
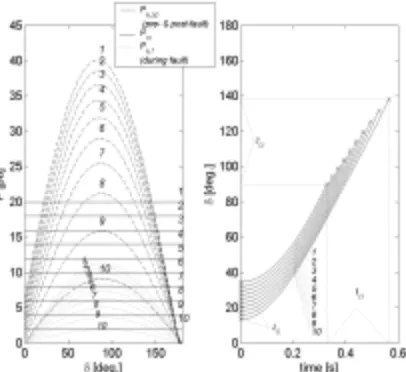
Figure 7. The results when Fault #1 is simulated on either Scenarios I or II (10 cases). Left graph: Plots of the power-angle curves. Right graph: Swing curves plotted until the
point where the critical angles (δcr) are
reached on the critical times (tcr)
RESULTS
Figure 7 shows the results of Scenario I (10 cases). It is shown in the left graph of figure 7, that when the
number of CG units decreases, the plots of Pm,
Pe,pre/post-fault, and Pe,during fault, and the
δ
0 decrease,whereas the
δ
max increases. Application of the equalarea criterion (See Equation (8) and Figure 6) results
in rising
δ
cr-values when the number of CG unitsconnected to the system falls. Although H is decreasing (when the number of CG units decreases, see Table 2) – so that a particular rotor angle would be reached faster if all the other parameters in equations (9) are kept the same – the time needed to reach a
particular
δ
cr, i.e. tcr, is longer (as can be seen in theright graph of figure 7). This is caused by the fact that two opposite effects play a role when the number of CG units is reduced: less H versus a changing
network topology (altered value of Xd’ since the CGs
are assumed to be in parallel). This last effect is the
strongest (in this case) and results in lower Pm, Pe,pre/post
fault, Pe, during fault curves and
δ
0-values. Figure 7:(left graph) shows these situations, whereas higher
δ
max andδ
cr-values are obtained which leads to longercritical clearing times and better stability.
Table 3 shows the critical angles (
δ
cr) and criticalclearing times (tcr) that resulted from the simulation of
all the cases.
Table 3. Simulation results
Case [nr.] δ0 (deg.) δmax (deg.) δcr (deg.) tcr (s)
1 34.59 145.41 90.06 0.328
2 32.18 147.82 94.44 0.349
3 29.82 150.18 99.04 0.371
4 27.51 152.49 103.86 0.394
5 25.22 154.78 108.92 0.417
6 22.94 157.06 114.22 0.441
7 20.66 159.34 119.79 0.466
8 18.35 161.65 125.66 0.495
9 15.98 164.02 131.86 0.527
10 13.52 166.49 138.46 0.565
C O NC LUSIO NS
In this study, a simple 5-bus system is used. The equal area criterion is used to assess the system transient performance, and the critical fault clearing time, which is defined as the maximal time needed to clear the fault applied in the system without causing instability, is used as the system stability indicator.
The results in this paper show with the existence of a strong external system, a better stability is obtained, as measured by longer critical fault clearing times of the remaining synchronous generator(s).
Acknowledgement
This research has been performed within the framework of the research program ‘intelligent power systems’ (http://www.intelligentpowersystems.nl) that is supported financially by Senter. Senter is an agency of the Dutch Ministry of Economic Affairs. The author would like to thank , Dr. P.H. Schavemaker and Prof. W.L. Kling from the Transmission System Operator, TenneT bv, Arnhem the Netherlands and Prof. L. van der Sluis and Dr. M. Gibescu from the Electrical Power System Research Group, Delft University of Technology, the Netherlands, for the discussions and suggestions during the preparation of this paper.
REFERENC ES
[1] N. Jenkins. “Impact of Dispersed Generation on Power Systems”. ELECTRA, No. 199, 1999. [2] J. H. R. Enslin. “Interconnection of Distributed Power to the Distribution Network”. In Proceedings of IEEE Young Researcher Symposium, Delft, the Netherlands, Delft, the Netherlands, 18-19 March 2003.
[4] J. G. Slootweg. Wind power: Modelling and impact on power systems dynamics (PhD Thesis). Electrical Power Systems Laboratory, Delft University of Technology.