Volume 25, Number 1, 2010, 1 – 16
INFRASTRUCTURE POLICY IN INDONESIA: NEW DIRECTIONS
Peter McCawley
Arndt-Corden Economics Division & Indonesia Project ANU College of Asia and the Pacific, Australia
(peter.mccawley@anu.edu.au)
ABSTRACT
Indonesia faces an infrastructure crisis. The infrastructure crisis is part of a broader challenge of mobilising investment capital to support overall development. The basic arguments of this article are as follows. First, long-term development in Indonesia will be held back unless increased amounts of priority infrastructure can be provided. Second, the required infrastructure projects will not be constructed unless bottlenecks holding back the investments can be overcome. Third, bottlenecks appear to fall into two main types: financial and real constraints to growth. Fourth, more emphasis on a commercial approach to the provision of infrastructure in Indonesia which emphasises competition and responsiveness to stakeholders is needed.
Keywords: infrastructure; finance; markets; prices
INTRODUCTION
Indonesia faces an infrastructure crisis. The infrastructure crisis is part of a broader challenge of mobilising investment capital to support overall development. This article, however, will concentrate on infrastructure issues.
The basic arguments set out below are as follows. First, long-term development in Indonesia will be held back unless increased amounts of priority infrastructure can be provided. Second, the required infrastructure projects will not be constructed unless bottlenecks holding back the investments can be overcome. Third, bottlenecks appear to fall into two main types: financial and real constraints to growth. Fourth, more emphasis on a commercial approach to the provision of infrastructure in Indonesia which emphasises competition and responsiveness to stakehol-ders is needed.
THE CURRENT SITUATION
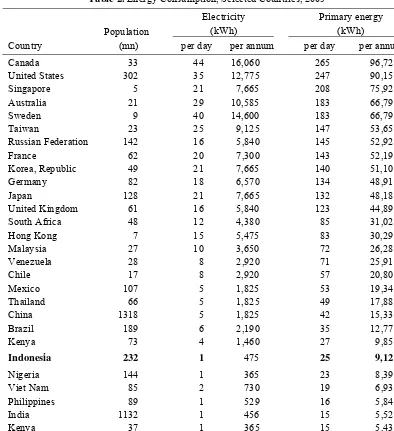
More detailed data on energy consumption also underlines the very large differences between developing and developed countries (Table 2). In average terms, in 2005 consumers in rich countries used around 10,000 kWh of electricity per person per year (around 30 kWh per day) while consumers in poor countries used around 400 kWh (about 1 kWh per person per day). Total primary energy use (a measure of total energy use, including non-electricity sources) was natu-rally larger in absolute terms but the very large gaps between rich and poor countries remained.
These figures provide some indication, in broad terms, of the huge amounts of invest-ment needed to begin to close the infra-structure gap between rich and poor countries. As one would expect, the infrastructure gap is generally very large. The gap is so large that even if quite modest assumptions are made about likely levels of access to infrastructure
services in poor countries by (say) 2030, then it is clear that very large amounts of investment would be needed to reach minimum acceptable levels of access for the majority of the population.
FRAMEWORK FOR RESPONSE
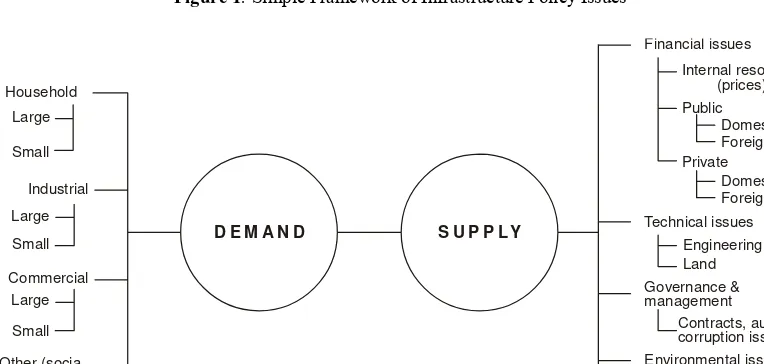
In considering a policy framework to mobilise investment for infrastructure, it is useful to think in terms of demand and supply (Figure 1). On the demand side, the requi-rements of different types of consumers need to be considered because of the public policy implications of responding to these different types of demand. On the supply side, there are a range of issues. Financial and technical issues are key matters, but other issues need attention as well – governance, environment, and (often neglected) maintenance and sustainability. But this framework is too simple. On both sides, there are additional factors to be considered.
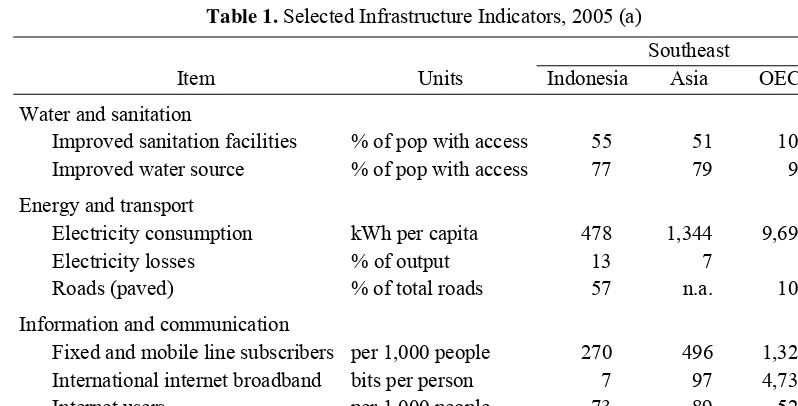
Table 1. Selected Infrastructure Indicators, 2005 (a)
Southeast
Item Units Indonesia Asia OECD
Water and sanitation
Improved sanitation facilities % of pop with access 55 51 100
Improved water source % of pop with access 77 79 99
Energy and transport
Electricity consumption kWh per capita 478 1,344 9,694
Electricity losses % of output 13 7 6
Roads (paved) % of total roads 57 n.a. 100
Information and communication
Fixed and mobile line subscribers per 1,000 people 270 496 1,325
International internet broadband bits per person 7 97 4,732
Internet users per 1,000 people 73 89 525
Personal computers per 1,000 people 14 38 585
Table 2. Energy Consumption, Selected Countries, 2005
Electricity Primary energy
(kWh) (kWh)
Country
Population
(mn) per day per annum per day per annum
Canada 33 44 16,060 265 96,725
United States 302 35 12,775 247 90,155
Singapore 5 21 7,665 208 75,920
Australia 21 29 10,585 183 66,795
Sweden 9 40 14,600 183 66,795
Taiwan 23 25 9,125 147 53,655
Russian Federation 142 16 5,840 145 52,925
France 62 20 7,300 143 52,195
Korea, Republic 49 21 7,665 140 51,100
Germany 82 18 6,570 134 48,910
Japan 128 21 7,665 132 48,180
United Kingdom 61 16 5,840 123 44,895
South Africa 48 12 4,380 85 31,025
Hong Kong 7 15 5,475 83 30,295
Malaysia 27 10 3,650 72 26,280
Venezuela 28 8 2,920 71 25,915
Chile 17 8 2,920 57 20,805
Mexico 107 5 1,825 53 19,345
Thailand 66 5 1,825 49 17,885
China 1318 5 1,825 42 15,330
Brazil 189 6 2,190 35 12,775
Kenya 73 4 1,460 27 9,855
Indonesia 232 1 475 25 9,125
Nigeria 144 1 365 23 8,395
Viet Nam 85 2 730 19 6,935
Philippines 89 1 529 16 5,840
India 1132 1 456 15 5,522
Kenya 37 1 365 15 5,435
Bangladesh 149 1 365 5 1,825
Source: UN, Dept of Economic and Social Affairs, 'World Economic and Social Survey (2009).
On the demand side, it is necessary to bear in mind that in Indonesia – as is the case in most developing countries – there are several distinct markets for infrastructure services. And for policy-making purposes, it is often best to regard these as rather separate, segmented markets with quite different characteristics (Box 1). On one hand, there is a demand from consumers of all kinds
consumers, large numbers of whom are either on the fringes of the modern, formal sector or who mainly live and work in the informal sector of the economy. Consumers in the S sector are generally able to afford only small amounts (sometimes micro amounts) of infrastructure services and are less concerned about the quality of the services than are consumers in the L sector.
In framing public policy, it is important to distinguish between the L (modern, formal) and S (small scale, informal) segments of infrastructure markets for several reasons. For one thing, the technical requirements of
providing services in each sector are often rather different. In the past, state-owned utilities in Asia (which are themselves usually large firms in the L sector) have often found it difficult to be flexible in the provision of services. They have generally concentrated on supplying services to the L sector and have tended to neglect the needs of consumers in the S sector. For another thing, pricing policies need to be designed so that the generous subsidies often provided to infrastructure services are well-targeted and achieve the desired objectives of policy. These matters will be taken up in more detail below.
D E M A N D S U P P L Y
Household
Industrial
Commercial
Other (socia, government,
etc) Maintenance &sustainability
Environmental issues Governance & management Technical issues Financial issues
Source: Author’s (2009)
Figure 1: Simple Framework of Infrastructure Policy Issues
Household
Large
Small
Other (socia, government, etc) Commercial
Large
Small Large
Small Industrial
D E M A N D S U P P L Y
Financial issues
Technical issues
Governance & management
Environmental issues
Maintenance & sustainability
Contracts, audit & corruption issues
Engineering Land
Internal resources (prices) Public
Private Domestic Foreign
Domestic Foreign
Source: Author’s (2009)
BOX 1: Illustrative Examples of Infrastructure Services in the Large Scale (L) and Small Scale (S) Sectors
Sector Large scale Small scale
Electricity Large urban households consuming 30 kWh pd; Hotels consuming 15,000 kWh pd; modern hospitals consuming 10,000 kWh pd
Simple houses consuming less than 1 kWh pd; small shops drawing 3 kWh pd; rural health clinics using 5 kWh pd.
Roads, local transport
Modern 6-lane tollways used by air-conditioned cars
Footpaths and village paths; rural feeder roads; bicycles; motor cycles; old non-airconditioned buses, poorly maintained and often unsafe
Water Urban households with piped hot and cold water and swimming pools, often using 1,000 litres (1 m3) pd
Kampung and desa households not connected to 24-hour piped water supplies using perhaps 100 litres pd; no heated tap water; often reliant on water supplied through informal markets or on wells and streams in rural areas
Sanitation Easy access to modern sanitation services; urban households with at least one flush toilet (often several) within the house
No access to modern sanitation services; reliance on informal methods of sanitation disposal
Long-distance transport
Airlines, or private motor vehicles Buses, inter-island ferries, and rail
Source: Author’s (2009).
On the supply side, there are important policy issues to be considered under a number of the topics shown in Figure 1. Financial issues naturally loom large for senior policy-makers. The ability to undertake new projects is often largely dependent on the availability of finance. Frequently, firms providing infrastructure have access – in principle, at least – to finance from a variety of sources so it will be useful to consider the options currently available to policy-makers in Indonesia. When government policies or community attitudes restrict access to finance, then shortages in the supply of infrastructure become likely. A range of technical issues need to be considered as well; difficulties in acquiring land have been identified as an
especially important matter in Indonesia in recent years as well as the various engineering choices that infrastructure planners must consider. Further, governance and manage-ment issues (such as managemanage-ment of contracting procedures, responses to audits, and controls to detect corruption, to mention just a few) need close attention. And environmental matters as well as programs to ensure proper maintenance (and, thus, sustainability of operations) are matters which policy-makers need to consider (Figure 2).
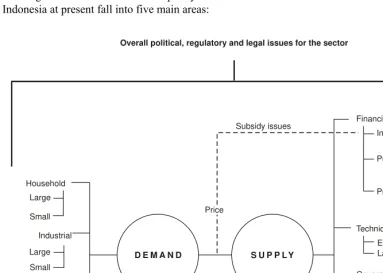
main issues – closely related to the overall political environment – are the financial constraints (reflected in prices and subsidies) which regulatory authorities set down for infrastructure sectors. The combination of all of these elements (Figure 3) provides an overall picture of the complicated environment within which policy decisions need to be made in infrastructure sectors. The elements of this overall picture – and the way that different parts of the picture fit together – certainly vary between different infrastructure sectors. However the overall framework shown in Figure 3 provides an effective way of considering infrastructure policy in Indonesia.
Against this background, the key challenges for infrastructure policy in Indonesia at present fall into five main areas:
Level of investment Need for financial resources Bottlenecks
Responsiveness to the market Prices and subsidies.
Each of these will be discussed in turn.
LEVEL OF INVESTMENT
The overall investment needs in the infrastructure sector in any particular country may be roughly estimated in various ways. Nevertheless, it has not proved easy to develop reliable techniques to determine the optimum level of investment in infrastructure with any degree of precision.
Overall political, regulatory and legal issues for the sector
Subsidy issues
Price
D E M A N D S U P P L Y Household
Large
Small
Other (socia, government, etc) Commercial
Large
Small Large
Small Industrial
Financial issues
Technical issues
Governance & management
Environmental issues
Maintenance & sustainability
Contracts, audit & corruption issues
Engineering Land
Internal resources (prices)
Public
Private Domestic Foreign
Domestic Foreign
Source: Author’s (2009)
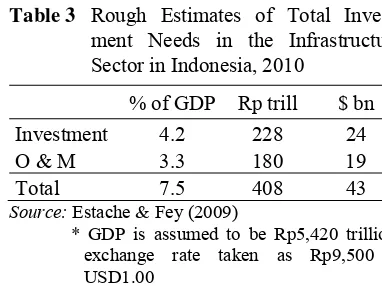
Table 3 Rough Estimates of Total Invest-ment Needs in the Infrastructure Sector in Indonesia, 2010
% of GDP Rp trill $ bn Investment 4.2 228 24
O & M 3.3 180 19
Total 7.5 408 43
Source: Estache & Fey (2009)
* GDP is assumed to be Rp5,420 trillion; exchange rate taken as Rp9,500 = USD1.00
* O & M = operations and maintenance
One broad approach is to look at the ratio of investment in infrastructure compared to overall GDP. A recent World Bank study by Estache and Fey (2007) provided a useful survey of different approaches along these lines. Estache and Fey concluded that the best that can be done is to provide rough estimates for different country types. For a country such as Indonesia, drawing on the Estache and Fey approach, it would seem that a total invest-ment of around 7.5% of GDP might be a reasonable target to aim for (with around 4.2% directed to new investment and perhaps 3.3% of GDP directed towards maintenance). These rough estimates suggest that around Rp 400 trillion (around $US 40 billion) might be an appropriate level to spend on infrastructure in Indonesia in 2010 (Table 3).
Several things need to be said about these estimates. First, perhaps surprisingly, these figures are actually somewhat smaller than levels of public investment suggested by a major World Bank study (1992) on infrastructure in Indonesia in the early 1990s. In a report on Indonesia: a strategy for infrastructure development, the World Bank noted that average levels of public investment in Indonesia during the 1980s had been sustained at a level close to 9% of GDP and suggested that during the 1990s, a slightly higher level of up to 10% of GDP would be 'prudent.'
Second, a level of total spending (including O&M) of around 7.5% of GDP appears to be roughly the level of total spending on infrastructure in Indonesia in recent years (World Bank 2007). In the mid 1990s, before the major economic crisis in 1997-98, infrastructure investment in Indo-nesia (excluding O & M) was at the level of around 5.6% of GDP. However, following the crisis, spending on infrastructure (excluding O & M) fell sharply to an extreme low of 1-2% (World Bank 2004). More recently, according to World Bank estimates, total investment levels including O & M recovered somewhat to an average of around 8% between 2002-2004 (World Bank007).
Third, unfortunately, it is difficult to get reliable official estimates of the current (2009) level of spending on infrastructure in Indonesia because different departments and agencies issue different sets of data which are hard to reconcile. However, judging from the recent statements issued by government agencies, it would seem that the level of spending between 2002-2004 has been maintained in real terms, and has perhaps even increased. A rough estimate, therefore might be that total spending on infrastructure (public and private combined) in Indonesia is perhaps currently around Rp 450 trillion. This is equivalent to around $200 per capita –a useful benchmark figure which we will return to below.
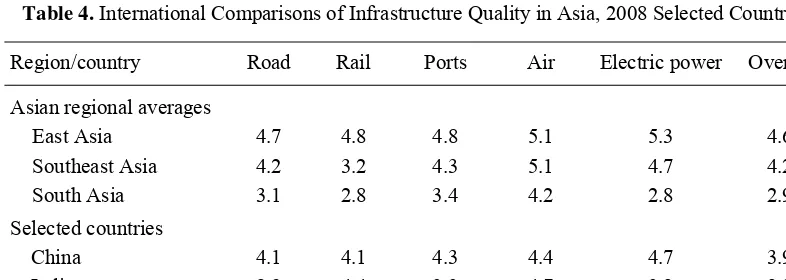
standards between India and Indonesia is less marked except for the rail sector where significant improvements have been introduced in recent years in India.
But a third, and perhaps more useful way of trying to judge whether significant increases in infrastructure investment are needed is take a 'bottom up' rather than 'top down' approach. A bottom up approach focuses mainly on the specific needs in each sector, and on identifiable projects which promise good returns in terms of the results of careful cost-benefit studies.
The need for careful cost-benefit studies of major infrastructure projects can hardly be over-emphasised. The use of cost-benefit analysis for major projects in Indonesia, it seems, is still not common. The amount of detailed information made available to investors for individual projects during recent infrastructure summits in Indonesia has generally been very limited indeed. Yet individual projects are the building blocks of sectoral investment plans. High-quality cost-benefit studies of projects facilitate comparisons of both projects within a sector, and between one sector and another (say, between the transport and power sectors). The results of cost-benefit studies for major
projects, especially at the national level, should be made public.
However, despite the shortage of good project data, there is much evidence to suggest that key infrastructure bottlenecks exist in Indonesia. Problems arising from infrastruc-ture shortages are well-known: electricity shortages are common in both Java and the Outer Islands; road congestion is rapidly becoming worse; there are frequently complaints from exporters about problems they face in accessing international markets because of poor port facilities; numerous problems in the water supply and sanitation sector are reported in the media; and the rail sector is in urgent need of improvement, especially in Java.
Thus while it is not possible to decide on a precise figure to indicate the ideal amount of investment in infrastructure in Indonesia on an annual basis, it seems clear that the needs are great. It is relevant, too, to note that the current level of investment in infrastructure per person in Indonesia (about $200 per annum) is far below the level of around $2,000 per person per annum which is common in rich OECD countries. The gap in both quality and quantity between Indonesia and richer nations appears to be widening.
Table 4. International Comparisons of Infrastructure Quality in Asia, 2008 Selected Countries
Region/country Road Rail Ports Air Electric power Overall
Asian regional averages
East Asia 4.7 4.8 4.8 5.1 5.3 4.6
Southeast Asia 4.2 3.2 4.3 5.1 4.7 4.2
South Asia 3.1 2.8 3.4 4.2 2.8 2.9
Selected countries
China 4.1 4.1 4.3 4.4 4.7 3.9
India 2.9 4.4 3.3 4.7 3.2 2.9
Indonesia 2.5 2.8 3.0 4.4 3.9 2.8
n.a. = not available.
Scores: 1 = underdeveloped; 7 = extensive and efficient by international standards.
Looking to the future, the risk is that restricted levels of investment in infrastructure will restrain overall economic growth. Commenting on this matter, Resosudarmo and Yusuf recently (2009: 310) noted that the stagnation of infrastructure development over an extended period casts doubt over the possibility of Indonesia achieving high and sustained economic growth in the future. It is unlikely that the government's target rate of growth of 7% annual growth by 2014 can be achieved unless there is a dramatic improvement in the level of investment in infrastructure. Although there have been some signs of improvement in recent years, there is still a long way to go before Indonesian infrastructure investment returns to pre-crisis [1997-98] levels.
NEED FOR FINANCIAL RESOURCES
If we assume as a target figure that financial resources of around Rp 400 trillion (about $40 billion) would be needed to support a desirable level of investment in the infrastructure sector in 2010 (Table 3 above), the question arises of where would the finance to support this investment might come from? An outline of the main sources of finance is shown in Figure 3 (right hand side). The size of each of these potential flows is important. Data from the period 2002-2004 (Table 5, which presents data in 2004 prices) is helpful in considering the policy issues involved in this matter. A number of important public policy issues arise.
First, on the face of it, the expenditure estimates presented in Table 5 seem difficult to reconcile with the earlier suggestion that perhaps around Rp 450 trillion is currently being spent (in total, all sources combined) in Indonesia. There appear, however, to be two main reasons for the difference. One is that the estimates are, in each case, presented in current prices, so inflation between the earlier period and 2009 accounts for part of the difference. Another part of the explanation is
that it would appear that spending on infrastructure in the 2002-2004 period, not long after the 1997-98 economic crisis, was probably especially subdued and there has probably been a real increase since that time.
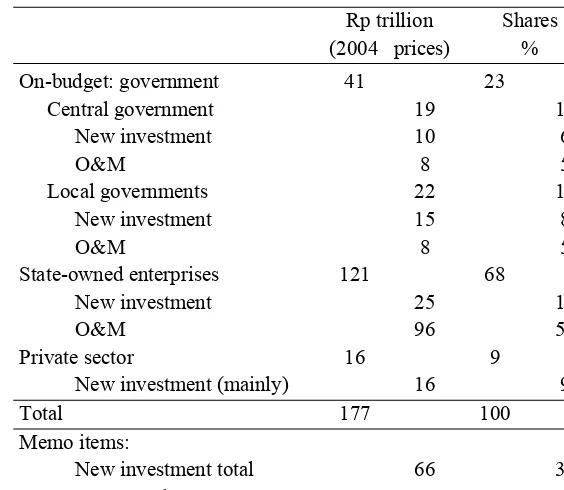
Second, as Table 5 suggests, it seems clear that the main supply of financing for infrastructure investment is likely to come from domestic sources. This conclusion is consistent with experience, for example, from China where over 90% of financing for domestic investment (including infrastructure) appears to have come from domestic sources in recent years. The lesson for policy-makers is clear: it is domestic savings and investment flows which are important, and national investment policies should give priority to improving domestic savings and investment markets.
Third, the data in Table 5 indicates the key role that retained earnings in state-owned enterprises (such as Pertamina, Perusahaan Listrik Negara (PLN), PN Kereta Api, and so on) play in financing investment flows in infrastructure. In total, in the 2002-2004 period, SOEs (state-owned enterprises) provided nearly 70% of the financing for infrastructure spending. Clearly, the role of the management of SOEs, and the pricing policies determined by regulatory agents in Indonesia, is very important in influencing the flow of investment for infrastructure. In order to improve the flow of financing for infrastructure, better policies are needed both for the management of SOEs and for determining the overall regulatory (including prices).
enterprises, such as the PDAMs (perusahaan daerah air minum or regional drinking water enterprises) are regarded as very important by local consumers. However, numerous reports suggest that the PDAM enterprises are often badly managed and that reform is needed this sector.
Finally, it is worth noting that in an overall sense, financing provided by the private sector was rather unimportant (around 10% of total flows) as a source of infra-structure finance. This fact is significant because both in Indonesia and in other developing countries in the Asian region, policy-makers are inclined to look hopefully to the private sector to provide finance for investment in infrastructure. Indeed, in recent years, official statements from some governments in developing countries in Asia have often implied that well over half of planned investments in infrastructure will perhaps be financed from the private sector.
Optimistic hopes of this kind seem generally to be misplaced at present. Unless policies towards private sector investment in infrastructure are quite significantly reformed, the prospects of encouraging sizeable amounts of private sector investment into infrastructure are not encouraging.
It needs to be recognised that finance provided by the private sector – in PPP (public-private partnership) deals or the like – is often hard to manage, and often has hidden costs. Experiences during the 1990s led both governments and private investors in the water and sanitation sector in countries such as the Philippines and Indonesia to be mutually unhappy with the agreements that had been entered into (McIntosh 2003). Indonesia's experience during the 1990s in attempting to promote private investment in the power sector is another case study of these sorts of difficulties. In a survey of the experience between 1990 and 1997 in which the PLN signed 26 agreements worth over $13 billion
Table 5. Infrastructure Spending in Indonesia, 2002-2004 (Average)
Rp trillion Shares
(2004 prices) %
On-budget: government 41 23
Central government 19 11
New investment 10 6
O&M 8 5
Local governments 22 12
New investment 15 8
O&M 8 5
State-owned enterprises 121 68
New investment 25 14
O&M 96 54
Private sector 16 9
New investment (mainly) 16 9
Total 177 100
Memo items:
New investment total 66 37
O&M total 112 63
with private (mostly foreign-led) consortia, Wells (2007) emphasises how unsatisfactory the process was. Wells concluded that there are many lessons to be learned from the experience but:
If Indonesia can do no better in new arrangements, privatization is simply too costly. Borrowed funds and state ownership, with all their own problems, would be preferable.
Another important source of finance, in principle, is concessionary international borrowings, especially from well-known multilateral organisations such as the World Bank and the Asian Development Bank (ADB). During the 1970s and 1980s, until the economic crisis of 1997-98, Indonesia undertook large-scale borrowings from these organisations. Indeed, for many years, Indonesia was the regularly the largest borrower from the ADB, outstripping even China and India by significant margins. Total loans extended by the ADB to Indonesia over the 40-year period 1966-2006, for example, amounted to $21.5 billion, compared to total loans to China and India of $17.9 billion and $16.4 billion respectively (ADB 2007). At the time, these borrowings seemed appropriate because Indonesia needed both the capital and the technical assistance that accompanied the loans.
But since the Asian economic crisis in 1997-98, Indonesian policy-makers have been cautious about accessing finance from international agencies. Recently, for example, both China and India have increased their borrowings from the ADB while Indonesia has become more restrained. In 2006, China and India borrowed a total of $1.5 billion and $1.3 billion respectively from the ADB while Indonesia's borrowings were a relatively modes $710 million. On one hand, remem-bering the bitter experiences of the crisis, it is understandable that there should be concerns in Indonesia about any increases in international debt. On the other hand,
Indonesia needs to access all sources of useful capital to support increased investment, including investment in infrastructure. On balance, it seems most unfortunate that in recent years, Indonesian policy-makers have been reluctant to borrow from international development banks such as the World Bank and the ADB. These development banks offer support for high-quality projects at relatively low cost. The reluctance on the part of Indonesian policy-makers to borrow from the World Bank and ADB for infrastructure projects needs to be reconsidered.
BOTTLENECKS
While it is true that infrastructure projects cannot proceed without finance, one view amongst some groups of policy-makers in Jakarta in recent years has been that 'finance is not the problem' in the infrastructure sector. In support of this argument they have pointed to numerous cases of underexpenditure on infrastructure projects, and especially to the many other non-financial difficulties which seem to delay many infrastructure projects. What, then, are the non-financial bottlenecks which hold back infrastructure investment in Indonesia? What can be done to overcome these problems?
There appear to be important non-financial difficulties in at least four main areas: access to land; project design; legal and regulatory uncertainty; and coordination problems.
acquisition problems, especially for road and highway construction, are common in many countries. And many of the difficulties that occur in Indonesia are, in principle similar to the difficulties that occur elsewhere: speculation in land is common in Indonesia with the result that prices can jump sharply, well beyond project budgets, as soon as plans for road projects begin to be discussed.
Difficult land problems exist in the Outer Islands as well. Access to land in the Outer Islands is generally subject to approvals from local (and perhaps provincial) governments. Following the steps towards sweeping decentralisation in the late 1990s, many kabu-paten governments became become active in regulating use of local land (and raising local revenues) through the issue of permits. Many investors have reported that obtaining local approvals has become very time-consuming and leads to delays in project planning. To complicate matters, large areas of land are, in principle, in areas designated as protected forests. One recent estimate, for example, was that over 70% of the potential sites of geothermal projects in Indonesia lie within protected forest areas.
Authorities in Jakarta recognise that obtaining access to land is a major problem in the infrastructure sector. Various steps have been taken to ease some of the main bottlenecks. In 2009, for example, it was announced that the government will take steps to improve access to land for potential infrastructure investors. Nevertheless, expe-rience in many other countries suggests that overcoming land access issues will not be easy. Further reforms in legal arrangements relating to access to land, and in regulation of land markets, seem certain to be needed to encourage increased investment in infra-structure.
The shortage of good design documents for infrastructure projects is a second bottleneck, especially for private sector investors. Investors considering the provision
of large sums of funding (perhaps Rp 1 trillion, around USD 100 million, or more) will usually need to be convinced that all aspects of project design – technical, legal, economic, financial, environmental, and so on -- have been considered before they will be prepared to invest. Large-scale investors, therefore, require extensive project documen-tation which sets out all key aspects of projects in detail. Yet few of the main projects offered to local or international investors in Indonesia appear to be accompanied by adequate project documentation. Some of the websites esta-blished to support several of the recent infrastructure summits appeared to have been designed to provide project documentation – yet often, the relevant pages were either blank, or supplied very little information! This approach is not consistent with a policy of attracting substantial amounts of private sector funding into infrastructure. If public sector authorities wish to attract private partners to participate in infrastructure projects offered for tender or for financing in Indonesia, then much more attention needs to be given to the preparation of high-quality project documen-tation.
A third crucial factor limiting investments in infrastructure are the uncertainties in the political, legal and regulatory environment. The regulatory environment, essentially, sets the rules of the game (aturan main) for all actors (investors, producers, and consumers) in the relevant sector so is extremely important in influencing market incentives. Legal and regulatory environments naturally vary greatly across different parts of the overall infra-structure sector in Indonesia: regulatory arrangements for rail in Java, for example, are quite different to arrangements in place for long-distance bus services in the Outer Islands. However, despite these differences, there are several main problems which tend to restrict investment and market development: The overall legal environment in Indonesia
disagreed legal issues to court, and even when issues reach court, cases can take a long time to be decided; this means, in turn, that it is difficult to rely on the legal system to settle disagreed issues within the regulatory environment.
The law is often ill-defined, badly out-of-date, or unpredictable; the 2002 national Electricity Law, for example, was over-turned on controversial grounds by the constitutional court in 2004, leading to several years of additional uncertainty in the power sector until a new law was passed in 2009.
Regulatory agencies themselves are often weak because they lack adequate budgets and staff, and often provide unsatisfactory regulatory guidance to market actors in any particular sector.
Political interference, both in the work of regulatory agencies and more directly, in the management and operations of infrastructure enterprises, adds to uncertainty in infra-structure sector. Fourth, difficulties in policy coordination contribute to, and reinforce, legal and regulatory uncertainties. The implemen-tation of a large infrastructure project typically involves dozens of government agencies, often at central, provincial, and kabupaten or kotamadya levels. But policy coordination between different agencies in Indonesia is frequently hard to arrange. There is often political and administrative rivalry between agencies and between different levels of government. Furthermore, coordination arrangements between Jakarta and the regions have been complicated since the decen-tralisation policies introduced during the past decade.
In an effort to respond to coordination problems of this kind, various attempts have been made to introduce 'one stop shop' facilities in government agencies across Indonesia. While these recent efforts at
simplification are welcome, 'one stop shop' initiatives have a long history in Indonesia stretching back to the 1970s or earlier. It would be helpful to have an evaluation of past efforts of this kind to help guide current efforts at simplification. Essentially, what is required is careful and thorough reform of the regulatory environment across the Indonesian public sector. Experience in other countries – in both developed and developing countries – indicates that substantial reform and simpli-fication of the public sector regulatory environment is possible but that it needs strong commitment and support at both the political and administrative level (Schiavo-Campo 2000; Stein 2005). Without this kind of support, reform efforts tend to lose momentum and become ineffective. However, no government in Indonesia since Indepen-dence in 1945 has shown the will to initiate and press on with sustained reform of the regulatory environment in the Indonesian public sector.
RESPONSIVENESS TO THE MARKET
As noted earlier, a marked feature of the supply of infrastructure services in Asia is the existence of sharply segmented markets. For convenience, it is useful to consider these as the L (modern, formal) and S (small scale, informal) sectors.
Box 2: Examples of Unsatisfactory Supply of Infrastructure Services to Small-scale Consumers
Sector Problem Solution
Electricity Small amounts of electricity (less than 1 kWh per day) are not available
Provision of minimum packages of electricity, perhaps through cooperatives or targeted outsourcing of supply to small-scale private sector providers
Roads, local transport
Local footpaths, gutters, water channels, footbridges, and stairways are poorly supplied in urban kampung and, especially, in desa in rural areas
Provision of small-scale infrastructure facilities through the development of a widespread infrastructure microproject program
Water Poor consumers in kampongs must rely on unauthorised and expensive water deliveries provided by private retailers in informal markets; in desa, water is often in short supply
Improved supply of public facilities such as standpipes in kampong and tanks and wells in desa; more active cooperation with private sector suppliers
Sanitation Large numbers of users must dispose of waste in unsatisfactory and unhygienic ways
Greatly increased provision of well-maintained community facilities, including in cooperation with the private sector
Long-distance transport
Buses and interisland ferries are often severely overcrowded and unsafe
Improvement of terminal and docking facilities for public transport; easier conditions for entry by new suppliers combined with regulatory emphasis on safety
Source: Author’s (2009)
In principle, the solution to many of these problems is relatively straightforward. Market structures in infrastructure sectors need to be designed to ensure that government-owned utilities and other suppliers in the formal sector face pressures to downsize their services and tailor their products to meet the simple needs of consumers in the S sector. In addition, there needs to be much more reliance on private sector providers of infrastructure services; private sector providers are often willing to experiment with innovative ways of meeting needs in the S sector in ways that government-owned utilities seem to find it difficult to do.
One important implication of this approach needs to be noted: an excessive emphasis by infrastructure suppliers in the formal sector on the provision of high-quality and sophisticated infrastructure (such as, for example, on the provision of airports instead of footpaths and bicycle paths) can become a
barrier to access for lower-income S con-sumers. High quality goods and services are usually expensive to provide. Unless large subsidies are provided, high quality services provided in the formal L sector will generally be too expensive for low-income groups. Because of this, it is often infrastructure suppliers in the informal sector in developing Asia who best meet the needs of the mass market by supplying simple products rather than sophisticated ones.
PRICES AND SUBSIDIES
services be kept low – could be achieved more effectively in other ways.
In considering a subsidy program for infrastructure, it is helpful to bear in mind that government regulators who set infrastructure prices tend to use the following simple equation as a guideline for policy:
p = c – s
Where p = the unit price of a service (say, Rp 1,300 per kWh for electricity), c=cost of production (say, Rp 2,000 per kWh), and s = the subsidy per unit (say, Rp 700 per kWh).
This equation reminds us that if an important objective of public policy is to keep p as low as possible, then this objective can be achieved in two ways – either through making s large (that is, by providing large subsidies), or by reducing the level of c (that is, by finding ways of reducing costs of production). While it is certainly possible (depending on budget constraints) for policy-makers to provide subsidies if they chose to do so, experience in many countries indicates that by far the better long-term policy is to concentrate on reducing costs of production. Policy-makers need to bear in mind that ultimately, it is the costs of production (c) in an industry which are the most important element of policy to focus on rather than the level of subsides (s).
Before considering what might be done to reduce costs of production (c), some of the implications of a large subsidy program should be noted. These include the following:
Subsidies to infrastructure, especially for transport (through fuel subsidies) and power, tend to favour wealthy (L) consumers because low-income (S) groups receive few benefits from the subsidies Low prices send the wrong economic
signals to both consumers and producers; consumers are encouraged to over-consume while investors and producers are
discouraged from increasing the supply of infrastructure services
Low prices and insufficient subsidies mean that the government utilities (and other providers) who supply infrastructure services often try to save money on O & M costs (operations and maintenance), thus increasing the risks of unreliable and unsafe services
Large costs for government budgets, thus reducing the ability of governments to supply other services (such as schools, health clinics, agricultural support pro-grams, and so on).
What, then, is the alternative to the provision of subsidies? International expe-rience suggests that often, the causes of poor performance in the infrastructure sector lie in the incentives facing suppliers of services. The key principles set out in the major World Bank report on Infrastructure for development published in the 1990s remain a sound guide to policy reform in most parts of the infra-structure sector (World Bank 1994). To ensure efficient, responsive supply of infrastructure services, incentives for providers need to be changed through the use of three main instruments – commercial management; heal-thy competition, and consumer involvement. Improved regulatory arrangements would help greatly in introducing these changes. In summary, the principles for reform in these three areas are the following:
Infrastructure should be managed like a commercial business, not like a govern-ment bureaucracy. Infrastructure providers should be encouraged to become pro-market, consumer-responsive agencies. But amongst other things – which con-sumers need to accept – pro-market regu-latory agencies need to have sufficient financial independence to set prices to cover reasonable costs.
possible. Healthy competition provides benefits to consumers by providing greater choice, and provides incentives to producers to reduce costs.
Consumers and other stakeholders should be given a strong voice. Consumers and other users should be represented in the planning and supply of infrastructure services. Producers should be expected to meet transparent key performance indi-cators which provide all stakeholders with measurable methods of evaluating the level of service provided in the infrastructure sector.
It is no accident that the sector that has generally adopted these principles in deve-loping countries in Asia – telecommunications – has witnessed very rapid growth in the past decade. The telecommunications sector has been largely driven by highly competitive market principles, and has generally responded very effectively to the mass market in developing Asian countries with supplies of consumer-oriented packages which combine appropriate products (mobile phones, internet cafes) at affordable prices. If similar principles can be applied in other main parts of the infrastructure sector – in power, transport, and in water supply and sanitation – then the prospects for much-needed rapid growth in infrastructure in developing countries in Asia are good.
REFERENCES
ADB (Asian Development Bank), 2007. Annual Report 2006. Manila: Asian Deve-lopment Bank.
ADB and ADBI, 2009. Infrastructure for a Seamless Asia. Manila & Tokyo: Asian Development Bank & Asian Development Bank Institute.
Estache, Antonio and Marianne Fay, 2007. 'Current Debates on Infrastructure Policy', World Bank. Policy Research Working Paper, 4410, November.
McIntosh, Arthur C., 2003. Asian Water Supplies: Reaching the Urban Poor. Manila: Asian Development Bank and International Water Association.
OECD, 2008. Indonesia: Economic Assess-ment. Paris: Organisation for Economic Cooperation and Development.
Resosudarmo, Budy P., and Arief A. Yusuf., 2009. 'Survey of recent developments', Bulletin of Indonesian Economic Studies, 45(3), 287-315.
Schiavo-Campo, Salvatore and Pachampet Sundaram, 2000. To serve and to pre-serve: improving public administration in a competitive world. Manila: Asian Development Bank,
Stein, Ernesto, 2006. The politics of policies: economic and social progress in Latin America 2006 report, Washington DC & Cambridge MA: Inter-American Develop-ment Bank & Harvard University.
United Nations, 2009. World economic and social survey 2009: promoting develop-ment, saving the planet. New York: Department of Economic and Social Affairs.
Wells, Louis T., 2007. 'Private power in Indonesia', Bulletin of Indonesian Econo-mic Studies, 43(3), 2009, 341-363.
World Bank, 1992. Indonesia: a Strategy for Infrastructure Development, June 22, Report No. 9677-IND.
World Bank, 1994. World Development Report 1994: Infrastructure for Develop-ment. Washington: Oxford University Press for the World Bank.
World Bank, 2004. Indonesia: Averting an Infrastructure Crisis: a Framework for Policy and Action. Washington: Oxford University Press for the World Bank. World Bank, 2007. Spending for development: