COMPARING INDEPENDENT COMPONENT ANALYSIS WITH PRINCIPLE
COMPONENT ANALYSIS IN DETECTING ALTERATIONS OF PORPHYRY COPPER
DEPOSIT (CASE STUDY: ARDESTAN AREA, CENTRAL IRAN)
S. Mahmoudishadi*, A.Malian, F. Hosseinali
Dept. of Geomatics Engineering, Shahid Rajaee Teacher Training University (S.mahmoodishad, A.malian, F.hosseinali)@srttu.edu
KEY WORDS: Independent Component Analysis, Principle Component Analysis, ASTER, Alteration, Copper Deposit, Ardestan
ABSTRACT:
The image processing techniques in transform domain are employed as analysis tools for enhancing the detection of mineral deposits. The process of decomposing the image into important components increases the probability of mineral extraction. In this study, the performance of Principal Component Analysis (PCA) and Independent Component Analysis (ICA) has been evaluated for the visible and near-infrared (VNIR) and Shortwave infrared (SWIR) subsystems of ASTER data. Ardestan is located in part of Central Iranian Volcanic Belt that hosts many well-known porphyry copper deposits. This research investigated the propylitic and argillic alteration zones and outer mineralogy zone in part of Ardestan region. The two mentioned approaches were applied to discriminate alteration zones from igneous bedrock using the major absorption of indicator minerals from alteration and mineralogy zones in spectral rang of ASTER bands. Specialized PC components (PC2, PC3 and PC6) were used to identify pyrite and argillic and propylitic zones that distinguish from igneous bedrock in RGB color composite image. Due to the eigenvalues, the components 2, 3 and 6 account for 4.26% ,0.9% and 0.09% of the total variance of the data for Ardestan scene, respectively. For the purpose of discriminating the alteration and mineralogy zones of porphyry copper deposit from bedrocks, those mentioned percentages of data in ICA independent components of IC2, IC3 and IC6 are more accurately separated than noisy bands of PCA. The results of ICA method conform to location of lithological units of Ardestan region, as well.
* Corresponding author
1. INTRODUCTION
The porphyry copper deposit model is surrounded by multiple zones of mineralogy (the interior, middle and outer zones). Each of mineralogy zones is found with one of the alteration zones. The outer and middle mineralogy zones have propylitic and argillic-altered rocks, respectively (Karimpour and Saadat, 1989). Figure 1 displays the alteration zones of porphyry copper deposits. Different rock compositions cause the variations of outer propylitic zone in the world, but epidote, chlorite, and carbonate minerals are common constituents. Middle argillic zone can be indicated by kaolinite, muscovite and alunite mineral (Mars and Rowan, 2006).
Advanced Spaceborne Thermal Emission and Reflection Radiometer (ASTER) data are expected to be useful in geological mapping and mineral resources exploration (Abrams et al., 2002; Amer et al., 2016; Pour and Hashim, 2011; Pour et al., 2015). This sensor offers multispectral coverage at high spatial resolutionfor geological applications due to the distinct and significant spectral features in shortwave infrared (SWIR) and thermal infrared (TIR) regions (Amer et al., 2016; Mars and Rowan, 2006; Pour and Hashim, 2011; Pour et al., 2015).
The results of studies on image processing techniques have illustrated that transforming the original image bands into another framework is useful in depicting the target featuresand special feature extraction in transform domainthat can be more clear than in spatial domain (Stathaki, 2011). Most transformations used in image processing decompose the images into important local components, i.e. unlocking the basic image structure and finding the important components for dimensionality reduction; Hence, the choice of the transformation is very important (Stathaki, 2011). Principal Component Analysis (PCA) can identify uncorrelated vector bases (Stathaki, 2011). PCA finds a linear transformation with least squares which follows the normalized orthogonal eigenvector of the data covariance matrix. While PCA uses only second order statistics, Independent Component Analysis (ICA) looks for components that are statistically independent rather than uncorrelated; thus, it requires statistics of orders higher Figure 1. Alteration zones in monzonite porphyry copper
than the second (Lee et al., 2000). It can be concluded that Independent Component Analysis is an extension of PCA technique.
Nowadays; advanced remote sensing systems use multispectral remote sensors and the image processing in geological investigations. Studies in Sarcheshmeh and Meiduk on ASTER data showed that the image processing techniques such as PCA method have appropriate results to identify the iron oxides and vegetation in the VNIR subsystem and hydrothermal alteration mineral zones associated with porphyry copper deposit in SWIR subsystem. Location of the new prospects with the optimum results can be identified by the image processing techniques in these areas (Hashim et al., 2010; Pour and Hashim, 2011). As another sample, study in southern Masule, Iran using ETM+ image showed that applying ICA transformation led the sampling program in finding unknown lithology and dikes (Gholami et al., 2012).
Mapping spatial distribution of propylitic and argillic zones and distinguishing them from bedrocks is quite interesting to produce surface section of the study area with the possibility of exploring copper deposit. Accordingly, in this study, PCA and ICA method (extended PCA) are tested on ASTER data to investigate the Surface signs of porphyry copper deposit in the northeast of Esfahan province, the central part of Ardestan. Finally, the performance of the proposed method is verified in detecting the salient features in region bedrock.
2. MATERIALS AND METHODS 2.1 Study Area
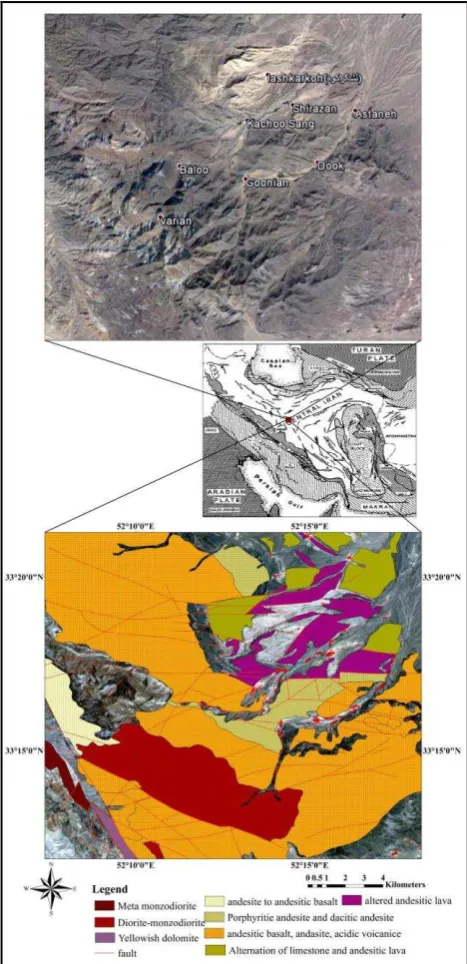
Many well-known porphyry copper deposits are discovered in NW-SE trending Central Iranian Volcanic Belt in Iran (Pour and Hashim, 2011). The study area of Ardestan, located in 52° 08 24.00 to 52°17 24.00 Easting, 33°12 36.00 to 33°20 24.00 Northing, mostly consist of volcanic pyroclastic rocks related to the Eocene and Oligocene geologic epoch in a geologic period of Paleogene. Intrusions of diorite and monzonite located in Dorojin mountain and Marbin village, are most important intrusion in the study area. Most outcrops belong to volcanic activity of post-Eocene and pre-Eocene era in the study area. These outcrops are a combination of calc-alkaline and contains of rhyolite, dacite, andesite and basaltic andesite minerals. The geologic map of the region in Figure 2, illustrates the location of study area, rock units, and general structural geology.
2.2 Specification of ASTER Data
The value of ASTER data has been demonstrated for enhanced geological mapping in many types of research (Abrams et al., 2002; Amer et al., 2016; Hashim et al., 2010; Rowan and Mars, 2003). Level 1B Aster data, used in this study, are calibrated and resampled so as to correct for radiometric and geometric errors. This level of image data is usually generated in UTM projection system in swath orientation using bi-cubic convolution resampling (Abrams et al., 2002).
The Aster image of the study area had been already pre-processed and geo-referenced to UTM zone 39N projection with the WGS-84 datum. Crosstalk effect causes the deviations from correct reflectance in false absorption features and distortion of diagnostic signatures in 4, 5 and 9 bands detectors on the shortwave infrared subsystem. As a result, image processing leads to misidentifying minerals (Pour and Hashim,
2012). In the current research, Crosstalk correction was applied on ASTER SWIR bands and Internal Average Relative Reflection (IARR) method was used for atmospheric correction of ASTER data. This method is a preferred calibration technique that is recommended for mineralogical mapping because it does not require the prior knowledge of samples collected from the field (Pour and Hashim, 2011).
Figure 2. Geological Map of Igneous Rocks in Ardestan area (with RGB color composite of 1, 2 and 3 ASTER bands).
2.3 Principal Component Analysis (PCA)
Linear generative model is used in Principal Component Analysis (PCA) to identify uncorrelated vector bases. These bases are applied to compress and optimize image data (Pour and Hashim, 2011; Stathaki, 2011). This procedure is based on this assumption that the data structure can be described by multi-dimensional normal distribution. Although PCA can
identify uncorrelated vector bases, their basis vectors are statistically dependent (F. Samadzadegan, 2014). Statistical analysis of PCA is a useful method for lithological study and mapping the spatial distribution of specific materials based on their spectral properties in the VNIR and SWIR bands (Pour and Hashim, 2011).
2.4 Independent Component Analysis (ICA)
One of the criteria that makes ICA different from other transformation techniques is this assumption that the basis vectors or equivalently the transform coefficients are statistically independent. ICA can identify statistically independent basis vectors in a linear generative model (Hyvärinen et al., 2001). This transform is based on the non-Gaussian assumption of the independent sources, and uses higher-order statistics to reveal desired features. ICA transformation can distinguish features of interest even when they occupy only a small portion of the pixels in the image that may be buried in the noisy bands of PC rotation during data whitening (Hyvärinen and Oja, 2000; Stathaki, 2011).
3. STATISTICAL ANALYSIS METHODS Some of the Porphyry copper deposits related to tectonic regions are formed in monzonite and porphyry granodiorite rocks. Alteration zones of potassic, propylitic, argillic and sericitic are founded in monzonite rock (Karimpour and Saadat, 1989). In this study, the alteration zones of argillic and propylitic are examined. A PC image with the greatest difference in eigenvalues obtaining from diagnostic reflective and absorptive bands of the mineral is used to select the perfect PC image. The positive eigenvalue in the reflective band of mineral from PC band caused the mineral bearing pixels become bright whileother pixels will be dark if the eigenvalue for enhanced target mineral is negative. Accordingly, the eigenvector of each PC band would help to identify the perfect PC image which has spectral information associated with target mineral.
PCA produced PC images together with a table of statistical factors. This table contains covariance matrix on all nine reflective bands of ASTER image with eigenvectors and eigenvalues of image bands obtained from PCA. Table 1 presents statistical information to investigate PC image components. Selecting the appropriate data is carried out based on laboratory spectra of muscovite, kaolinite, alunite, calcite, epidote, chlorite and pyrite resampled to ASTER VNIR and SWIR bands. In this study, laboratory spectra of pyrite were checked, since it is the most important mineral in outer and middle zones of mineralogy for copper deposits (Karimpour and Saadat, 1989).
In Figure 3 it is evident that low and high reflectance of pyrite minerals occur in VNIR and SWIR region respectively, so pyrite can be identified as bright pixels in PC2 (Figure4).
Eigenvector Band 1 Band 2 Band 3 Band 4 Band 5 Band 6 Band 7 Band 8 Band 9 Eigen values (%)
Band1 -0.25 -0.24 -0.24 -0.37 -0.36 -0.38 -0.36 -0.38 -0.36 93.72
Band2 -0.55 -0.50 -0.52 0.09 0.17 0.18 0.16 0.22 0.21 4.62
Band3 0.35 0.26 -0.51 -0.60 -0.06 -0.10 0.12 0.32 0.24 0.9
Band4 0.35 0.12 -0.56 0.31 0.25 0.28 -0.16 -0.53 -0.09 0.32
Band5 -0.24 0.07 0.24 -0.42 0.26 0.20 -0.20 -0.45 0.59 0.2
Band6 0.16 -0.32 0.15 -0.38 0.28 0.15 0.62 -0.25 -0.39 0.09
Band7 0.52 -0.66 0.11 0.02 -0.34 0.18 -0.18 0.02 0.31 0.07
Band8 0.10 -0.09 -0.06 0.25 0.07 -0.74 0.37 -0.28 0.39 0.06
Band9 -0.18 0.23 -0.07 0.07 -0.71 0.32 0.46 -0.27 0.14 0.04
Figure 4. PC2 image for the Ardestan scene; ellipsoidal polygons separate bright pixels as probable locations of the pyrite mineral.
Minerals of propylitic alteration zone such as epidote, calcite, and chlorite show maximum and minimum absorption in bands 5,6,7 (2.14_ 2.25 μm) and 8 and 9 (2.29_2.43 μm) (Figure 5). PC6 image has a positive contribution from bands 5, 6 and 7 and negative contribution from band 8 and 9. As a result, bright pixels in PC6 band indicate extensive propylitic alteration (Figure 6).
Kaolinite, alunite and muscovite show major absorption in bands 5, 6 and 7 (2.14–2.28 μm) (Figure 7). Analysing eigenvector in table 1 indicate that PC3 can be an indicator of
argillic alteration zone. Figure 8 illustrates the minerals of argillic zone based on laboratory spectra of minerals.
Therefore, in this study, PC 2, 3 and 6 components of ASTER bands were used to produce RGB color composite for demonstrating the alteration of porphyry copper deposits. Alteration areas are revealed in blue for the argillic zone and yellow and green for propylitic zone and pyrite mineral, respectively. Pyrite with propylitic zone manifested in red color from sedimentary rocks that are surrounded by altered andesitic lava in fault region. In another location, pyrite is identified in diorite and monzodiorite surrounded with the argillic zone (Figure 9).
Figure 8. PC3 image for Ardestan scene; ellipsoidal polygons separate bright pixels as probable locations of epidote, calcite, and chlorite minerals.
Figure 7. Laboratory spectra of muscovite, kaolinite and alunite resampled to ASTER bandpasses. These minerals, which are common in argillic alteration, have 2.14 and 2.28 μm absorption features (Clark et al., 1993; Mars and Rowan, 2006).
Figure 6. PC6 image for Ardestan scene; ellipsoidal polygons separate bright pixels as probable locations of epidote, calcite, and chlorite minerals.
Figure 5. Laboratory spectra of epidote, calcite, and chlorite resampled to ASTER bandpasses. These minerals are typically associated with propylitic alteration and display 2.14-2.25 and 2.29-2.43 μm absorption features (Clark et al., 1993; Mars and Rowan, 2006).
ICA has produced IC images with statistic factors similar to the PCA method. However, independent components can help to distinguish argillic and propylitic zones from igneous bedrocks. Figure 10 is an RGB color composite of IC2, IC3, and IC6 images.
A geological report of the region made by ZAPCE company was used to validate the results of this study. According to the aforementioned report, detected promising areas by means of remote sensing technique, match precisely with the location of mineralized zones of the region (Figure 11-B).
4. ASSESSMENT AND CONCLUSION
This study used ASTER data with the aim of detecting alterations that help mineral exploration related to porphyry copper deposits. Investigating the ASTER VNIR and SWIR bands and image processing techniques in the transform domain to separate alteration mineral from bedrock as well as analysis of the formation of alteration zones, can be an efficienttool for more accurate identification of mineral position.
Principal component analysis and independent component analysis transformation techniques carried out for alteration zones mapping, show appropriate results in studying spectral features of minerals related to porphyry copper deposit in Ardestan region. Analyzing the laboratory spectral signatures of minerals was used to identify the major reflective and absorptive bands and select the PC band from eigenvector of PCA method. PC2, PC3, and PC6 were found useful for detecting pyrite, argillic and propylitic alterations respectively. ICA method has eigenvector statistics similar to those of PCA method. Its components are independent; thus it can be assumed as an applicable and efficient method for extraction of mineral alteration from igneous lithological units. RGB color composite IC2, IC3 and IC6 detected the pyrite, argillic and propylitic zones from andesitic volcanic bedrock in the study area. In
addition to exploiting of a more detailed extraction procedure of linear structures, it is recommended that a study is performed on the role of topography in ICA to discover probable connections between the independent components. This method may contribute significantly to separate the outer mineralogy zones from mineral of alteration zones which can be useful from an economic point of view in identifying porphyry copper deposits.
Figure 10. A) RGB color composite of IC2, IC3 and IC6 images. The identified pyrites are related to argillic and propylitic as major minerals in mineralogy zones for copper deposits. B) Argillic alteration is revealed in margin bedrock. The propylitic alterations are surrounded by meta monzodiorite in sedimentary bedrock. There are faults in this area, causing lava to appear at the surface. The pyrite in diorite-monzodiorite intrusive rock is surrounded by argillic alteration, so copper is likely to increase in this position.
Propylitic
Argillic Argillic
Argillic
Argillic Argillic
Pyrite Figure 9. RGB color composite of PC2, PC3 and PC6 images
Figure 11. Geological validation of remote sensing results in localization of mineral zones. A) Field observation path on RGB color composite of IC 2, 3 and 6 image. B) Location of alteration zones revealed in PCA method.
ACKNOWLEDGEMENTS
This study was conducted as a part of the M.Sc. thesis at the Department of Geomatics Engineering, Faculty of Civil Engineering in Shahid Rajaee Teacher Training University. The authors are thankful to Mr. Honarvar in ZAPCE company and Mr. Baniadam in Geological Survey and Mineral Exploration of Iran (GSI) for providing geological data of the study area required for this investigation.
REFERENCE
Abrams, M., Hook, S., Ramachandran, B., 2002. ASTER User handbook, version 2. Jet propulsion laboratory 4800, 135. Amer, R., El Mezayen, A., Hasanein, M., 2016. ASTER spectral analysis for alteration minerals associated with gold mineralization. Ore Geology Reviews 75, 239-251.
Clark, R.N., Swayze, G.A., Gallagher, A.J., King, T.V., Calvin, W.M., 1993. The US Geological Survey, Digital Spectral Library: Version 1 (0.2 to 3.0 um). Geological Survey (US). F. Samadzadegan, F.M., B. Bidgoli, 2014. Data fusion in remote sensing, description and methods. Tehran university, Tehran, pp51-68 (In Persian) .
Gholami, R., Moradzadeh, A., Yousefi, M., 2012. Assessing the performance of independent component analysis in remote
sensing data processing. Journal of the Indian Society of Remote Sensing 40, 577-588.
Hashim, M., Pour, A.B., Marghany, M., 2010. Characterization of ASTER data for mineral exploration.
Hyvärinen, A., Karhunen, J., Oja, E., 2001. Independent Component Analysis.
Hyvärinen, A., Oja, E., 2000. Independent component analysis: algorithms and applications. Neural networks 13, 411-430. Karimpour, M., Saadat, S., 1989. Applied economic geology. Javid Publication, Mashhad, Iran, pp. 181-190 ( In Persian) . Lee, T.-W., Girolami, M., Bell, A.J., Sejnowski, T.J., 2000. A unifying information-theoretic framework for independent component analysis. Computers & Mathematics with Applications, 39(11), pp. 1-21.
Mars, J.C., Rowan, L.C., 2006. Regional mapping of phyllic-and argillic-altered rocks in the Zagros magmatic arc, Iran, using Advanced Spaceborne Thermal Emission and Reflection Radiometer (ASTER) data and logical operator algorithms. Geosphere, 2(3), pp. 161-186.
Pour, A.B., Hashim, M., 2011. Identification of hydrothermal alteration minerals for exploring of porphyry copper deposit using ASTER data, SE Iran. Journal of Asian Earth Sciences, 42(6), pp. 1309-1323.
Pour, A.B., Hashim, M., 2012. The application of ASTER remote sensing data to porphyry copper and epithermal gold deposits. Ore Geology Reviews, 44, pp. 1-9.
Pour, A.B., Hashim, M., Pournamdari, M., 2015. Chromitite Prospecting Using Landsat TM and Aster Remote Sensing Data. ISPRS Annals of the Photogrammetry, Remote Sensing and Spatial Information Sciences, 2(2), pp. 99.
Rowan, L.C., Mars, J.C., 2003. Lithologic mapping in the Mountain Pass, California area using advanced spaceborne thermal emission and reflection radiometer (ASTER) data. Remote sensing of Environment, 84(3), pp. 350-366.
Sillitoe, R.H., 1973. The tops and bottoms of porphyry copper deposits. Economic Geology, 68(6), pp. 799-815.
Stathaki, T., 2011. Image fusion: algorithms and applications. Academic Press, pp. 85-116.