• Tidak ada hasil yang ditemukan

Policy Paper

N/A
N/A
Protected

Academic year: 2017

Membagikan "Policy Paper"

Copied!
121
0
0

Teks penuh

(1)
(2)
(3)

AUTHORS

Indonesia Climate Change Sectoral Roadmap – ICCSR

Health Sector

Adviser

Prof. Armida S. Alisjahbana, Minister of National Development Planning/Head of Bappenas

Editor in Chief

U. Hayati Triastuti, Deputy Minister for Natural Resources and Environment, Bappenas

ICCSR Coordinator

Edi Effendi Tedjakusuma, Director of Environmental Affairs, Bappenas

Editors

Irving Mintzer, Syamsidar Thamrin, Heiner von Luepke

Synthesis Report

Coordinating Author for Adaptation

: Djoko Santoso Abi Suroso

Health Sector Report

Authors:

Budhi Setiawan, Supratman Sukowati, Juli Soemirat Slamet

Technical Supporting Team

Chandra Panjiwibowo, Hendra Julianto, Leyla Stender, Tom Harrison, Ursula Flossmann-Krauss

Administrative Team

(4)
(5)

ACKNOWLEDGMENTS

The Indonesia Climate Change Sectoral Roadmap (ICCSR) is meant to provide inputs for the next ive

year Medium-term Development Plan (RPJM) 2010-2014, and also for the subsequent RPJMN until

2030, laying particular emphasis on the challenges emerging in the forestry, energy, industry, agriculture,

transportation, coastal area, water, waste and health sectors. It is Bappenas’ policy to address these

challenges and opportunities through effective development planning and coordination of the work

of all line ministries, departments and agencies of the Government of Indonesia (GoI). It is a dynamic

document and it will be improved based on the needs and challenges to cope with climate change in the

future. Changes and adjustments to this document would be carried out through participative consultation

among stakeholders.

High appreciation goes to Mrs. Armida S. Alisyahbana as Minister of National Development Planning

/Head of the National Development Planning Agency (Bappenas) for the support and encouragement.

Besides, Mr. Paskah Suzetta as the Previous Minister of National Development Planning/ Head of

Bappenas who initiated and supported the development of the ICCSR, and Deputy Minister for Natural

Resources and Environment, Ministry of National Development Planning /Bappenas, who initiates and

coordinates the development of the ICCSR.

To the following steering committee, working groups, and stakeholders, who provide valuable comments

and inputs in the development of the ICCSR Health Sector document, their contributions are highly

appreciated and acknowledged:

Steering Committee (SC)

Deputy of International Cooperation, Coordinating Ministry for Economy; Secretary of Minister,

Coordinating Ministry for Public Welfare; Secretary General, Ministry of Health; Executive Secretary,

Agency for Meteorology, Climatology; Deputy of Economy, Deputy of Infrastructures, Deputy of

Development Funding, Deputy of Human Resources and Culture, Deputy of Regional Development

and Local Autonomy, National Development Planning Agency; and Chief of Secretariat of the National

Council for Climate Change.

Working Group Ministry of Health

Wan Alkadri, Budi Sampurno, Sri Endah S., Ann Natallia, Tutut Indra Wahyuni, Slamet, Mukti Rahadian,

Sonny Narou, Martini. M, Dirman Siswoyo, Agus Handito, Winarno

(6)

Hanan Nugroho, Jadhie Ardajat, Hadiat, Arif Haryana, Tommy Hermawan, Suwarno, Erik Amundito,

Rizal Primana, Nur H. Rahayu, Pungki Widiaryanto, Maraita, Wijaya Wardhana, Rachmat Mulyanda,

Andiyanto Haryoko, Petrus Sumarsono, Maliki

Grateful thanks to all staff of the Deputy Minister for Natural Resources and Environment, Ministry of

National Development Planning/ Bappenas, who were always ready to assist the technical facilitation as

well as in administrative matters for the inalization process of this document.

(7)

Remarks from Minister of National

Development Planning/Head of bappenas

We have seen that with its far reaching impact on the world’s ecosystems

as well as human security and development, climate change has emerged

as one of the most intensely critical issues that deserve the attention

of the world’s policy makers. The main theme is to avoid an increase

in global average temperature that exceeds 2˚C, i.e. to reduce annual

worldwide emissions more than half from the present level in 2050.

We believe that this effort of course requires concerted international

response – collective actions to address potential conl icting national

and international policy initiatives. As the world economy is now facing

a recovery and developing countries are struggling to fuli ll basic needs

for their population, climate change exposes the world population to

exacerbated life. It is necessary, therefore, to incorporate measures to

address climate change as a core concern and mainstream in sustainable development policy agenda.

We are aware that climate change has been researched and discussed the world over. Solutions have

been proffered, programs funded and partnerships embraced. Despite this, carbon emissions continue

to increase in both developed and developing countries. Due to its geographical location, Indonesia’s

vulnerability to climate change cannot be underplayed. We stand to experience signii cant losses. We will

face – indeed we are seeing the impact of some these issues right now- prolonged droughts, l ooding and

increased frequency of extreme weather events. Our rich biodiversity is at risk as well.

Those who would seek to silence debate on this issue or delay in engagement to solve it are now

marginalized to the edges of what science would tell us. Decades of research, analysis and emerging

environmental evidence tell us that far from being merely just an environmental issue, climate change will

touch every aspect of our life as a nation and as individuals.

Regrettably, we cannot prevent or escape some negative impacts of climate change. We and in particular the

developed world, have been warming the world for too long. We have to prepare therefore to adapt to the

changes we will face and also ready, with our full energy, to mitigate against further change. We have ratii ed

the Kyoto Protocol early and guided and contributed to world debate, through hosting the 13

th

Convention of

(8)

I am delighted therefore to deliver

Indonesia Climate Change Sectoral Roadmap,

or I call it ICCSR, with the

aim at mainstreaming climate change into our national medium-term development plan.

The ICCSR outlines our strategic vision that places particular emphasis on the challenges emerging in

the forestry, energy, industry, transport, agriculture, coastal areas, water, waste and health sectors. The

content of the roadmap has been formulated through a rigorius analysis. We have undertaken vulnerability

assessments, prioritized actions including capacity-building and response strategies, completed by

associated inancial assessments and sought to develop a coherent plan that could be supported by line

Ministries and relevant strategic partners and donors.

I launched ICCSR to you and I invite for your commitment support and partnership in joining us in

realising priorities for climate-resilient sustainable development while protecting our population from

further vulnerability.

Minister for National Development Planning/

Head of National Development Planning Agency

(9)

Remarks from Deputy Minister for Natural

Resources and Environment, bappenas

To be a part of the solution to global climate change, the government

of Indonesia has endorsed a commitment to reduce the country’s

GHG emission by 26%, within ten years and with national resources,

benchmarked to the emission level from a business as usual and, up to

41% emission reductions can be achieved with international support

to our mitigation efforts. The top two sectors that contribute to the

country’s emissions are forestry and energy sector, mainly emissions

from deforestation and by power plants, which is in part due to the fuel

used, i.e., oil and coal, and part of our high energy intensity.

With a unique set of geographical location, among countries on the

Earth we are at most vulnerable to the negative impacts of climate

change. Measures are needed to protect our people from the adverse effect of sea level rise, l ood,

greater variability of rainfall, and other predicted impacts. Unless adaptive measures are taken, prediction

tells us that a large fraction of Indonesia could experience freshwater scarcity, declining crop yields, and

vanishing habitats for coastal communities and ecosystem.

National actions are needed both to mitigate the global climate change and to identify climate change

adaptation measures. This is the ultimate objective of the

Indonesia Climate Change Sectoral Roadmap

, ICCSR.

A set of highest priorities of the actions are to be integrated into our system of national development

planning. We have therefore been working to build national concensus and understanding of climate

change response options. The

Indonesia Climate Change Sectoral Roadmap

(ICCSR) represents our long-term

commitment to emission reduction and adaptation measures and it shows our ongoing, inovative climate

mitigation and adaptation programs for the decades to come.

(10)

TAbLE Of CONTENTS

AUTHORS

i

ACKNOWLEDGMENTS

iii

Remarks from Minister of National Development Planning/Head of Bappenas

v

Remarks from Deputy Minister for Natural Resources and Environment, Bappenas

vii

Table of Contents

viii

List of Tables

xi

List of Figures

xii

Glossary

xiv

1 INTRODUCTION

1

1.1

Background

2

1.2

Objectives

2

1.3

Approaches

3

1.3.1

Scientiic Basis Approach

3

1.3.2 Participation of Stakeholders

4

2 PROBLEMS AND CHALLENGES IN THE HEALTH SECTOR

5

2.1

Health Sector Conditions and Problems

6

2.2

Challenges of Climate Change Impacts on the Health Sector

6

2.3

Potential Health Impacts due to Climate Change

7

2.3.1 Health Impact Analysis Method related to Climate Change

10

2.3.2 Malaria in Indonesia

12

2.3.3 Dengue Haemorrhagic Fever (DHF) in Indonesia

16

3 DEGREE OF VULNERABILITY OF THE HEALTH SECTOR

19

3.1

Understanding Vulnerability in the Health Sector

20

(11)

3.3

Sensitivity as Vulnerability Factor in the Health Sector

21

3.3.1 Welfare Status of the Population

21

3.3.2 Infant Mortality Rate

23

3.4

Adaptation Capacity as Vulnerability Factor in the Health Sector

23

3.4.1 Hospitals

24

3.4.2 Health Centers

25

3.4.3 Posyandu

26

3.4.4 Immunization Coverage

27

3.4.5 Health Manpower

28

3.4.6 Poskesdes

29

3.4.7 Polindes

30

3.4.8 Community Access Coverage to a Safe Water Resources and Sanitation

31

3.5

Vulnerability of Diseases Related to Climate Change in Indonesia

33

3.5.1 Vulnerability to Malaria

34

3.5.2 Vulnerability to Dengue Haemorrhagic Fever

36

3.5.3 Vunerabillity to Diarrhea

37

4 RISK OF CLIMATE CHANGE TO THE HEALTH SECTOR

39

4.1

Understanding Risk to Climate Change

40

4.2

Calculation Result of Climate Change Risk

40

4.2.1 Malaria Risk

42

4.2.2 DHF Risk

43

4.2.3 Diarhea Risk

44

4.3

Risk Reducing Activities

46

5 DIRECTIONS AND PHASES OF FUTURE INTEGRATION OF

(12)

5.2

Program Phases for Adaptation in the Health Sector

53

5.3

Health Program Phase, Period 2010-2014

55

5.4

Health Program Phase, Period 2015-2019

57

5.5

Health Program Phase, Period 2020-2024

59

5.6

Health Program Phase, Period 2025-2029

60

References

69

APPENDIX A

71

APPENDIX B

75

APPENDIX C

81

(13)

LiST Of TAbLES

Table 2.1

Hazards of Climate Change as related to the Health Sector

34

Table 2.2

Climate-Related Disaster to Health

36

Table 3.1

Vulnerability Computation to Malaria in Indonesia

33

Table 3.2

Computation of Vulnerability to DHF in Indonesia

35

Table 3.3

Computation of Vulnerability to Diarrhea in Indonesia

38

Table 4.1

Malaria, Diarrhea, and DHF Risk to Climate Change in

45

Table 4.2

Malaria, Diarrhea, and DHF Risk Due to Climate Change in Papua

46

Table 4.3

Role Sharing between individual, government and institution in reducing health

(14)

LiST Of fiGURES

Figure 2.1

Relationship Between Various Main Global Environmental Changes which

Inluence Human Health, Including Climate Change (Mc Michael, 2003)

Figure 2.2

Pathways by which Climate Change Affect Human Health

Figure 2.3

Schematic Diagram of Relationship Pattern of Climate Inluence on

Health, Impacting Directly as well as Inluenced by the Modiication of the

Environmental Conditions, Social, and Health System.

Figure 2.4

Malaria Cases in Java and Bali, Year 1989- 2007

Figure 2.5

Malaria Outbreak Map (KLB), 2004-2005

Figure 2.6

Map of Malaria Endemy, 2007

Figure 2.7

Map of Malaria Cases Distribution, 2008

Figure 2.8

Distribution of Malaria Vector Species in Indonesia (Source: Ministry of Health, RI)

Figure 2.9

DHF Morbidity and Mortality in Indonesia, 1997- 2007 Expressed as IR and

CFR (Ministry of Health RI, 2009)

Figure 2.10

IR of DHF Distribution Map, Year 2008

Figure 3.1

Map of Population Density 2008(Source: BPS, 2009)

Figure 3.2

Map of Level of Population Welfare Status (Source: BPS, 2009)

Figure 3.3

Map of IMR Distribution in Indonesia

Figure 3.4

Map of Hospital Distribution in Indonesia, 2008

Figure 3.5

Distribution of Health Centers in Indonesia, 2008

Figure 3.6

Distribution Map of Posyandu, 2008

Figure 3.7

Map of the Spread of Immunization Coverage, 2008

Figure 3.8

Distribution Map of Private Medical Practice, 2008

Figure 3.9

Spread of Midwives Practice Location 2008

Figure 3.10

Distribution Map of Distribution of Poskesdes, 2008

Figure 3.11

Polindes Distribution, 2008 (Source: Analysis of Data Ministry of Health RI)

7

8

9

13

14

14

15

13

17

(15)

Figure 3.12

Percentage of Community Access to Safe Water Supply

Figure 3.13

Distribution of Sanitation Coverage

Figure 3.14

Map of Vulnerability to Malaria

Figure 3.15

Map of Vulnerability to Dengue Haemorrhagic Fever

Figure 3.16

Map of Vunerability to Diarrhea

Figure 4.1

The Process of Risk Assessment

Figure 4.2

Risks of Climate Change Impact to IR of Malaria

Figure 4.3

Risk of Climate Change Impacts to Dengue Haemorrhagic Fever

Figure 4.4

Risk of Impacts Due to Climate Change to IR of Diarrhea

Figure 4.5

Scheme of Risk Reduction Related to Hazard and Vulnerability

Figure 5.1

The Process of Planning, Design, and Implementation of Health Program due

to Climate Change

Figure L.1

Decrease of Water Availability, from upper left clockwise: periode of

2010-2015, 2015-2020, 2020-2025, and 2025-2030 (Oman Abdurahman, 2009)

Figure L.2

Risk of Flooding, from upper left side, clockwise: period 2010-2015, 2015-2020,

2020-2025, dan 2025-2030 (Oman Abdurahman, 2009)

Figure L.3

Risk of Drought, from the upper left side,clockwise: period 2010-2015,

2015-2020, 2020-2025, and 2025-2030 (Oman Abdurahman, 2009)

Figure L.4

Risk of Landslide, from the upper left side, clockwise: periode 2010-2015,

2015-2020, 2020-2025, and 2025-2030 (Oman Abdurahman, 2009).

32

33

35

37

38

41

42

43

44

47

53

76

77

78

(16)

GLOSSARy

AMI

Annual Malaria Incidence

API

Annual Parasite Incidence

CDF

Cummulative Distribution Frequency

CFR

Case Fatality Rate

DBD

Demam Berdarah

Dengue

EID

Infectious Diseases

ENSO

El Nino Southern Oscilation

FCCC

Framework Convention on Climate Change

FGD

Focus Group Discussion

GCM

Global Circulation Model

GHCN

Global Historical Climatological Network

GIS

Geography Information System

GPCC

Global Precipitation Climatology Center

GRK

Gas Rumah Kaca

IPCC

Intergovernmental Panel on Climate Change

ISPA

Infeksi Saluran Pernapasan Akut

(Respiratory System Infection)

KIE

Komunikasi, Informasi, dan Edukasi

(Communication, Information,

and Education)

NSDA

Neraca Sumber Daya Air

(Water Resource Balance)

RAN MAPI

Rencana Aksi Nasional Mitigasi dan Adaptasi Perubahan Iklim

RENJA

Rencana Kerja

(Work Plan)

RENSTRA

Rencana Strategis

(Strategic Planning)

RKP

Rencana Kerja Pemerintah

(Government Work Plan)

(17)

RPJPD

Rencana Pembangunan Jangka Panjang Daerah

(Regional Long Term

Development Planning)

RPJP

Rencana Pembangunan Jangka Panjang

(Long Term Development

Planning)

RPJMN

Rencana Pembangunan Jangka Panjang Menengah Nasional

(National

Medium Term Development Planning)

RPJPN

Rencana Pembangunan Jangka Panjang Nasional

(National Long

Term development Planning)

SARS

Serve Acute Respiratory Syndrom

SIG

Sistem Informasi Geograis

(Goegraphic Information System)

SLR

Sea Level Rise

SPL

Suhu Permukaan Laut

(Sea Level Temperature)

UNCED

United Nations Conference on Environment and Development

UNEP

United Nations Environmental Program

UNFCCC

United Nations Framework Convention on Climate Change

WHO

World Health Organization

WMO

World Meteorological Organization

BAKOSURTANAL

Badan Koordinasi Survey dan Pemetaan Nasional

(National

Coordination Agency for Survey and Mapping)

BMKG

Badan Meteorologi, Klimatologi, dan Geoisika

(Meteorology,

Climatology and Geophysic Agency)

LAPAN

Lembaga Penerbangan dan Antariksa Nasional

(National Institute of

Aeuronatics and Space)

(18)
(19)

iNTRODUCTiON

(20)

1.1

Background

It is well known that climate change is happening and become a threat in various sectors including helath

sector in Indonesia. Climate change hazard threat in Indonesia can affect health directly or indirectly which

could cause morbidity, psychological impact, refuge, and aven mortality. Climate change hazard related to

health sector including extreme temperature and precipitation, lood and drought increase, vector-borne

disease change, surface ozone increase, increased malnutrition cases, and increase of disaster related to

climate.

Scientiic proofs show that climate change and variability could affect vector-borne disease epidemiology.

In Indonesia there are 3 main diseases which need to be studied, which are dengue fever (DBD), malaria,

and diarrhea because of their wide spread and intensity. The negative effect of climate change and

variability would strongly suppress low-income population with limited access to health institution. Thus,

making the low-income population with limited health access the most vulnerable population group to

health impact due to climate change

To overcome climate change impact to health sector we need adaptation steps supported by high realization,

mental attitude, and behavior of the population. These health sector adaptation steps must be integrated

into national development planning. At national level, Bappenas has begun compiling

“Roadmap of

Mainstreaming Climate Change Issue into 2010-2030 Indonesia National Development Plan”

(abbreviated to “Indonesia Climate Change Sectoral Roadmap/ICCSR”). Health sector roadmap consists

of scientiic study of climate change issue, impact, vulnerability, and risk which will be faced, and health

sector adaptation strategy needed by Indoensia. The inal result is the directon and steps to be taken for

adaptation to climate change in the health sector.

To assist in preparing and presenting the Roadmap, Indonesia will be devided into 7 areas, which are: 1)

Sumatera island and its surrounding 2) Jawa , Madura, Bali islands and their surroundings 3) Kalimantan

island and its surroundings, 4) Sulawesi island and its surroundings, 5) Nusa-tenggara islands (area of the

NTB and NTT provinces), 6) Maluku islands, and 7) Papua island (the Indonesian part of Papua island,)

and its surroundings.

1.2

Objectives

Taking into account the background conditions, as described before, the objectives of this climate change

roadmap preparation in the health sector are as the followings:

1) To identify future problems and challenges in the health sector due to climate change. Solution to

the problems will be through identiication of existing response capacity, strength, weaknesses, and

(21)

2) To identify vulnerabilities in the health sector in facing hazards due to climate change, information

can be obtained as far as possible based on qualitative and quantitative analyses such that it can be

put into a form of spatial distribution for each study area;

3) To identify impacts or risk description of the health sector due to hazards faced and known

vulnerability;

4) To identify direction of policies and steps to be taken to integrate adaptive capacity within the health

sector towards climate change needed to minimize vulnerabilities and risks.

Adaptation program will be made stepwise within the development phases of 5-year duration starting

with 2010 up to 2030 (2010-2014, 2015-2019, 2020-2024, 2025-2029);

1.3

Approaches

Approaches/methodologies used in this report was covers scientiic analysis (

scientiic basis

) and participative

in nature, which involve all stakeholders. Both methods was used simultaneously and inter-related. The

irst method,

scientiic basis

, was used together with an approach at the macro-level, and adapted to the

existing data. The second method is a bottom-up approach, used to collect data and information. The

bottom–up approach is done by conducting Focus Group Discussion (FGD) with related institutions.

1.3.1 Scientiic Basis Approach

Scientiic analysis includes all data collecting, analysis and synthesis of several data and information

(documents, consultations, discussions) as follows:

Internal data and information, will be obtained through internal discussions with a sub-team,

scientiically based, and with other sectors;

National data and information will be obtained from existing records and maps at several institutions

like the Ministry of Health, BAKOSURTANAL, BMKG, and LAPAN;

International data and information, like research documents, reports from institutions like the IPCC,

UNFCCC, WHO, UNDP, and others will be obtained through internet search.

(22)

1.3.2

Participation of Stakeholders

Participation of stakeholders was accomplished through followings:

Consultations and discussions with bureaucrats, researchers, and experts at related institutions,

especially at the Ministry of Health.

(23)

PRObLEMS AND

CHALLENGES iN THE

HEALTH SECTOR

(24)

2.1

Health Sector Conditions and Problems

As mentioned in the Long-Term Development Plan (RPJP) of the Ministry of Health, 2005-2025, the

society’s health condition in Indonesia is faced with low general public health conditions which can be

seen by the high infant mortality rate (IMR), high mortality of children below 5 years, high maternal

mortality rate (MMR) and high percentage of children below 5 with low and bad nutritional status.

Moreover, disparity of health status varies quite a lot among different social-economic status, between

different areas, and between gender and income groups. Indonesia also has limited number and quality

of health manpower, and lowly skilled health technicians, besides limited inacing sources and unoptimal

health inance allocation.

The Medium-Term Development Plan (RPJM) of the Ministry of Health, 2004-2009, mentioned that

the main problems within the health sector are the disparity of the state of health, the multiple burden

of disease, the low performance and quality of public health services and the public traditional behaviour

which does not support the pattern for a healthy hygienic life (PHBS). Besides, there are also the low

general public health conditions, the unequal distribution of and the unaffordable health service facilities,

the limited number and quality of health manpower, and lowly skilled health technicians, the unequal

distribution of health manpower within a population, the low degree of health status of the poor, and

constraints such as unavailability of stock and unaffordability of raw materials for drugs, pharmaceutical

supply and health instruments. A more detailed explanation on health sector problems in Indonesia can

be seen in Appendix A.

2.2

Challenges of Climate Change Impacts on the Health Sector

Health problems in Indonesia as described before, will receive additional and more intense stressor from

global climate change. Global change of the environment which inluence humans , among others are

(25)

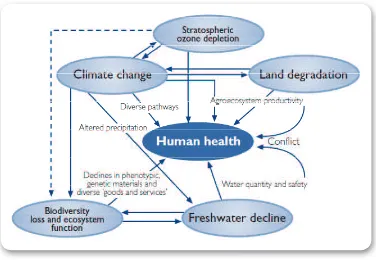
Figure 2.1

Relationship between Various Main Global Environmental Changes which Inl uence

Human Health, Including Climate Change (Mc Michael, 2003)

Environmental change and its impact to health can be explained as follows: (1) the thinning of the ozon

layer in the stratosphere, increases the risk of developing skin cancer, (2) the rise in ambient temperature

due to climate change also increases the ozon concentration in the troposphere, one of the main air

pollutants causing respiratory diseases, (3) the loss of biological diversity could also inl uence health,

due to the increasing scarcity of raw materials for drugs from plants, (4) land degradation and change

of ecosystem functions could change the spread of disease vectors, (5) the decreasing water resources,

causing limited access to clean water and healthy sanitation.

2.3

Potential Health Impacts due to Climate Change

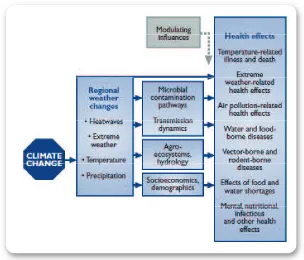
Figure 2.2 explained the l ow of climate change impact to health. Climate change will affect the change

(26)

Figure 2.2 Pathways by which Climate Change Affect Human Health

(Patz et al, 2000)

The hazards of climate change to health are marked by (1) signii cant increase of rainfall at certain

months with increasing variability in certain region, (2) decrease of rainfall in dry months, while in the

wet season, rainfall will increase, (3) increase in the average ambient temperature. Climate change hazard

affects health through microbe contamination and dynamics transmission. Besides, climate change hazard

affects the agro-ecosystem and hydrology, and socio-economy and demography. These processes are also

affected by modulation of social, economy, and development condition.

Climate change impact to health can be in the form of temperature rise effect to morbidity and mortality,

disasters due to extreme weather, air pollution increase, water and food borne disease, and vector and rat

borne disease.

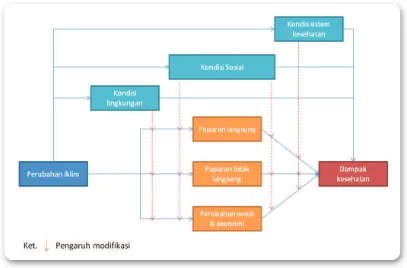
Based on the process, the hazards of climate change could inl uence human health in two ways, directly

and indirectly (Figure 2.3):

(1) Directly. Such as direct exposure to seasonal change (temperature, rainfall, sea level rise, and the

increase of weather extreme frequency).

(2) Indirectly. The mechanism of climate change inl uence the changing environmental factors such as

the changes in the quality of the environment (water, air, and food quality), the thinning of ozon layer,

scarcity of water resources, loss of ecological functions, and degradation of lands which eventually

inl uence human health. Indirect impact such as (a) mortality and morbidity due to diseases. Climate

(27)

vector and rat borne disease. (b) Malnutrition, could happen due to a disturbance in food sources

and harvest.

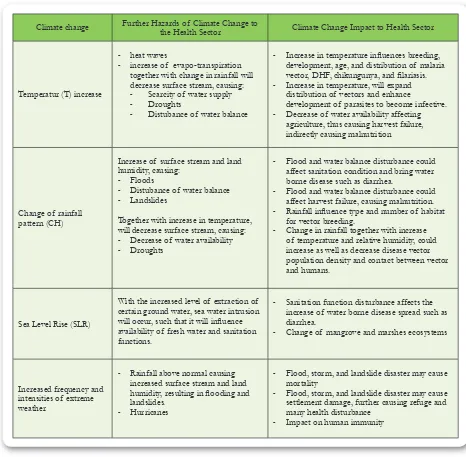
In detail, climate change impact potential to health sector is shown in Table 2.1. It is explained that

further climate change hazard and mechanism could affect health sector. Furthermore, the hazard could

affect health directly or indirectly. Detailed climate change hazard such as rainfall change and remperature

rise is given in Appendix B.

Figure 2.3

Schematic Diagram of Relationship Pattern of Climate Inl uence on Health, Impacting

Directly as well as Inl uenced by the Modii cation of the

(28)

Table 2.1 Hazards of Climate Change as related to the Health Sector

Climate change

Further Hazards of Climate Change to

the Health Sector

Climate Change Impact to Health Sector

Temperatur (T) increase

-

heat waves

-

increase of evapo-transpiration

together with change in rainfall will

decrease surface stream, causing:

-

Scarcity of water supply

-

Droughts

-

Distubance of water balance

-

Increase in temperature inl uences breeding,

development, age, and distribution of malaria

vector, DHF, chikungunya, and i lariasis.

-

Increase in temperature, will expand

distribution of vectors and enhance

development of parasites to become infective.

-

Decrease of water availability affecting

agriculture, thus causing harvest failure,

indirectly causing malnutrition

Change of rainfall

pattern (CH)

Increase of surface stream and land

humidity, causing:

-

Floods

-

Distubance of water balance

-

Landslides

Together with increase in temperature,

will decrease surface stream, causing:

-

Decrease of water availability

-

Droughts

-

Flood and water balance disturbance could

affect sanitation condition and bring water

borne disease such as diarrhea.

-

Flood and water balance disturbance could

affect harvest failure, causing malnutrition.

-

Rainfall inl uence type and number of habitat

for vector breeding.

-

Change in rainfall together with increase

of temperature and relative humidity, could

increase as well as decrease disease vector

population density and contact between vector

and humans.

Sea Level Rise (SLR)

With the increased level of extraction of

certain ground water, sea water intrusion

will occur, such that it will inl uence

availability of fresh water and sanitation

functions.

-

Sanitation function disturbance affects the

increase of water borne disease spread such as

diarrhea.

-

Change of mangrove and marshes ecosystems

Increased frequency and

intensities of extreme

weather

-

Rainfall above normal causing

increased surface stream and land

humidity, resulting in l ooding and

landslides.

-

Hurricanes

-

Flood, storm, and landslide disaster may cause

mortality

-

Flood, storm, and landslide disaster may cause

settlement damage, further causing refuge and

many health disturbance

-

Impact on human immunity

2.3.1

Health Impact Analysis Method related to Climate Change

As mentioned in the previous chapter, climate change impact to health consists of (1) increase of disaster

potential, (2) malnutrition, (3) increase of disease events. The followings are methods to analyze climate

change impact to the three aforementioned impacts.

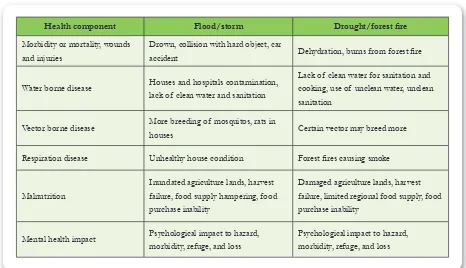
The i rst impact is the increasing disaster potential related to climate change which has wide health

(29)

condition (map of disaster-prone area, climate-related disaster history), (3) identify current population

characteristic (social, economy, culture) and adaptation capacity (health facilities, sanitation, and supportive

infrastructures) as current (baseline) adaptation condition (4) identify current disaster strategies, policies,

and preventions as current (baseline) policy condition, (5) estimate climate-related disaster using certain

scenario, (6) analyze climate-related disaster impact to health.

Table 2.2 Climate-Related Disaster to Health

Health component

Flood/storm

Drought/forest i re

Morbidity or mortality, wounds

and injuries

Drown, collision with hard object, car

accident

Dehydration, burns from forest i re

Water borne disease

Houses and hospitals contamination,

lack of clean water and sanitation

Lack of clean water for sanitation and

cooking, use of unclean water, unclean

sanitation

Vector borne disease

More breeding of mosquitos, rats in

houses

Certain vector may breed more

Respiration disease

Unhealthy house condition

Forest i res causing smoke

Malnutrition

Inundated agriculture lands, harvest

failure, food supply hampering, food

purchase inability

Damaged agriculture lands, harvest

failure, limited regional food supply, food

purchase inability

Mental health impact

Psychological impact to hazard,

morbidity, refuge, and loss

Psychological impact to hazard,

morbidity, refuge, and loss

(30)

change impact to disease vector change, such as malaria, at least we need data of (1) population scenario,

(2) variability and climate change scenario, (3) human’s immunity to vector infection and vector borne

level to humans, (4) vector’s immunity probability to environmental factors: temperature and rainfall, (5)

vector transmition potential: vector capacity, vector reproduction level, vector quantity density, vector

incubation period, and temperature range during incubation.

Even so, currently, disease vector distribution data in Indonesia is only limited in a few speciic areas in

Indonesia, thus there is no complete national data in all of Indonesia. So, in this study, we use relevant

disease event data as proxy. Proxy is data which is considered to represent a parameter with certain level

of accuracy. In this case, disease event is used as disease vector distribution proxy. In this study, we used

incidence rate (IR) data of 3 infectious diseases which are malaria, dengue fever, and diarrhea, because

the three are the main diseases which have high incidence rate in Indonesia.

2.3.2 Malaria in Indonesia

Scientiic evidences have shown that increasing malaria could be identiied as potential impact of climate

change (M. van Lieshout dkk, 2004). For example, in an area with limited health facility, temperature rise

will increase vector-borne disease because of temperature rise and increase of rainfall and surface water

will lengthen the transmission season in endemic areas. Theoretically, malaria distribution is limited by

mosquito vector tolerance to climate. Mosquito distribution will be limited if the condition is too dry (small

rainfall and dry surface water). Besides, malaria distribution is limited by mosquito’s biological condition

in surviving and its condition to incubate in the form of infected agent in infected population.

Malaria distribution also depends on social, economic, and environmental factor of infected human

population such as (1) global climate change, (2) land use change, (3) drug and vector resistency, (4)

population mobility, (5) social-economic change, (6) health service condition, (7) political and war

situation, (8) economic crisis and poverty.

In 2007 the number of positive malaria was 311.789 cases. Furthermore, malaria in Indonesia re-emerges,

and being inluenced by malaria termination program intensity and several environmental factors. Cases

(31)

Figure 2.4 Malaria Cases in Java and Bali, Year 1989- 2007

Source SubDit P2 Malaria, Direktorat Jendral P2PL

Malaria cases outside Java and Bali islands, expressed as AMI, during the period of 1995-2003 l uctuates

sharply from time to time, starting from 20 ‰ (1995) up to 22,7‰ (2002). Then, it becomes stable for

a period of 2003-2004, i.e., 21,80 ‰ and 21,20‰. Further on, it increases again in 2005 to become

24,75‰ and decreases again during 2006-2007, i.e., from 23,98‰ to become 19,67‰ (Ditjen P2LP,

Ministry of Health RI 2008).

(32)

Figure 2.5 Malaria Outbreak Map (KLB), 2004-2005

Source: SubDit P2 Malaria, Directorate General P2PL

Figure 2.6 Map of Malaria Endemy, 2007

Source : SubDit P2 Malaria, Directorate General P2PL

Sumber: Dirjend P2&PL

(33)

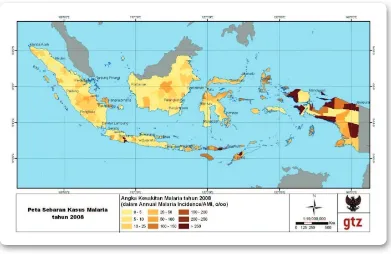
Figure 2.7 Map of Malaria Cases Distribution, 2008

(Source: Analysis of Data, Ministry of Health, RI)

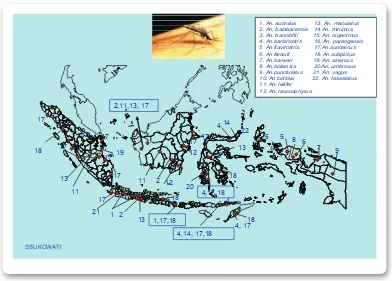
To see the potential of mosquito distribution transmission we need to analyze the type and density

of malaria mosquito distribution in Indonesia (see Figure 2.8). Figure 2.8 shows the distribution of

malaria vector spesies in Indonesia. The western part of Indonesia, the

Anopheles

species are oriental,

among others,

An. aconitus, An. sundaicus, An. subpictus, An. balabacensis, An. leucosphyrus, An. punctulatus, An.

koliensis, An. longirostris

and

An. bancrofti.

Some oriental species migrate to the east, such that at the Papua

area the oriental group can also be found, and so are some Australasian groups that migrate to the west

of Lydekker line. Mosquitoes, in Maluku are a mix of both oriental and Australasian groups.

The distribution of

Anopheles

mosquitoes is not only based on geography of zoo-distribution, but is also

inl uenced by high altitude, land use, and the ecosyistem. In Java-Bali, there are 4 species of malaria

vector, namely,

An. sundaicus

as a vector at the coastal areas,

An. aconitus

at stratii ed rice paddies areas,

An.

balabacensis

in vegetated mountainous areas, and

An. maculatus

in mountainous area sparsely vegetated.

Malaria vector density at coastal areas (

An. sundaicus

and

An. Subpictus)

will increase at the beginning of

the dry season, and the peak density will occur about more than 2-3 months after the dry season ended.

During the dry season, the water level at i sh ponds, lagoons, and other waterways around the coast will

(34)

Figure 2.8 Distribution of Malaria Vector Species in Indonesia (Source: Ministry of Health, RI)

2.3.3 Dengue Haemorrhagic Fever (DHF) in Indonesia

Dengue haemorrhagic fever has spread to all cities throughout Indonesia since the 1968. In 1968 IR of

DHF reported cases were 0,05/100.000 population with a case fatality rate (CFR) of 41,3%, thereafter,

outbreaks frequently occur in several areas. In 1998 an outbreak with 72.133 cases, and a mortality rate

of 2%, was the most severe outbreak ever happened since the i rst DHF case was reported in Indonesia.

In 2004 a national outbreak occured, in 40 districts and cities in 12 provinces with a number of cases of

28.077, with mortality of 381 cases, and CFR of 1.36%. Figure 2.9 shows DHF increases continuosly for

the period of 1999-2007 reaching an IR of 71,78 per 100.000 population, even if there had been a case

of decrease in 1998.

All year round throughout 2007, 11 provinces suffered from DHF outbreaks, namely, West Java, South

Sumatera, Lampung, DKI Jakarta, Central Java, East Kalimantan, Central Sulawesi, East Java, Banten,

and DI Yogyakarta. In 2007 the number of cases were 156.767, an IR of 71,18/100.000 population,

and fatality of 1570 cases, and CFR of 1,00 %. In 2008 the number of district/city that suffer from

outbreaks decreases (Ditjen PP-PL, Ministry of Health 2008).

(35)

Figure 2.9 DHF Morbidity and Mortality in Indonesia, 1997- 2007 Expressed as IR and CFR

(Ministry of Health RI, 2009)

Directorate general of communicable disease control and environmental sanitation (P2PL Ministry of

Health RI) in 2008 mentioned that DKI Jakarta, was the province with the highest IR for DHF of 392,94

per 100.000 population, followed by Bali (IR=193,18) and East Kalimantan, IR=193,15 per 100.000

population. The province with the highest mortality number throughout 2007 was Papua, with a CFR =

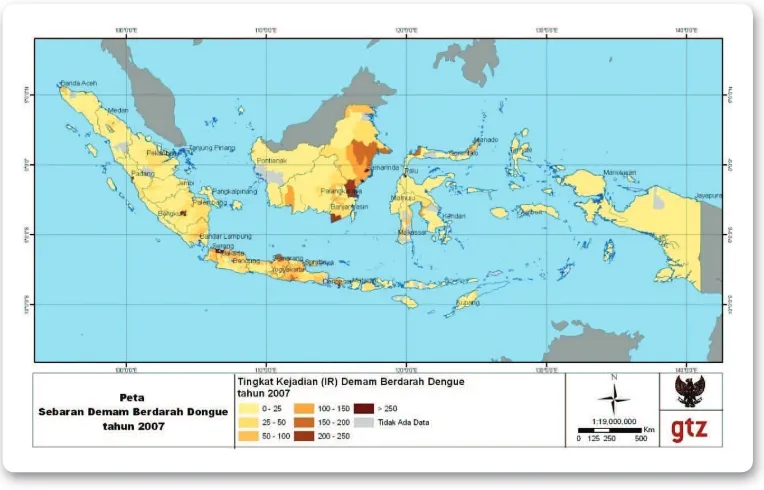
3,88%, followed by the province of North Maluku, and Bengkulu, each with CFR of 2,55%. Figure 2.10

showed the distribution of DHF incidence rates for the year 2008.

Until now, drugs and vaccine for DHF are still unavailable, such that prevention and control of DHF are

conducted through vector control, a program known as 3M plus and optimized through communication

to change people’s behavior based on existing local way of life. To decrease fatality rate, technology of

case treatment plan need to be improved. (RPJM Ministry of Health).

IR AND CFR OF DHF PER YEAR IN INDONESIA

(36)
(37)

DEGREE Of

VULNERAbiLiTy Of

THE HEALTH SECTOR

(38)

3.1

Understanding Vulnerability in the Health Sector

Vulnerability is a function of exposure, sensitivity

,

and adaptive capacity. Therefore, there are three

variables of vulnerability in its analysis, i.e., Exposure (E), Sensitivity (S) and Adaptive Capacity (AC)

.

Vulnerability (V) function can be formulated as follows:

Where:

E : exposure, described as a physical aspect of vulnerability. In this case exposure will be stressed

on physical aspects of impacts due to climate change, such as level of population density, level of

isolation of a settlement area and location, design, and the availability of material for important

infrastructure construction (

Affeltranger, et al.

2006).

S : Sensitivity is deined as a potential level of ability to response to a kind of climate change

condition, such as the spread of malfunction, structure and composition within an ecosystem

(UNEP and WMO, 1996).

AC : Adaptation capacity is referred to as the potential capability of a system to adapt to an impact or

inluence due to climate change. AC is very much inluenced by the vulnerablity of the population/

area impacted by hazards of climate change (Bohle

et al.

, 1994; Downing

et al.

, 1999; Kelly and

Adger, 1999; Mileti, 1999; Kates, 2000).

Vulnerability identiication is needed, not only for information on risks, but also for detection from past events/

experiences, what aspects are contributing to a certain risk, such that AC actions/program can be implemented

to actually reached the stated objectives. Vulnerability can be obtained by the addition of all vulnerabilities at

each component, related to each hazard, at the vulnerability analysis for each existing hazard.

3.2

Exposure as a Vulnerability Factor in the Health Sector

As mentioned in section 3.1, exposure is described as a physical aspect of vulnerability. In relation to this

understanding, E will stress on all physical aspects impacted by climate change such as level of poplation

density, the level of isolation of a settlement location, location, design, and the availability of material for

important infrastructure construction. The more densely populated an area, the lesser the environmental

carrying capacity will become. As a result, access to hygienic natural resources such as safe water supply,

clean air, and environmental sanitation will become less as well. Threats of population explosion to

health have become very important for health status.

(39)

density in Indonesia is distributed as shown in Figure 3.1. As can be seen, the island of Java has the

highest density level.

Figure 3.1 Map of Population Density 2008(Source: BPS, 2009)

3.3

Sensitivity as Vulnerability Factor in the Health Sector

As mentioned before, in section 3.1 sensitivity is a potential degree of a system to response to a change

in climate condition, such as the spread of change of ecological functions, its structure and compositions.

(UNEP and WMO, 1996). In this study, indicators for sensitivity were chosen to be the level of population

welfare and IMR. These indicators were selected due to the high accuracy of available data.

3.1.1

Welfare Status of the Population

The main component of sensitivity as related to climate change in the health sector is the level of the

population welfare. This is being chosen due to the fact, that level of welfare can represent the capability

to fulli l health services and requirement of food, such that good nutritional status can be maintained. On

the other hand, if the fuli llment of food and nutrition are not acquired, than vulnerability to contracting

diseases as related to climate change will occur.

(40)

20%, 9 (nine) provinces having percentage of poor population above 30%, namely, Papua (40,78%), West

Irian Jaya (39,31%), and Maluku (31,14%) (Ministry of Health, 2008). Figure 12 shows the distribution

of the number of families of poor population (

Pra Keluarga Sejahtera/Pra KS

) and KS 1 (

Keluarga Sejahtera

1

). The area having the highest percentage of families belonging to Pra KS dan KS 1 are the most

vulnerable.

The lower the welfare, the higher the possibility or potential to become sick. In accordance to the

Indonesian Health Proi le document of 2007, diseases suffered by poor population are lung tuberculosis,

malaria and HIV/AIDS. The low level of health status of the poor population, are mainly due to the lack

of access to health services caused by the geographical and i nancial constraints (

cost barrier

).

Figure 3.2 Map of Level of Population Welfare Status (Source: BPS, 2009)

The main problem to i nd access to health services is due to the cost barrier, distances, and transportation.

(41)

3.1.2

Infant Mortality Rate

Sensitivity is being inl uenced by age structure, hence IMR/AKB can be used as indicator for sensitivity,

to determine the level of public health. At the present moment, public health programs in Indonesia,

mostly focus on lowering the IMR. IMR is being dei ned as the number of deaths among children

between 0-1 year old divided by the number of live births for the same calendar year. The Central Bureau

of Statistics estimated IMR for the year 2007 as 34 per 1.000 live births. The tendency of IMR to decrease

is being inl uenced by equal distribution of health services with its facilities. The increase of income can

take a role through improvement of nutritional status, which in turn will improve the immunity status

of the population towards diseases attacks. Currently, society health programs in Indonesia are mostly

focused on IMR reduction.

Infectious diseases, the main causes of infant and children below 5 years mortality rates, are acute upper

respiratoty tract infections/ISPA, diarrhea, tetanus neonatorum, and diseases related to pregnancy and

labor. Figure 13 shows a map of distribution of IMR in Indonesia; it can be seen that areas having high

IMR are West Sulawesi with a number of more than 60. Other areas with IMR between 50-40 are in

South Kalimantan, central Sulawesi, Maluku, and Nusa Tenggara islands.

Figure 3.3 Map of IMR Distribution in Indonesia

(Source: Analysis of Data Ministry of Health, RI 2008)

(42)

the indicator of the readiness of infrastructure and institutional aspect in facing climate change. (Smith

et al., 2001).

This study took as indicator for adaptive capacity, the existing health facilities, community access to safe

water supply and sanitation. The health facilities taken into account are the existing hospitals, health

centers, etc.

3.2.1

Hospitals

Hospitals are one of many important health facilities within the health services sector in facing climate

change. Indicators that will be used to assess the development of hospitals among other, with the

development of the number of hospitals and their repective beds for in-patients cases, and their ratio

towards the number of population. In 2008 the number of hospitals in Indonesia, were 1.556 units,

shown in Figure 3.4.

Figure 3.4 Map of Hospital Distribution in Indonesia, 2008

(Source: Analysis of Data Ministry of Health RI)

Hospitals managed by the government consist of those owned by the Ministry of Health, by the provincial

health ofi ces, by the Kabupaten/Kota, TNI/POLRI (the army), and other departments such as BUMN,

are 667 units/50,57%, and those managed by private institutions, are 652 units (Ditjen PP-PL Ministry

of Health, 2008).

(43)

cities/districts that do not have hospital facilities such as part of North Sulawesi, Kabupaten Aceh Jaya,

Kabupaten North Aceh, Kabupaten Bener Meriah, Kabupaten Bima, Kabupaten Asmat, Kabupaten

Baloangan, and in Papua island.

3.2.2 Health Centers

Figure 3.5 Distribution of Health Centers in Indonesia, 2008

(Source: Analysis of Data Ministry of Health RI)

A map of distribution of health centers throughout Indonesia can be seen in Figure 3.5 for the year

2008. Health centers are program implementing units of the local health ofi ces at the district/city levels,

located in subdistricts/kecamatan, implementing operational tasks and public health development. The

establishment of at least one health center in each subdistrict plays a very important role in maintaining

community health.

Looking at the work-area of a health center, the ratio of a health center in 2003-2007 already sufi ce the

concept of work-area of a health center, namely, on the average of one health center to 30.000 population,

meaning that nationally, a health center is expected to to be able to reach/cover the population basic

(44)

3.2.3 Posyandu

Posyandu is different from a health center, in a way that it is not owned and/or managed by the government,

but work together very closely with a nearby health center. It is a kind of community participation in the

health i eld. It is owned by the people, work for the people, and by the people organization, even if they

are i nancially being partly supported by the local government. It is therefore playing a very important

role in the villages and should become one of the many components of adaptive capacity at village level.

Posyandu is implementing at least i ve priority programs, i.e., mother and child care, family planning,

improvement of nutritional status, immunization, and management of diarrhea. To monitor its progress,

posyandu are grouped into 4 strata, namely, Posyandu Pratama, Posyandu Madya, Posyandu Purnama,

and Posyandu Mandiri.

Figure 3.6 Distribution Map of Posyandu, 2008

(Source: Analysis of Data Ministry of Health RI)

(45)

3.2.4 Immunization Coverage

Figure 3.7 Map of the Spread of Immunization Coverage, 2008

(Source: Analysis of Data Ministry of Health RI)

Figure 3.7 shows a map of distribution of immunization coverage for the year 2008. Routine imunization

in Indonesia covers the provision for babies aged 0-1 year, against several prevalent child diseases such

as Tuberculosis, Pertussis, Tetanus, Diphtherie, Poliomyelitis, Morbilli, and Hepatitis B. The vaccines are

known as the BCG, DPT, Polio, Morbilli, Hepatitis B vaccines. Other immunizations are for mothers

at productive age/pregnant mothers (TT), and for primary school-aged children (DT for i rst grade

primary school and TT for grade class of 2-3). Meanwhile for additional imunization activities, are done

in accordance with a need, such as the existence of problems in villages for a non UCI (

Universal Child

Immunization

), potential disease outbreaks, i nding a wild polio virus or other activities based on technical

policies (Indonesia health proi le, 2008).

Most part of Indonesia are covered by immunization, and quite good, i.e., about 85-100%. Some areas

with low coverage are the Nanggroe Aceh Darussalam, West Sulawesi, Nusa Tenggara islands, Maluku,

Papua, and West Irian Jaya, i.e., around 0-75%. The low coverage of immunization in the mentioned places

show that the degree of sensitivity is high to suffer from diseases related to climate change (Indonesia

(46)

3.2.5 Health Manpower

Figure 3.8 Distribution Map of Private Medical Practice, 2008

(Source: Analysis of Data Ministry of Health RI)

(47)

Figure 3.9 Spread of Midwives Practice Location 2008

(Source: Analysis of Data Ministry of Health RI)

Figure 19 shows a map of the locations of midwive practice 2008. According to a national social-economic

survey in 2007, the percentage of children under i ve having a primary midwive assistance during their

delivery was 53,96%, by traditional midwive/

dukun

30,37% and medical doctor 12,32%. Those assisted

by midwives in urban area were 64,24%, and in rural areas were 46,36% (Indonesia Health Proi le, 2008).

(48)

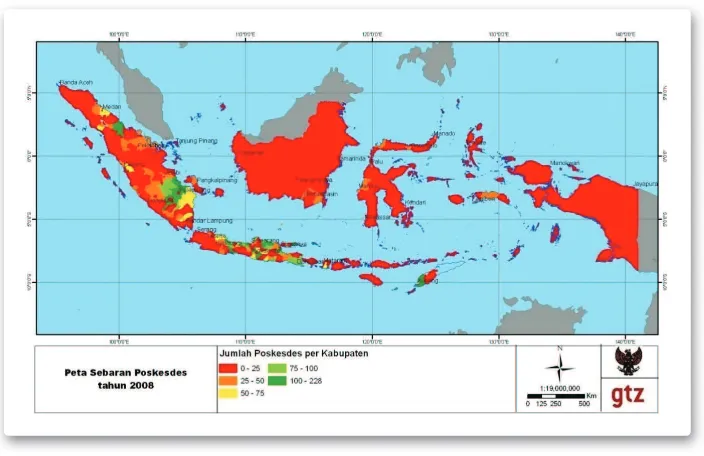
3.2.6 Poskesdes

Figure 3.10 Distribution Map of Distribution of Poskesdes, 2008

(Source: Analysis of Data Ministry of Health RI)

(49)

3.2.7 Polindes

Figure 3.11 Polindes Distribution, 2008 (Source: Analysis of Data Ministry of Health RI)

Polindes is a poli-clinic at the village level, providing medical treatments, and is one of the many important

health facilities at the kabupaten level. Distribution of polindes in Indonesia can be seen in Figure 3.11.

The distribution of polindes is quite equal in Indonesia, only certain areas such as Papua, East Kalimantan,

part of Sulawesi, Maluku, part of Sumatera, and Banten are still low in polindes.

3.2.8 Community Access Coverage to a Safe Water Resources and Sanitation

One other important factor inl uencing the status of public health is the condition of the environment,

rel ected among others, by the access the community have to safe water supply and basic sanitation. In

(50)

Figure 3.12 Percentage of Community Access to Safe Water Supply

(Source: Analysis of Data Ministry of Health, RI 2008)

Figure 3.12 shows the percentage of community having access to safe water supply. Safe water sources,

in the i gure, are dei ned as water from piped water supply, protected spring water, bottled water, pumps,

(51)

Figure 3.13 Distribution of Sanitation Coverage

(Source: Analysis of Data Ministry of Health, RI 2008)

Figure 3.13 shows the distribution of sanitation coverage. Sanitation facilities in the above i gure is

dei ned as a facility for defecation (private, commnal, or public). Figure 3.13 shows Riau, DI. Yogyakarta,

and East Kalimantan having a good sanitation coverage, namely, in the range of 90-100%. West Java,

North Sumatera, and South Sulawesi, Bali and South Kalimantan have sanitation coverage in the range of

80-90%. A territory that need to be attented to are the West Nusa Tenggara and Central Sulawesi, because

of the very low sanitation coverage, ie. less than 60%. Other territory such as NAD, West Sumatera,

Banten, West Kalimantan, Papua, East Nusa Tenggara also have low sanitation coverage, namely, in the

range of 60-70%.

3.3

Vulnerability of Diseases Related to Climate Change in Indonesia

As was explained in section 3.1, vulnerability is a function of exposure

,

sensitivity

,

and adaptive capacity

.

Climate change impacts to health are (1) disaster due to increasing frequency of extreme climate (l ood,

landslide, storm), (2) malnutrition due to disturbed agriculture and i shery, and (3) change of disease

(52)

Based on data of exposure, sensitivity, and adaptive capacity that were explained before, vulnerability to a

certain disease will be at regions with the largest spatial spread in Indonesia and maybe related to climate

change, would be malaria, DHF, and diarrhea, computed as follows:

3.3.1

Vulnerability to Malaria

In this study, analysis of vulnerability to malaria are computed based on the addition of the E,S, and AC

components using weighting method as shown in the following table.

Table 3.1 Vulnerability Computation to Malaria in Indonesia

VULNERABILITY

Components

Sub Component

Weight

E: Exposure

Population density

0.06

S: Sensitivity

Annual Malaria Incidence (AMI) , 2008

0.32

Level of population welfare

0.20

AC: Adaptive Capacity

Health Facility

0.20

Percentage access to safe water

0.11

Percentage access to sanitation facility

0.11

(53)

Figure 3.14 Map of Vulnerability to Malaria

For a few years, in several areas such as the NTT province, Purwerejo, and Sukabumi,

Anopheles vagus

mosquitoes were positive for malaria parasite, while some researches showed that

Anopheles vagus

prefer

animal blood rather than human blood. It is therefore neccessary to do further research to i nd out the

(54)

3.3.2 Vulnerability to Dengue Haemorrhagic Fever

Analysis of vulnerability to DHF was computed based on the additions of components E,S, and AC

using weighting such as described in Table 3.2, as follows:

Table 3.2 Computation of Vulnerability to DHF in Indonesia

VULNERABILITY

Components

Sub Component

Weight

E: Exposure

Population density

0.35

S: Sensitivity

Incidence Rate DHF, 2008

0.25

Level of population welfare

0.17

AC: Adaptive Capacity

Health facility

0.11

Percentage access to safe water

0.06

Pecentage access to sanitation facility

0.06

(55)

Figure 3.15 Map of Vulnerability to Dengue Haemorrhagic Fever

DHF vector transmitting the disease are the

Aedes aegypti

and

Aedes albopictus

as a potential vector,

harbouring in clean water around the house. DHF are increasing in insidence at the start of a rainy season,

i.e., between October-May. DHF had been transmitted throughout Indonesia reaching the subdistricts

and villages. Information from an entomologist working in the region of East Nusa Tenggara, mentioned

that there is an indication of the mosquitoes to change their behaviour; i.e., they usually take a blood

meal during the day, but presently, the

Aedes

also i nd their blood meal at night, neccessitating further

observations to coni rm the accuracy of the information (Ministry of Health RI, 2008).

3.3.3 Vunerabillity to Diarrhea

(56)

Table 3.3 Computation of Vulnerability to Diarrhea in Indonesia

VULNERABILITY

Components

Sub Component

Weight

E: Exposure

Population density

0.04

S: Sensitivity

Incidence Rate Diarrhea, 2007

0.28

Level of population welfare

0.19

IMR

0.07

AC: Adaptation Capacity

Health facilities

0.19

Precentage access to safe water

0.12

Percentage access to sanitation facilities

0.12

Figure 3.16 shows a map of vulnerability to diarrhea in Indonesia. Regions with high vulnerability are

spread in Sumatera, Kalimantan, Sulawesi, Nusa Tenggara, and Papua. Java Island shows low vulnerability,

and in certain area, vulnerability are even very low. These conditions can be caused by the quality of the

existing health services, and their health facilities which are quite good, and their quality of welfare, which

already implement the pattern of hygienic and healthy living (PHBS).

(57)

RiSK Of CLiMATE

CHANGE TO THE

HEALTH SECTOR

Gambar

Figure 2.1 Relationship between Various Main Global Environmental Changes   which Inl uence Human Health, Including Climate Change (Mc Michael, 2003)
Figure 2.2 Pathways by which Climate Change Affect Human Health (Patz et al, 2000)
Figure 2.3 Schematic Diagram of Relationship Pattern of Climate Inl uence on Health, Impacting
Table 2.1 Hazards of Climate Change as related to the Health Sector
+7

Referensi

Garis besar

Dokumen terkait

This raises questions about how (and to what extent) these various demands and concerns can be addressed. In trying to answer these questions, it is important to understand what

Anggota Kelompok Tani mengikuti kunjungan Disperindang dalam melakukan evaluasi memperoleh pupuk bersubsidi. Anggota Kelompok Tani

h oltekkes-malan ac.id Pelamar yang dinyatakan lulus seleksi administrasi dapat mencetak Kartu Peserta Ujian dengan cara login ke Akun masing-masing menggunakan Nomor

Also from the groundwater modeling for sea water intru- sion, it is estimated that in the next 5 and 10 years that the study area is at a low vulnerabil- ity to sea water

Kelompok Kerja I Bidang Barang, Jasa Konsultansi dan Jasa Lainnya Bagian Pengadaan Barang dan Jasa SETDA Kota Kotamobagu akan melaksanakan Seleksi Sederhana untuk

- Kualitas audit tidak terbukti dapat mengurangi terjadinya praktik manajemen laba melalui clas- sification shifting dikarenakan tidak ditemukan- nya pengaruh positif operasi

KEBERSIHANLINGKUNGAN DIRI PADA PRAKTIK PENYULUHAN KELUARGA DI PANTI SOSIAL ASUHAN ANAK. Universitas Pendidikan Indonesia | repository.upi.edu

Rekristalisai dilakukan dengan cara melarutkan kristal yang diperoleh kedalam larutan tiurea (0,1g) dalam 30 mL yang mengandung beberapa tetes asam sulfat 1 M... Pelarutan