COASTAL AQUIFER GROUNDWATER
MODELING IN THE SOUTHERN PART OF
YOGYAKARTA AREA, INDONESIA
Doung Rata∗1, Doni Prakasa Eka Putra2, and Heru Hendrayana2
1Rural Engineering Department, Institute of Technology of Cambodia
2Department of Geological Engineering, Gadjah Mada University, Yogyakarta, Indonesia
Abstract
Parangtritis beach, located in a coastal aquifer at the southern part of Yogyakarta Province, Indonesia is bounded by the Indian Ocean at the South, Opak River at the West, and Tertiary Limestone Rock to the East. Local land-use is predominantly agricul-ture, rice fields and settlements and the population is estimated to be 9,386 persons as per the 2012 cen-sus. The total surface area is estimated at 9.46 km2.
The aims of this research were to understand the sys-tem of groundwater and to assess and predict salt-water intrusion by conducting a numerical ground-water model. Hydrological and hydrogeological data were collected directly from the field and from previ-ous work for input into the model.
The model simulates an unconfined aquifer sys-tem where the aquifer thickness varies from 30-40 meters. The material of the aquifer consists of sand varying from fine to coarse grain size and fine gravel with hydraulic conductivity values of 8.974×10⁻⁴, 1.794× 10⁻³, and 1.337×10⁻³ m/s at the
north-ern, central, and southern part of the research area, respectively. The maximum length of the saltwater interface was estimated at about 205.1 m laterally and 40 m vertically relative to the location of the groundwater table around 1m above sea level. Di-rection of groundwater flow is from north to south. Groundwater table elevation equals 5 m at the north
∗Corresponding author: D. RATA, Rural Engineering
Department, Institute of Technology of Cambodia, Rus-sian Confederation Blvd, PO Box 86, Phnom Penh, Cam-bodia
and 0 m at the south with a hydraulic gradient esti-mated at about 2.45×10⁻³.
As a result of a steady-state simulation as well as two cases of prediction for five and ten years in the future, it is determined that that the salinity of the surrounding environment is not potentially adverse to the groundwater quality in the study area. This is in part due to low population in this area and abun-dant groundwater resources, as well as the results of the groundwater model.
Keywords: Coastal aquifer, numerical groundwa-ter model, conceptual model, observed heads
1 Introduction
About 70% of the world’s population lives in coastal zones. With economic and population growth, the shortage in freshwater supply is be-coming increasingly acute. Due to the progres-sive depletion and pollution of surface water, coastal communities have turned to groundwa-ter to supplement their fresh wagroundwa-ter supply. For domestic supply purposes, the percentage of groundwater use has increased to more than 40% on a worldwide basis (Cheng and Ouazar, 2005).
as freshwater sources. The resultant ground-water degradation can result in many negative impacts on the people, environment and local economy. Without a proper method to manage groundwater in this area, a water crisis will oc-cur and render the area unusable. The contin-ued use of such a contaminated source of wa-ter can dewa-teriorate human health and will cause significant damage to the socio-economic value of the area.
Groundwater models are valuable tools for the management of groundwater resources as they are representative of the reality of the nat-ural system. They can be used to complement field monitoring and laboratory bench studies in evaluating and forecasting groundwater flow and transport (Younger, 2007). Furthermore, groundwater modeling is now a major part of projects dealing with groundwater devel-opment, protection, and remediation (Kresic, 2007).
2 Location of Study Area
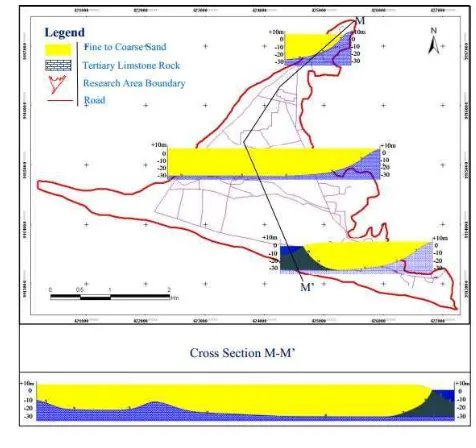
The study area is located in the coastal zone of the southern part of Yogyakarta Special Province, Indonesia. The total population is estimated around 9, 386 persons as per the 2012 census with a total surface equaled to 9.46 km2. The research area is bounded by the hydroge-ological conditions of the Indian Ocean at the south, the Opak River at the west, and tertiary limestone rock at the east (Figure 1). The lithol-ogy in the research area consists of sand and gravel of the Wates Formation and sand dunes (MacDonald and Partners, 1984). The clean water supply in the sand dunes area poses a
problem because in this area, wells and springs are rare and water quality is poor due to high salinity (Putra, 2003). Based on the land-use map (Bakosurtanal, 1999), the research area is occupied mostly by rice field.
3 Research Methodology
All available secondary data was collected which included a topographical map, land-use map, geological map, rainfall data, temperature data, and population data. The primary data was measured directly in the field and included the groundwater head, river parameters, and TDS values. Together, these data were input to the numerical model. A systematic research flow chart can be seen in the Figure 2.
4 Data Evaluation
4.1 Hydrology
Rainfall Based on annual rainfall data ob-tained from the Department of Meteorology and Geophysics of Bantul Regency which was measured in the station of meteorology Pun-dong from the year 2000 to 2011, monthly rain-fall intensity in study area varied from month to month depending on the rainy season (Table 1). From these data, the average annual rainfall was esimated to be 1855.2 mm/years.
empir-Figure 2: Flow chart of research methodology.
Table 1: Hydrological parameters of research area
Figure 3:
ical equation. The value of evapotranspiration within the study area was calculated to be equal to 1330.8 mm/year.
Runoff Runoff was assumed to be a func-tion of annual rainfall, average temperature and area of watershed. The amount of surface runoff calculated in this way was estimated at 310.5 mm/year.
4.2 Hydrogeology
Aquifer System Since there are no existing borehole data and no new boreholes drilled for this study, the groundwater system and subsur-face condition had to be developed based on the geological map of the Yogyakarta Province (scale 1:100 000), prepared by the Geological Re-search and Development Center of Indonesia in 1995 (Djaeni & Soekardi, 1974) and review of relevant research. The result of this estima-tion is that the thickness of the aquifer within the study area varies from 30m at the north and 40m at the south (Figure 3).
In-Figure 4: Distribution of TDS value of research area.
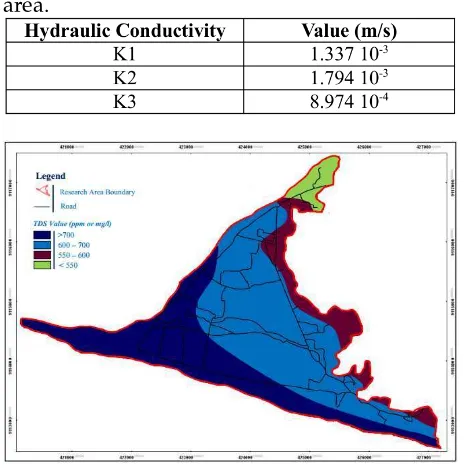
dian Ocean. The second test was located in the central area and the last test was located along the northern boundary. The value of hydraulic conductivities are represented asK1,K2, andK3, respectively (Table 2).
Salinity Since the study area is located ad-jacent to the ocean, it is necessary to identify salinity from natural saltwater by using a TDS (Total Dissolve Solid) meter. The maximum measured TDS was found to be equal to 926 mg/l at southern boundary while the minimum was 500 mg/l at the northern boundary (Figure 4). Since the TDS value was less than 100mg/l, the groundwater in this area is still consider as fresh (Hemker, 1994).
Initial Position of Saltwater Interface The possibility of a saltwater interface was ac-counted for by using the theory of lateral en-croachment and vertical upconing of Ghijben-Herzberg principle (Figure 5).
5 Results and Discussion
5.1 Conceptual Model
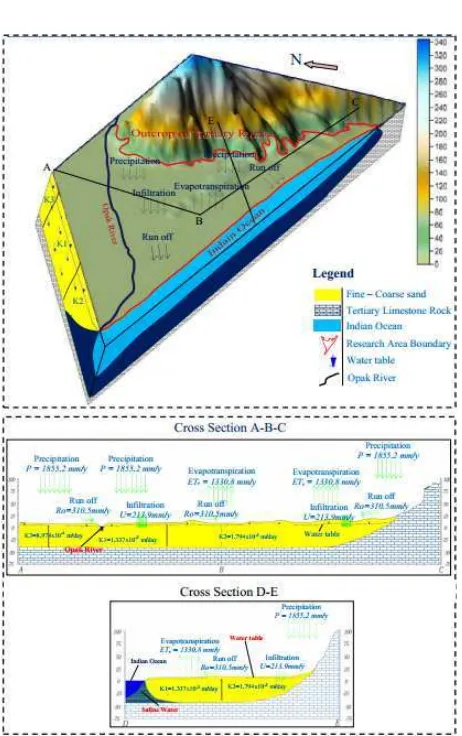
The type of aquifer in the model area is an unconfined aquifer consisting of fine to coarse sand, gravel, sandy-clay, silt, undifferentiated tuff, ash, and breccias with a basement rock consisting of Tertiary limestone (Figure 6). The geometry of the aquifer is assumed as shallow-est at the eastern part and gradually deeper to the south with a thickness ranging from 30 to 40 meters, respectively.
The study area is bordered by a major river located in the western boundary of the study area known as the Opak River. This river is assigned as a river boundary of the study area for modeling purposes. The Indian Ocean is as-sumed as a constant-head or zero-flow bound-ary of the research area. In the north-east, the study area is connected to a hilly mountain with a lithology dominated by Tertiary lime-stone rock which was assigned as a no-flow boundary for modeling purposes. Groundwa-ter flow direction in the study area runs from north to south.
The recharge rate in the aquifer is assumed to come entirely from rainfall. Therefore, the rate of groundwater recharge used for model-ing purposes is equal to the average rainfall rate of 213.9 mm/year.
5.2 Groundwater Model Results
Figure 6: Conceptual model of research area.
Figure 7: Groundwater flow pattern map of the study area.
Table 3: Groundwater mass balance
from variables such as hydraulic conductivi-ties, groundwater basement, and groundwater recharge variation, the best result is shown in Figure 7.
Based on Figure 7, the groundwater flow di-rection is oriented from north to south in the research area with a maximum groundwater flow velocity of about 0.84 m/day. Based on the model calculation, the groundwater mass balance was estimated with the discrepancy of 0.03% (Table 3; Figure 8).
Figure 9: Groundwater equipotential line of case 1 (next 5 years of prediction) and case 2 ( next 10 years of prediction) vs. calibrated model result.
5.3 Model Application
The purpose of applying the groundwater modeling used in this study is to use the re-sults to predict the behavior of hydrogeological condition in the research area for the next 5 and 10 years. Trends have been identified in decreasing groundwater table and saltwater intrusion.
Decreasing of Groundwater Table The de-creasing of groundwater table was determined based on population and land-use characteriza-tion of research area (Figure 9). In two cases of prediction (for 2017 and 2022), the popu-lation in the research area is expected to be around 10,306 and 11,315 persons with a total rate of groundwater abstraction of 1,546 and 1,700 m3/day, respectively.
Figure 9 illustrates that the mean equipoten-tial line of the groundwater table has moved to-wards the north of the model area. This is a mechanical response to the increase in rate of groundwater abstraction.
Saltwater Intrusion The results of groundwa-ter modeling for saline wagroundwa-ter intrusion have been applied to calculate the position of the seawater interface in terms of vertical upcon-ing and lateral encroachment by usupcon-ing theory of Ghijben-Herzherg. The thickness of the aquifer
Figure 10: Position of saltwater interface in next 5 and 10 years of prediction vs. initial condition
is approximately 40m maximum, and the posi-tion of the saltwater interface is at a minimum of 0 m and a maximum of 1m. Where ground-water elevation is equal to 1m, the position of interface is equal to 40m that reaches to the basement of the aquifer. Consequently, only the area beneath the locations where groundwater elevation is 0m to 1m is there a potential for salt-water intrusion from the ocean (Table 4). The initial saltwater interface in steady-state condi-tion and prediccondi-tions for future placement are il-lustrated in Figure 10 below.
6 Conclusion
is equal to 30m at the north and equal to 40m at the south. The value of hydraulic conduc-tivity was estimated using the slug test method in three locations within the study area, which yielded values of 1.794 × 10⁻³, 1.337 × 10⁻³, and 8.974 × 10⁻⁴ m/s, representing sand and fine gravel material. Hence, the composition of the aquifer in the study area is surly sand and fine gravel.
As a result of modeling under steady-state conditions, the initial saltwater interface be-neath the study area is found with a maximum length of protrusion of 205.1m horizontally and 40m vertically from the land surface. Also from the groundwater modeling for sea water intru-sion, it is estimated that in the next 5 and 10 years that the study area is at a low vulnerabil-ity to sea water intrusion. The results of mod-eling and prediction have shown that the water table can be dropped down.
Acknowledgement
Firstly, I would like to thank to Indonesian Government and the Asian University Net-work, Southeast Asia Engineering Education and Development Network (AUN/SEED-Net) Program for their financial support in this re-search. Lastly, I would like to forward my spe-cial thanks to one undergraduate student Mr. Made Yudha Lesmana, and one graduate stu-dent Mrs. Meilan Demulawa who helped in conducting field work.
References
Badan Koordinasi Survey dan Pemetaan Nasional (BAKOSURTANAL), (1999) Peta Rupa Bumi Dig-ital Indonesia Shala 1:25 000 Parangtitis. Ban-dung: Republik Indonesia.
Cheng, A. H.-D. and Ouazar, D. (2005) Coastal
Aquifer Management. Monitoring, Modeling,
and case studies, Wasshinton, D. C, Lewis pub-lishers.
Djaeni, A. and Soekardi R. (1974) Groundwater ex-ploration in the Projected Iron Sand mining area. Yogyakarta, Report 1844, GSI Bandung.
Hemker, K. (1994) Hydrological models, f15D. Handouts. (in Dutch). Delft University of Tech-nology, Faculty of Civil Engineering.
Kresic, N. (2007) Hydrogeology and Groundwater Modeling. Second edition, New York, Tailor and Francis group.
MacDonald and Partners, Binnie and Partners & Hunting Technical Services Ltd. (1984)
Greater Yogyakarta groundwater resources
study: Groundwater (Vol. 3). Groundwater
Development Project (P2AT). Ministry of Public Works, Government of the Republic of Indonesia. Putra, D. P. E. (2003). Project final report: Inte-grated water resources management in Merapi-Yogyakarta basin (Project SEED-Net No. UGM 0104). Yogyakarta: Gadjah Mada University. World Health Organization (2004) Guideline for
Drinking-water Qualit, vol 1, 3thed. China: Sun Fung.