27
The Application of
Time-Driven Activity-Based
Costing In the Hospitality
Industry: An Exploratory
Case Study
Bas Basuki*
Mertzha Dwiputri Riediansyaf*
Abstract
In managing a company, the management and the board need accurate information about operational cost structures and profitability in order to help them in the decision making processes. To provide accurate information, a cost calculation system is generally used to show how the company has allocated its resources to supply its products/services.
This paper looks at the application of Time Driven Activity-Based Costing (TDABC) in a service company. The cost object of this research is a Hotel and the Room Division that is the main source of the hotel’s revenue. Approximately 80% of the hotel’s revenue comes from room rent activity.
Both direct and indirect costs are recalculated using the TDABC method. The results from the TDABC are then compared to the results from the initial cost calculation method used by the company. This research shows that the TDABC method is applicable for Hotel services costing and also that the capacity cost rate can be more accurately and flexibly used in cost compilation.
Keywords
Time Driven ABC (TDABC) Service Industry Costing Case Study
Capacity Cost Rate Cost Driver Rate Time Equations
* Airlangga University, Indonesia
Introduction
In recent years, human mobility has increased dramatically, especially those visiting big cities; whether it is for a business trip or just a holiday. This phenomenon has resulted in businessman developing hotels, motels, home stays, etc., to cater for the need for
accommodation in those popular cities.
Such hotel developmentshave had a positive trend year to year especially in Malang, East Java; a popular tourism destination in Indonesia. Due to increasing competition, hotels need to run their operational activities both efficiently and effectively. Therefore, hotels need to consider all of the costs, both direct and indirect cost, and then recoup them via the services provided. Incorrect cost calculations may result in the occurrence of overpricing or underpricing which will later affect the hotel competitiveness and
profitability. Nowadays, many hotels are not only offering accommodation services, but also offering restaurants, laundry services, halls or ballroom rentals, etc. This research study chose to concentrate on cost calculations only in a case study hotel’s room division. The reason for choosing the room division is based on the fact that the room division provided the dominant portion of revenues in the case study hotel, Hotel Graha Cakra; i.e. almost 80% of the hotel’s total revenue of comes from room division revenue.
The current cost calculation method used by the Hotel is a very simple traditional costing method. More modern cost allocation approaches such as, Activity Based Costing (ABC) have been shown to be more effective and accurate than the traditional methods in both manufacturing and service organisations. However, difficulties of implementing ABC systems has resulted in the development of a new approach to ABC by Kaplan and
Anderson (2007) called Time-Driven Activity-Based Costing (TDABC).
Theoretical Framework
TDABC was designed to eliminate the
28 ABC were identified: (1) the interviewing and surveying process was time consuming and costly; (2) the data for the ABC models were subjective and difficult to validate; (3) the data was expensive to store, process and report; (4) most ABC models were local and did not provide an integrated view of enterprise-wide profitability opportunities; (5) the ABC model could not be easily updated to accommodate changing circumstances; and (6) the model was theoretically incorrect when it ignored potential for unused capacity.1
Kaplan and Anderson (2007) stated that “ABC systems were expensive to build, complex to sustain, and difficult to modify” and therefore they made ABC’s shortcomings as TDABC’s primary strengths. Furthermore, they state that “... It is simpler, cheaper, and far more
powerful than the conventional ABC
approach”. According to Kaplan and Anderson (2007), TDABC approach overcomes many ABC difficulties and has the following advantages:
1. Easier and faster to build an accurate model.
2. Integrates well with data now available from ERP and customer relationship management systems (this makes the system more dynamic and less people-intensive).
3. Drives costs to transactions and orders using specific characteristics of particular orders, processes, suppliers, and
customers.
4. Can be run monthly to capture the economics of the most recent operations. 5. Provides visibility to process efficiencies
and capacity utilization.
6. Forecasts resource demands, allowing companies to budget for resource capacity on the basis of predicted order quantities and complexity.
7. Is easily scalable to enterprise wide models via enterprise-scalable applications software and database technologies.
1
There are many academic papers that refute the claims made by Kaplan and Anderson (2007) about the problems of ABC. Ratnatunga, Tse and Balachandran (2012) state that TDABC time allocations are even more subjective than ABC; and have shown via a case study that TDABC is theoretically inferior to ABC.
8. Enables fast and inexpensive model maintenance.
9. Supplies granular information to assist users with identifying the root cause of problems.
10. Can be used in any industry or company with complexity in customers, products, channels, segments, and processes and large amounts of people and capital expenditures.
Despite some possible theoretical inferiority; it is correct that TDABC implementation is much simpler than ABC in that it requires only two parameters, the unit cost of activity and the time required to perform a transaction or an activity. As such, TDABC is very suitable for a service company such as a hotel, because hotel activities are primarily measured on the basis of labour time used for performing a given activity, or have high portion of overhead cost. The use of traditional cost system to determine the rooms selling price not only causes inflexibility; but also many people argue overcome the subjectivity in their cost driver selections. Also, often the price cannot reflect the changing circumstances. Hopefully by using TDABC, the cost
calculations can be more precise and also more flexible with the changing environmental circumstances.
Kaplan and Anderson (2007) outline the
two steps in implementation this system as
follows:
“First, it calculates the costs of supplying
resource capacity . . . . it divides this total
cost by the capacity of the department to
obtain the capacity of the department to
obtain the capacity cost rate. Second,
TDABC uses the capacity cost rate to drive
departmental resource costs to cost objects
by estimating the demand for resource
capacity (typically time, from which the
name of the new approach was chosen)
that each cost object requires.”
The essential components of TDABC in its
implementation stage are namely (Kaplan
and Anderson 2007):
29
2. Define Cost of Capacity Supplied
3. Define Practical Capacity
4. Determine Capacity Cost Rate
5. Estimate Time Consumption
If a process does not have too much
activity variation, TDABC can be
conducted easily, and vice versa, if a
process has a high variety of activity, then
the determination of accurate practical
capacity can be quite complicated.
To solve this problem TDABC builds the
time equations as shown in Figure 1
(source: Kaplan and Anderson. 2007,
modified).
Figure 1: Key Components of TDABC
Such time driven equations help
companies to better identify the actual
time required to perform the process. The
key elements to create time equations are:
(1) estimate standard time required to
perform the process, and (2) add the
factors that increase standard time process
time required to perform an activity as
follows:
“Standard time + additional time
{if (certain condition)} + additional time
{if (certain condition)} + additional time
{if (certain condition)} + . . . . .”
Research Outline
This paper hopefully will contribute to the managerial accounting literature by demonstrating how a new costing model (TDABC) is suitable for certain types of services such as found in the hospitality industry. The paper will discuss the research method used, the initial calculation of room cost, the detailed calculation of room cost using TDABC, and a comparison between the two models. The paper will demonstrate how the Time-Driven Activity-Based Costing method atHotel Graha Cakra, Malang, produces better cost information for decision making than the traditional costing approach used by the hotel.
The research approach used is a non
mainstream methodology using an
exploratory case study. The data collection
procedures are as follows:
Preliminary survey: The researcher conducted a preliminary survey to gain an understanding of the company and to find out information about the existing cost system that was used by company. The purpose of this survey was to ascertain the current condition of the company and the associated problem formulation.
Field research: This phase was directly conducted in the research site by using several techniques, such as:
• Observation: Observations were made to collect data as evidence useful to provide additional information. Observations were made by visitingtheHotel regularly. • Interview: Data was collected from the
interviews with responsible parties, such as the general manager of the hotel,
operational manager, and administration. These interviews were very useful for the researchers to gain an understanding about the company and the application of company’s existing cost system.
Documentation: Researchwas carried out by collecting internal company documents;
Capacity cost rate =
TDABC
Unit Cost = Cost per activity
= Capacity cost rate x unit time
30 including the data on the organisational
structure of the company, lists of the company direct and indirect expense, and the company’s facilities. This data was be used as the basis for the cost calculations.
In the field research and documentation stages data was collected and analysed for the following resource costs:
• Room Data (Table 1)
• Room Inventory (Table 2)
• Direct Human Resources (Rent Rooms Service) (Table 3)
• Indirect Human resources (Rent Rooms Service) (Table 4)
• Fixed Assets in Room Type: Superior (Table 5)
• Fixed Assets in Room Type: Deluxe (Table 6)
• Fixed Assets in Room Type: Junior Suite (Table 7)
• Fixed Assets in Room Type: Royal Suite (Table 8)
• Overhead Costs – Electricity (Table 9)
• Overhead Costs – Water (Table 10)
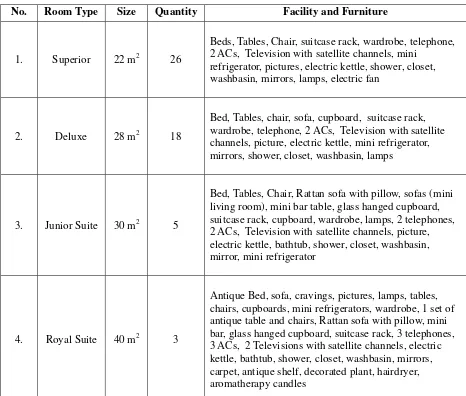
Table 1: Room Data
No. Room Type Size Quantity Facility and Furniture
1. Superior 22 m2 26
Beds, Tables, Chair, suitcase rack, wardrobe, telephone, 2 ACs, Television with satellite channels, mini
refrigerator, pictures, electric kettle, shower, closet, washbasin, mirrors, lamps, electric fan
2. Deluxe 28 m2 18
Bed, Tables, chair, sofa, cupboard, suitcase rack, wardrobe, telephone, 2 ACs, Television with satellite channels, picture, electric kettle, mini refrigerator, mirrors, shower, closet, washbasin, lamps
3. Junior Suite 30 m2 5
Bed, Tables, Chair, Rattan sofa with pillow, sofas (mini living room), mini bar table, glass hanged cupboard, suitcase rack, cupboard, wardrobe, lamps, 2 telephones, 2 ACs, Television with satellite channels, picture, electric kettle, bathtub, shower, closet, washbasin, mirror, mini refrigerator
4. Royal Suite 40 m2 3
Antique Bed, sofa, cravings, pictures, lamps, tables, chairs, cupboards, mini refrigerators, wardrobe, 1 set of antique table and chairs, Rattan sofa with pillow, mini bar, glass hanged cupboard, suitcase rack, 3 telephones, 3 ACs, 2 Televisions with satellite channels, electric kettle, bathtub, shower, closet, washbasin, mirrors, carpet, antique shelf, decorated plant, hairdryer, aromatherapy candles
31
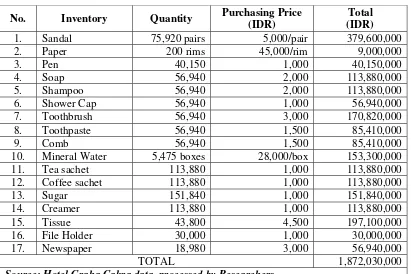
Table 2: Room Inventory
No. Inventory Quantity Purchasing Price
(IDR)
Total (IDR)
1. Sandal 75,920 pairs 5,000/pair 379,600,000
2. Paper 200 rims 45,000/rim 9,000,000
3. Pen 40,150 1,000 40,150,000
4. Soap 56,940 2,000 113,880,000
5. Shampoo 56,940 2,000 113,880,000
6. Shower Cap 56,940 1,000 56,940,000
7. Toothbrush 56,940 3,000 170,820,000
8. Toothpaste 56,940 1,500 85,410,000
9. Comb 56,940 1,500 85,410,000
10. Mineral Water 5,475 boxes 28,000/box 153,300,000
11. Tea sachet 113,880 1,000 113,880,000
12. Coffee sachet 113,880 1,000 113,880,000
13. Sugar 151,840 1,000 151,840,000
14. Creamer 113,880 1,000 113,880,000
15. Tissue 43,800 4,500 197,100,000
16. File Holder 30,000 1,000 30,000,000
17. Newspaper 18,980 3,000 56,940,000
TOTAL 1,872,030,000 Source: Hotel Graha Cakra data, processed by Researchers
Table 3: Direct Human resources (Rent Rooms Service)
No Position Q
ty
Salary (per month)
Grant Take Home
Pay (per month per person)
TOTAL (per year)
Position THR (Eid
Allowance)
1. House Keeping
Manager 1 4,000,000 500,000 4,500,000 4,500,000 58,500,000
2. House Keeping
Supervisor 1 2,500,000 350,000 2,850,000 2,850,000 37,050,000
3. Room boy, Room
maid 8 1,500,000 - 1,500,000 1,500,000 156,000,000
4.
Laundry
(administration and laundry man)
4 1,500,000 - 1,500,000 1,500,000 78,000,000
5. Houseman 4 1,500,000 - 1,500,000 1,500,000 78,000,000
TOTAL 407,550,000
Position Grant paid monthly, it added the amount of monthly Take Home Pay THR Grant paid once a year
32
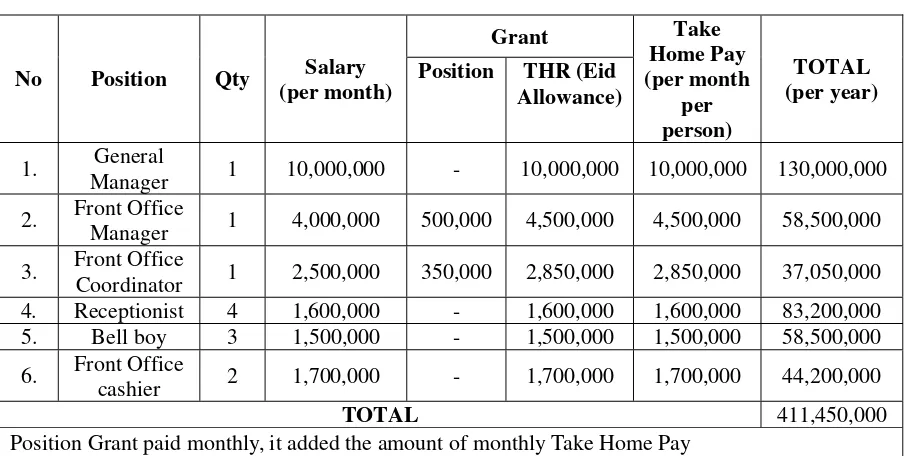
Table 4: Indirect Human Resources (Rent Rooms Service)
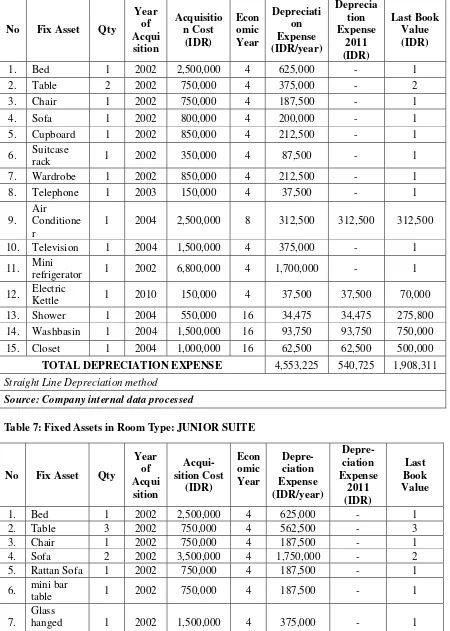
Table 5: Fixed Assets in Room Type: SUPERIOR
No Fix Asset Qty
Year of
Acqui-sition
Acquisiti-on Cost
(IDR)
Econ-omic Year
Depre-ciation Expense (IDR/year)
Depre-ciation Expense 2011 (IDR)
Last Book Value (IDR)
1. Bed 2 2002 1,500,000 4 750,000 - 2
2. Table 3 2002 750,000 4 562,500 - 3
3. Chair 1 2002 750,000 4 187,500 - 1
4. Suitcase
rack 1 2002 350,000 4 87,500 - 1
5. Wardrobe 1 2002 850,000 4 212,500 - 1
6. Telephone 1 2003 150,000 4 37,500 - 1
7. Air
Conditioner 1 2004 2,500,000 8 312,500 312,500 312,500
8. Electric
Fan 1 2003 400,000 8 50,000 - 1
9. Television 1 2004 1,500,000 4 375,000 - 1
10. Mini
refrigerator 1 2002 6,800,000 4 1,700,000 - 1
11. Electric
Kettle 1 2010 150,000 4 37,500 37,500 70,000
12. Shower 1 2004 550,000 16 34,475 34,475 275,800 13. Closet 1 2004 1,000,000 16 62,500 62,500 500,000 14. Washbasin 1 2004 1,500,000 16 93,750 93,750 750,000
TOTAL DEPRECIATION EXPENSE 4,503,225 540,725 1,908,312
Straight Line Depreciation method
Source: Company internal data processed
No Position Qty Salary
(per month)
Grant Take
Home Pay (per month
per person)
TOTAL (per year)
Position THR (Eid
Allowance)
1. General
Manager 1 10,000,000 - 10,000,000 10,000,000 130,000,000
2. Front Office
Manager 1 4,000,000 500,000 4,500,000 4,500,000 58,500,000
3. Front Office
Coordinator 1 2,500,000 350,000 2,850,000 2,850,000 37,050,000 4. Receptionist 4 1,600,000 - 1,600,000 1,600,000 83,200,000 5. Bell boy 3 1,500,000 - 1,500,000 1,500,000 58,500,000
6. Front Office
cashier 2 1,700,000 - 1,700,000 1,700,000 44,200,000
TOTAL 411,450,000
Position Grant paid monthly, it added the amount of monthly Take Home Pay THR Grant pay once a year
33
Table 6: Fixed Assets in Room Type: DELUXE
Table 7: Fixed Assets in Room Type: JUNIOR SUITE
No Fix Asset Qty
1 2004 2,500,000 8 312,500 312,500 312,500
10. Television 1 2004 1,500,000 4 375,000 - 1
TOTAL DEPRECIATION EXPENSE 4,553,225 540,725 1,908,311
Straight Line Depreciation method
Source: Company internal data processed
34
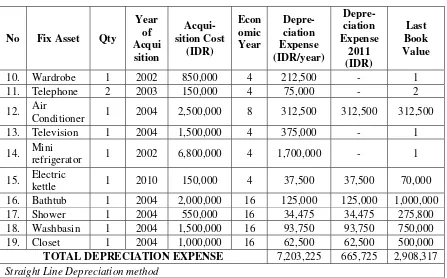
Table 8: Fixed Assets in Room Type: ROYAL SUITE
No Fix Asset Qty
Chair 1 1997 8,000,000 4 2,000,000
-
1
4. Antique
Shelf 1 1997 8,000,000 4 2,000,000
-
refrigerator 1 2002 6,800,000 4 1,700,000 -
Conditioner 1 2004 2,500,000 8 312,500 312,500 312,500 13. Television 1 2004 1,500,000 4 375,000 - 1
TOTAL DEPRECIATION EXPENSE 7,203,225 665,725 2,908,317
Straight Line Depreciation method
35
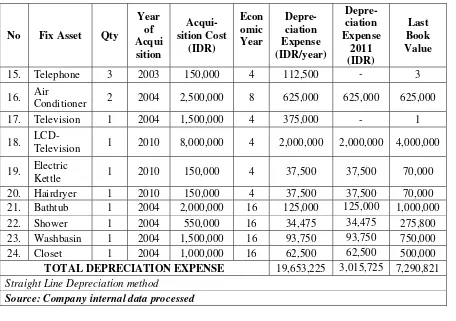
Conditioner 2 2004 2,500,000 8 625,000 625,000 625,000 17. Television 1 2004 1,500,000 4 375,000 - 1
18.
LCD-Television 1 2010 8,000,000 4 2,000,000 2,000,000 4,000,000
19. Electric
TOTAL DEPRECIATION EXPENSE 19,653,225 3,015,725 7,290,821
Straight Line Depreciation method
Source: Company internal data processed
Table 9: Overhead Costs – Electricity
No Room
Calculation of Expense Allocation
Electricity Expense per unit
sold (IDR)
1. Superior 22 m2 4,271 93,962 m2 {(93,962/192,104) x Rp540,000,000} / 4,271
61,841.5
2. Deluxe 28 m2 2,424 67,872 m2 {(67,872/192,104) x Rp540,000,000} / 2,424
78,707.37
3. Junior Suite 30 m2 517 15,510 m2 {(15,510/192,104) x Rp540,000,000} / 517
84,329.32
4. Royal Suite 40 m2 369 14,760 m2 {(14,760/192,104) x Rp540,000,000} / 369
112,439.1
TOTAL 7,580 192,104 m2 Source: Company internal data processed
Table 10: Overhead Costs – Water
No Room
Calculation of Expense Allocation
Water Expense per unit
sold (IDR)
1. Superior 22 m2 4,271 93,962 m2 {(93,962/192,104) x Rp216,000,000} / 4,271
24,736.6
2. Deluxe 28 m2 2,424 67,872 m2 {(67,872/192,104) x Rp216,000,000} / 2,424
31,482.95
3. Junior Suite 30 m2 517 15,510 m2 {(15,510/192,104) x Rp216,000,000} / 517
33,731.73
4. Royal Suite 40 m2 369 14,760 m2 {(14,760/192,104) x Rp216,000,000} / 369
44,975.64
36
Results and Discussion
Hotel Graha Cakra is located in a luxurious residential area. The hotel building is a glorious example of the opulence, grandeur and beauty of colonial architecture in the 1930s. Renovation and restoration of the original building began in 1993 with special emphasis on maintaining its original building and its historical value. Hotel Graha Cakra also offers the comfort of the new millennium in the grandeur of the 30’s; with also the intimacy of personalised boutique hotel services in the tradition of gracious Indonesian hospitality. Currently, it has become one of the leading 4-star hotels in Malang.
Initial Cost Calculations
In determining their room cost, the hotel has applied a very basic Target Pricing approach in which prices are set at cost plus a rate of return based on turnover; i.e. a room cost calculation is the result of a “turnover target” method which is then adjusted based on competitor pricing of similar rooms in Malang. As such, the traditional calculation formula for room cost at Hotel Graha Cakra is as follows:
Initial Capital or initial total investment:
= 67,392,000,000 IDR
Turnover target = 8 years
Total number of rooms = 52 rooms
Yearly Revenue target:
67,392,000 8
= 8.424.000.000 IDR / year
Daily Revenue target:
8,424,000,000 365
= 23.079.453 IDR / day
Room cost:
23,079,453 52
= 443.836 IDR / room
The room cost calculation above becomes the room cost for Superior type and it will be used as a basis for calculating room price for different room types by multiplying this rate with a fixed percentage as follows:
• Deluxe type room cost is 590.302 IDR (i.e. 133% x 443.836 IDR).
• Junior Suite type room cost is 736.768 IDR (i.e. 166% x 443.836 IDR).
• Royal Suite type room cost is 1.176.166 IDR (i.e. 265% x 443.836 IDR).
The determination of the percentage is based on some management assumptions about the differences in facilities in each room, and also considering an average room prices imposed by another hotel in the city of Malang.
Time-Driven Activity Based Costing (TDABC)
Like the ABC method, TDABC also uses activities as a base. In Hotel Graha Cakra, the labour services given to customers have been standardised. Every customer who rents any type of room will get the same services, i.e. there is no differentiation in activities that must be delivered by an employee whatever the room type.
Designing TDABC Model
The TDABC model for the Hotel was designed by the researchers as follows:
1. By identifying activities that happen in core unit and the supporting units through a “table of activities”. This research is focused on room division department. 2. By identifying the Unit Time for each
37 researchers brought along a stopwatch to know the exact time consumed to do the activity.
3. By determining the practical capacity resource used.
4. By defining the Capacity Cost Rate for Indirect Labour.
5. By calculating the TDABC Cost Driver Rate based on the unit time and the calculation of capacity cost rate in each supporting unit.
6. By calculating the TDABC Cost of Performing Activities based on the TDABC cost driver rate with quantities of work for each activity. This step also delivers the information about portion of used and unused capacity.
Table of Activities
First step in designing the TDABC model is to determine activities. Since this research is focused on the room division, the activities that relate with room rent service are listed on the Table of activities presented in Appendix One. The Table of activities required: (1) activity cost pool as general type of process that consists of detailed activities and (2) related resource of each activity.
Determining the Unit Times
Unit time is the exact time that needed to do the activity. The researcher observed how much time was needed by employees to accomplish each activity in the Table of activity. In this step, the researchers also make the Time Equations to calculate the total time needed in each cost pool to accomplish their activities. The following time equations were developed:
Administration-in (minutes)
= [1 + 1 + 4 {if guest came by go show system} + 1 {if guest came by reservation system} + 1 + 2] x total of room sold during 2011
Greeting (minutes)
= 5 x total of room sold during 2011
Accompanying the guest (minutes) = 10 x total of room sold during 2011
Sweeping Dusting Moping (SDM) (minutes) = 25 x total of room sold during 2011
Administration-out (minutes)
= [6 + 2 + 1 + 1 + 2] x total of room sold during 2011
Determining the Practical Capacity Resource Used
Having determined the time equations, the next step is to calculate the Practical Capacity Resource Used. Practical Capacity Resource Used is a total of time available for productive work for each supporting unit doing their activities. Calculation for the practical capacity resource used is 1 year and consists of 52 weeks; the working time for an employee of the hotel is 6 days in a week, so the total working time for a year is 312 days (52 x 6 days) excluding national holidays.
Furthermore, we can calculate the total employee working time in a year as 2,496 hours or 149,760 minutes. However, it is clear that not all of an employee’s working time is used to as ‘productive’ work in servicing the rooms division. There is time used for rest and training. Assuming that such ‘unproductive’ work time is a time break to eat for 1 hour/day; then the total time to take a rest is 312 hours or 18,720 minutes (312 x 60 minutes). Another ‘unproductive work time’ in relation to Room Division activities is the training for
employees that is held once a year for 2 hours, so that the total time for training activity is 120 minutes per employee. These calculations are provided in Appendix Two.
38 more time is spent by employee for that type
of room.Based on this assumption, the percentage used comes from Table data of room sold during 2011 as shown in Appendix three.
Capacity Cost Rate for Room Type: Superior:
The calculation of capacity cost rate for labour is as follows:
Capacity Cost Rate – Labour:
56.34% x 411,450,000 IDR 56.34% x 1,571,160 minutes
231,810,930 IDR 885,192 minutes
= 261.88 IDR/minute
Capacity Cost Rate for Room Type: Deluxe:
The calculation of capacity cost rate for labour is as follows:
Capacity Cost Rate – Labour:
31.98 % 411,450,000 31.98% 1,571,160
131,581,710 502,457
= 261.88 IDR/minutes
Capacity Cost Rate for Room Type: Junior Suite:
The calculation of capacity cost rate for labour is as follows:
Capacity Cost Rate – Labour:
Capacity Cost Rate for Room Type: Royal Suite:
The calculation of capacity cost rate for labour is as follows:
Capacity Cost Rate – Labour:
Determining the TDABC Cost Driver Rates The TDABC Cost Driver Rate for every activity is estimated in unit time. This calculation will result in unit cost, which has become the most important component for the TDABC model. The unit cost reflects how much costs are required for the completion of a single activity.
Because of the calculation of capacity cost rate results in the same amount of costs for all room types (261.88 IDR/minute), the
calculations for TDABC Cost Driver Rate for all room types shown in Appendix Four.
Determining the TDABC Cost of Performing Activities and the Room Cost
This last step determines both the absorption rate resource for each activity and the level of efficiency for each room type. TDABC cost of performing activities was done by multiplying the cost driver rate with quantity of work. This step also delivers the information about the level of used and unused capacity.
The calculation of TDABC cost of
performance will be differentiated
according to the list of activities. It is
important to remember that the hotel has
two types of room rent methods, which are
the
reservation
method
and the
go show
method. The use of one method would
produce different results with the other
methods, due to the large differences in
unit time between the two (reservations
just need 1 minute, while go shows need 4
minutes). Based on the table cost of
performing activities, we can calculate the
room cost. The cost of performing
39
the usage of overhead cost. To calculate
the room cost, the researchers put the
“used capacity” amount as the overhead
cost.
Direct Materials and Direct Labour is
calculated by multiplying with the
percentage of room sold. The researchers
also put the depreciation expense and
electricity and water in the room cost
calculation.
The Superior Room Reservation Cost Calculation in Year 2011
Direct Materials:
1,872,030,000 x 56.34% 1,054,701,702.00 IDR
Direct Labour:
407,550,000 x 56.34%
229,613,670.00
IDR
Overhead: Indirect Labour
64,871,541.49
IDR
Total Cost
1,349,186,913.49
IDR
The Superior Room ‘Go show’ Cost Calculation in Year 2011
Direct Materials:
1,872,030,000 x 56.34%
1,054,701,702.00 IDR
Direct Labour:
407,550,000 x 56.34%
229,613,670.00
IDR
Overhead: Indirect Labour
68,226,966.04 IDR
Total Cost
1,352,542,338.04
IDR
The Deluxe Room Unit Reservation Cost Calculation in Year 2011
Direct Materials:
1,872,030,000 x 31.98%
598,675,194.00
IDR
Direct Labour:
407,550,000 x 31.98%
130,334,490.00
IDR
Overhead: Indirect Labour
36,817,751.48
IDR
Total Cost
765,827,435.48
IDR
The Deluxe Room Unit Reservation Cost Calculation in Year 2011
Direct Materials:
1,872,030,000 x 31.98%
598,675,194.00
IDR
Direct Labour:
407,550,000 x 31.98%
130,334,490.00
IDR
Overhead: Indirect Labour
38,087,329.11
IDR
Total Cost
767,097,013.11
IDR
The Junior Suite Room Reservation Cost Calculation in Year 2011
Direct Materials:
1,872,030,000 x 6.81%
127,485,243.00
IDR
Direct Labour:
407,550,000 x 6.81%
27,754,155.00
IDR
Overhead: Indirect Labour
7,852,630.99
IDR
Total Cost
163,092,028.99
IDR
The Junior Suite Room ‘Go show’ Cost Calculation in Year 2011
Direct Materials:
1,872,030,000 x 6.81%
127,485,243.00
IDR
Direct Labour:
407,550,000 x 6.81%
27,754,155.00
IDR
Overhead: Indirect Labour
8,258,801.56
IDR
40
The Royal Suite Reservation Room Cost Calculation in Year 2011
Direct Materials:
1,872,030,000 x 4.87%
91,167,861.00
IDR
Direct Labour:
407,550,000 x 4.87%
19,847,685.00
IDR
Overhead: Indirect Labour
5,604,682.47
IDR
Total Cost
116,620,228.47
IDR
The Royal Suite Room ‘Go Show’ Cost Calculation in Year 2011
Direct Materials:
1,872,030,000 x 4.87%
91,167,861.00
IDR
Direct Labour:
407,550,000 x 4.87%
19,847,685.00
IDR
Overhead: Indirect Labour
5,894,579.83
IDR
Total Cost
116,910,125.83
IDR
Table 11: Room Cost Comparison Table
Room Type
Room Cost (IDR) Company Initial calculation method
TDABC Method
Reservation Go show
Superior 443,836 405,764.65 406,550.28
Deluxe 590,302 430,141 430,664.77
Junior Suite 736,768 439,957.87 440,743.5
Royal Suite 1,176,166 497,976.8 498,762.44
Source : Data processed by Researchers
From the above calculations it can be seen that the total cost above for the 4,271 ‘Superior’ reservation rooms sold (including
depreciation, electricity and water) is as follows:
Superior Reservation Room Unit Cost:
= (DM+DL+OH) + Depreciation Expense + Electricity expense + Water Expense
1,349,186,913.49 4,271 540,725 x 264,271 + 61,841.5 + 24,736.6 = 405,764.65 IDR
Similarly, the room’s cost forSuperior type for’ go show’ method is 406,550.28 IDR.
These calculations are elaborated in Appendix Five and Six.
From the above calculations it can also be seen that the total cost above for the 2,424 ‘Deluxe’ reservation rooms sold (including
depreciation, electricity and water) is as follows:
Deluxe reservation Room Unit Cost:
= (DM+DL+OH) + Depreciation Expense + Electricity expense + Water Expense
765,827,435.48 2,424 540,725 x 18
2,424
+ 78,707.37 + 31,482.95 = 430,141 IDR
Similarly, the room’s unit cost for Deluxe type for the ‘go show’ method is 430,664.77 IDR.
41 From the above calculations it can also be seen that the total cost above for the 517 ‘Junior Suite’ reservation rooms sold (including depreciation, electricity and water) is as follows:
Junior Suite reservation Room Unit Cost:
= (DM+DL+OH) + Depreciation Expense + Electricity expense + Water Expense
163,092,028.99 517
665,725 x 5517
+ 84,329.32 + 33,731.73 = 439,957.87 IDR
Similarly, the room’s unit cost for a Junior Suite type for ‘go show ‘is 440,743.5 IDR.
These calculations are elaborated in Appendix Nine and Ten.
From the above calculations it can also be seen that the total cost above for the 369 ‘Royal Suite’ reservation rooms sold (including depreciation, electricity and water) is as follows:
Royal Suite reservation Room Unit Cost:
= (DM+DL+OH) + Depreciation Expense + Electricity expense + Water Expense
116,620,228.47369
3,015,725 x 3369 + 112,439.1 + 44,975.64 = 497,976.8 IDR
Similarly, the room’s unit cost for a Royal Suite type for ‘go show is 498,762.44 IDR.
These calculations are elaborated in Appendix Eleven and Twelve.
Traditional vs. TDABC: A
Comparison
Based on the above calculations, we can make a comparison of the results of room cost between company’s initial method and the TDABC method. This comparison Table 11
will help us to see the room cost differences between two methods more clearly.
It can be seen that there are big differences in the results of room cost calculation between the two methods especially in Junior Suite and Royal Suite. This is because the TDABC method calculates that the room service only absorbs an average of 30% of the indirect labour resource supplied.
Conclusion, Suggestions and
Limitations
Based on the result analysis in the previous
paragraphs, the following conclusions can
be drawn: (a) cost calculations with the
TDABC method using unit time and
capacity cost rates which can identify cost
per minute or cost assigned for every
minute in the accomplishment of an
activity is more accurate than the
traditional method used by the case study
company; (b) the calculation based on the
TDABC method also resulted in a cost
driver rate (unit cost) which is more
accurate as a calculation basis for every
process; (c) the unit cost as calculation
basis was also easier and more flexible for
cost allocations than the traditional method
used; (d) in the case of changes in hotel
service structures, the capacity cost rate
can be updated easily: and (e) the
application of TDABC shows that in the
year of 2011, room service should only
absorb average of 30% of indirect labour
resource supplied as their overhead cost.
The following suggestions can be drawn
from the study conducted: (a) the
42
Whilst this may appear a good result at
face value, in actuality it can result in
unoccupied room as competitors are
pricing similar services at a reduced price.
Therefore, it is recommended to decrease
hotel room rates especially for junior suite
and royal suite type as well as doing more
vigorous marketing efforts and cover a
wider area so that it could bring in more
guests.
Another strategy for dealing with the low
resource costs required is that, rather than
directly cutting the resource supplied, for
managers to choose to reserve that
capacity for future growth by adding new
business lines. From the information
provided by TDABC of unused capacity,
manager can forecast how much of the
increased business can be handled by the
existing capacity.
Research Limitations
The limitations in this research are as follows: (a) this research only discusses the room cost in Hotel Graha Cakra Malang, because almost 80% of the hotel’s revenue comes from rooms. A wider application of TDABC to other divisions will show further benefits; (b) there is information that was kept secret by the hotel, such as expenses for business trips that are included as routine expenses, building maintenance, etc. so the researcher cannot include these cost in the calculations; and (c) this research only used TDABC as an example, while the actual implementation of TDABC at the Hotel was beyond the scope of this research.
References
Abdillah, M. (2008). Implementation and
Comparison between Activity-Based
Costing and Time-Driven Activity-Based
Costing for Pricing Policy at PT Sapta
Manunggal Caraka Mulia.
Undergraduate
Thesis
, Faculty of Business and
Economics, Airlangga University,
Surabaya, Indonesia.
Agung, H.D. (2008). Time-Driven
Activity-Based Costing for Cost
Calculation at Rumah Sakit Anak Bersalin
“X” Sidoarjo
. Undergraduate Thesis.
Faculty of Business and Economics,
Airlangga University, Surabaya,
Indonesia.
Blocher, E.J,, Stout, D.E., Cokins, G. and
Chen. K. (2008).
Cost Management: A
Strategic Emphasis
. Fourth Edition,
McGraw Hill, New York, USA.
Carter, W. K. (2006).
Cost Accounting
.
Fourteenth Edition. Thomson, Mason,
USA.
Crosson, S.V and Needles. B E. (2008).
Managerial Accounting
. Eighth Edition,
Houghton Mifflin Boston, Mass, USA.
Eoh, T.S. (2012). Designing Time-Driven
Activity-Based Costing Model for
determining Standard Unit Cost of
Education at Universitas “X”.
Master of
Accounting Thesis
, Faculty of Business
and Economics, Airlangga University,
Surabaya, Indonesia.
Hansen, D.R. and Mowen, M.M. (2007).
Managerial Accounting
. Eighth Edition.
Thomson South West, Mason, USA.
Hilton, R. and Platt. D. (2011).
Managerial Accounting: Creating Value in
Global Business
. Environment Global
Edition, McGraw Hill, New York, USA.
Kaplan, R.S. and Cooper, R. (1998).
Cost
and Effect
. Harvard Business School Press,
Boston, Mass, USA.
Kaplan, R.S and Anderson, S.R. (2007).
Time-Driven Activity-Based Costing
,
Harvard Business School Press, Boston,
Mass, USA.
Manalo, M.V. (2012).
Activity based
costing (ABC) vs traditional cost
accounting system among Top 500
corporations in the Philliphines 2004,
43
cbord/ pdf/papersworking%20paper
%20series% 202004-1 1 pdf. Accessed
January, 17 2012
Mohan, D. and Hemantkumar, P. (2003)
Activity Based Costing for Strategic
Decisions Support
, http \\www.wipro.com
July, 25 2012. 11:20 am
Noreen, E.W., Brewer, P.C. and Garrison,
R.H. (2008).
Managerial Accounting
.
McGrawHill, New York, USA.
Oxford University Press. 2000.
Oxford
Learner’s Pocket Dictionary: New Edition
,
Oxford University Press, London, United
Kingdom.
Ratnatunga, J., Tse, M.S.C., and
Balachandran, K.R. (2012). Cost
management in Sri Lanka: A case study on
volume, activity and time as cost drivers,
The International Journal of Accounting
,
47(3): 281-301.
Reeve, J.M., Warren, C.S., and Duchac,
J.E. (2007).
Principles of Accounting
.
Twenty Second Edition, Thomson South
Western, Mason, USA.
Tatum, M. (2012). Cost System, (Online),
(http://www.wisegeek.com, accessed July
25 2012)
Whitecotton, S., Libby, R. and Philips, F.
(2011).
Managerial Accounting
. McGraw
Hill, New York, USA.
44
Appendix One: List of Activities and the Unit Time Table
No Activity Cost
Pool Detail of Activity
Time per activity (minute)
Total time each coat pool (minutes) 1. Administration
(Check in)
Welcoming Guest 1 Go show : 9
Reservation : 6 Asked on whether the guest has made a
previous reservation or go show
1
If go show
Record the guest data
4
If reservation
Ask for proof of a reservation, Do some checking
1
Provide guest room key 1 Asking guests if there are any valuable
goods that want to be stored in safety box, because there is not safety box in each rooms
2
2. Greeting Provide a welcoming basket food and drink to the guests
5 5
3. Accompanying the guest
Carries the guest’s stuffs and take guests into the room
10 10
4. SDM (sweeping, dusting mopping)
Housekeeping doing room cleaning 25 25
5. Administration (check out)
FO contact HK for room check, is there any goods that bought by guest and checking for guest stuff that is left front
6 12
FO contact FandB to check out the guest dining Bill
2
Print the bill 1
Ask for guest’s signature 1
Receive the payment 2
TOTAL Go show 61
45
Appendix Two: Practical Capacity Resource Used – Employee Working Time
No Position Qty Work
Time (minutes)
Unproductive Time
(minutes) Total
Effective minutes
Rest Trai
ning Total
1. General
Manager 1 149,760 18,720 - 18,720 131,040
2. Front Office
Manager 1 149,760 18,720 120 18,840 130,920
3. Front Office
Coordinator 1 149,760 18,720 120 18,840 130,920 4. Receptionist 4 149,760 18,720 120 18,840 523,680 5. Bellboy 3 149,760 18,720 120 18,840 392,760
6. Front Office
Cashier 2 149,760 18,720 120 18,840 261,840
TOTAL 1,571,160
Total Effective minutes is a result from multiplication process with quantity of employee for each position
Source: Company Internal data processed
Appendix Three: Data of Room Sold during the year of 2011
No. Month
Room type
TOTAL Superior Deluxe Junior
Suite Royal Suite
1. January 329 184 48 23 552
2. February 321 171 35 29 598
3. March 388 209 47 34 674
4. April 352 185 39 31 623
5. May 392 226 41 34 694
6. June 415 278 49 36 721
7. July 401 268 53 36 736
8. August 362 172 43 32 643
9. September 351 198 35 31 618
10. October 310 179 28 26 562
11. November 327 165 45 29 589
12. December 323 189 54 28 570
TOTAL 4,271 2,424 517 369 7,580
Percentage 56.34% 31.98% 6.81% 4.87% 100%
46
Appendix Four: TDABC Cost Driver Rates
No Activity
TDABC Cost Driver Unit Time
(minute) Rate–Labour (at
261.88IDR/minute)
(1) (2) (3) (4)
1. Welcoming Guest 1 261.88
2. Asked on whether the guest has made
a previous reservation or go show 1 261.88
3. If go show
Record the guest data 4 1,047.50
4.
If Reservation
Ask for proof of a reservation Do some checking
1 261.88
5. Provide guest room key 1 261.88
6.
Ask the guests if there are any valuable goods that want to be stored in safety box, because there is not safety box in each rooms
2 523.75
7. Provide a welcoming basket food and
drink to the guests 5 1,309.38
8. Carries the guest’s stuffs and take
guests into the room 10 2,618.76
9. Housekeeping doing room cleaning 25 6,546.91
10.
FO contact HK for room check, is there any goods that bought by guest and checking for guest stuff that is left front
6 1,571.26
11. FO contact FandB to check out the
guest dining Bill 2 523.75
12. Print the bill 1 261.88
13. Ask for guest’s signature 1 261.88
14. Receive the payment 2 523.75
Columns 2 explain list of activities based on table 4.14 (table of activities)
Columns 3 explain time estimation based on the result from stopwatch that brought by researcher and interview
47
Appendix Five: TDABC Cost of Performing Activities (Superior- Reservation)
No Activity Qty
Time (minute)
Cost (IDR)
Unit Total Unit Total
1 2 3 4 5 = 3 x 4 6 7 = 3 x 6
1
Welcoming Guest 4,271 1 4,271 261.88 1,118,474.85
2 Asked on whether the guest has made a previous reservation or go
show 4,271 1 4,271 261.88 1,118,474.85
3 Ask for proof of a reservation
Do some checking 4,271 1 4,271 261.88 1,118,474.85
4 Provide guest room key 4,271 1 4,271 261.88 1,118,474.85
5 Asking guests if there are any valuable goods that want to be stored in
safety box, because there is not safety box in each rooms 4,271 2 8,542 523.75 2,236,949.71 6 Provide a welcoming basket food and drink to the guests 4,271 5 21,355 1,309.38 5,592,374.27 7 Carries the guest’s stuffs and take guests into the room 4,271 10 42,710 2,618.77 11,184,748.53 8 Housekeeping doing room cleaning 4,271 25 106,775 6,546.91 27,961,871.33 9 FO contact HK for room check, is there any goods that bought by guest
and checking for guest stuff that is left front 4,271 6 25,626 1,571.26 6,710,849.12 10 FO contact FandB to check out the guest dining Bill 4,271 2 8,542 523.75 2,236,949.71
11 Print the bill 4,271 1 4,271 261.88 1,118,474.85
12 Ask for guest’s signature 4,271 1 4,271 261.88 1,118,474.85
13 Receive the payment 4,271 2 8,542 523.75 2,236,949.71
Used Capacity 247,718
64,871,541.49
Unused Capacity 637,474 166,939,388.51
TOTAL , , ,
JA
MAR
Vol
. 12 · No. 1 ·
20
14
48
Appendix Six: TDABC Cost of Performing Activities (Superior- Go show)
No Activity Qty
Time (minute)
Cost (IDR)
Unit Total Unit Total
1 2 3 4 5 = 3 x 4 6 7 = 3 x 6
1 Welcoming Guest 4,271 1 4,271 261.88 1,118,474.85
2 Asked on whether the guest has made a previous reservation or go
show 4,271 1 4,271 261.88 1,118,474.85
3 Record the guest data 4,271 4 17,084 1,047.51 4,473,899.41
4 Provide guest room key 4,271 1 4,271 261.88 1,118,474.85
5 Asking guests if there are any valuable goods that want to be stored in
safety box, because there is not safety box in each rooms 4,271 2 8,542 523.75 2,236,949.71 6 Provide a welcoming basket food and drink to the guests 4,271 5 21,355 1,309.38 5,592,374.27 7 Carries the guest’s stuffs and take guests into the room 4,271 10 42,710 2,618.77 11,184,748.53 8 Housekeeping doing room cleaning 4,271 25 106,775 6,546.91 27,961,871.33 9 FO contact HK for room check, is there any goods that bought by guest
and checking for guest stuff that is left front 4,271 6 25,626 1,571.26 6,710,849.12 10 FO contact FandB to check out the guest dining Bill 4,271 2 8,542 523.75 2,236,949.71
11 Print the bill 4,271 1 4,271 261.88 1,118,474.85
12 Ask for guest’s signature 4,271 1 4,271 261.88 1,118,474.85
13 Receive the payment 4,271 2 8,542 523.75 2,236,949.71
Used Capacity 260,531
68,226,966.04
Unused Capacity 624,661 163,583,964.96
TOTAL , , ,
JA
MAR
Vol
. 12 · No. 1 ·
20
14
49
Appendix Seven: TDABC Cost of Performing Activities (Deluxe- Reservation)
No Activity Qty Time
(minute)
Cost (IDR)
Unit Total Unit Total
1 2 3 4 5 = 3 x 4 6 7 = 3 x 6
1 Welcoming Guest 2,424 1 2,424 261.88 634,788.82
2 Asked on whether the guest has made a previous reservation or go show 2,424 1 2,424 261.88 634,788.82
3 Ask for proof of a reservation
Do some checking 2,424 1 2,424 261.88 634,788.82
4 Provide guest room key 2,424 1 2,424 261.88 634,788.82
5 Asking guests if there are any valuable goods that want to be stored in
safety box, because there is not safety box in each rooms 2,424 2 4,848 523.75 1,269,577.64 6 Provide a welcoming basket food and drink to the guests 2,424 5 12,120 1,309.38 3,173,944.09 7 Carries the guest’s stuffs and take guests into the room 2,424 10 24,240 2,618.77 6,347,888.19 8 Housekeeping doing room cleaning 2,424 25 60,600 6,546.91 15,869,720.46
9 FO contact HK for room check, is there any goods that bought by guest
and checking for guest stuff that is left front 2,424 6 14,544 1,571.26 3,808,732.91 10 FO contact FandB to check out the guest dining Bill 2,424 2 4,848 523.75 1,269,577.64
11 Print the bill 2,424 1 2,424 261.88 634,788.82
12 Ask for guest’s signature 2,424 1 2,424 261.88 634,788.82
13 Receive the payment 2,424 2 4,848 523.75 1,269,577.64
Used Capacity 140,592
36,817,751.48
Unused Capacity 361,865 94,763,958.52
TOTAL , , ,
JAMA
R
V
o
l. 12 · No. 1
·
20
14
50
Appendix Eight: TDABC Cost of Performing Activities (Deluxe- Go show)
No Activity Qty Time
(minute)
Cost (IDR)
Unit Total Unit Total
1 2 3 4 5 = 3 x 4 6 7 = 3 x 6
1 Welcoming Guest 2,424 1 2,424 261.88 634,788.82
2 Asked on whether the guest has made a previous reservation or go
show 2,424 1 2,424 261.88 634,788,82
3 Record the guest data 2,424 4 9,696 1,047.51 2,539,155.27
4 Provide guest room key 2,424 1 2,424 261.88 634,788.82
5 Asking guests if there are any valuable goods that want to be stored
in safety box, because there is not safety box in each rooms 2,424 2 4,848 523.75 1,269,577.64 6 Provide a welcoming basket food and drink to the guests 2,424 5 12,120 1,309.38 3,173,944.09
7 Carries the guest’s stuffs and take guests into the room 2,424 10 24,240 2,618.77 6,347,888.19
8 Housekeeping doing room cleaning 2,424 25 60,600 6,546.91 15,869,720.46
9 FO contact HK for room check, is there any goods that bought by
guest and checking for guest stuff that is left front 2,424 6 14,544 1,571.26 3,808,732.91 10 FO contact FandB to check out the guest dining Bill 2,424 2 4,848 523.75 1,269,577.64
12 Ask for guest’s signature 2,424 1 2,424 261.88 634,788.82
13 Receive the payment 2,424 2 4,848 523.75 1,269,577.64
Used Capacity 150,456
38,087,329.11
Unused Capacity 352,001 93,494,380.89
TOTAL , , ,
J
A
MAR
Vol
. 12 · No. 1 ·
20
14
5
51
Appendix Nine: TDABC Cost of Performing Activities (Junior Suite- Reservation)
No Activity Qty Time
(minute)
Cost (IDR)
Unit Total Unit Total
1 2 3 4 5 = 3 x 4 6 7 = 3 x 6
1 Welcoming Guest 517 1 517 261.88 135,390.19
2 Asked on whether the guest has made a previous reservation or go
show 517 1 517 261.88 135,390.19
3 Ask for proof of a reservation
Do some checking 517 1 517 261.88 135,390.19
4 Provide guest room key 517 1 517 261.88 135,390.19
5 Asking guests if there are any valuable goods that want to be stored in
safety box, because there is not safety box in each rooms 517 2 1,034 523.75 270,780.38 6 Provide a welcoming basket food and drink to the guests 517 5 2,585 1,309.38 676,950.95 7 Carries the guest’s stuffs and take guests into the room 517 10 5,170 2,618.77 1,353,901.89 8 Housekeeping doing room cleaning 517 25 12,925 6,546.91 3,384,754.74
9 FO contact HK for room check, is there any goods that bought by
guest and checking for guest stuff that is left front 517 6 3,102 1,571.26 812,341.14 10 FO contact FandB to check out the guest dining Bill 517 2 1,034 523.75 270,780.38
11 Print the bill 517 1 517 261.88 135,390.19
12 Ask for guest’s signature 517 1 517 261.88 135,390.19
13 Receive the payment 517 2 1,034 523.75 270,780.38
Used Capacity 29,986
7,852,630.99
Unused Capacity 77,010 20,167,114.01
TOTAL , , ,
JA
MAR
Vol
. 12 · No. 1 ·
20
14
52
Appendix Ten: TDABC Cost of Performing Activities (Junior Suite- Go show)
No Activity Qty Time
(minute)
Cost (IDR)
Unit Total Unit Total
1 2 3 4 5 = 3 x 4 6 7 = 3 x 6
1 Welcoming Guest 517 1 517 261.88 135,390.19
2 Asked on whether the guest has made a previous reservation or go
show 517 1 517 261.88 135,390.19
3 Record the guest data 517 4 2,068 1,047.51 541,560.76
4 Provide guest room key 517 1 517 261.88 135,390.19
5 Asking guests if there are any valuable goods that want to be stored
in safety box, because there is not safety box in each rooms 517 2 1,034 523.75 270,780.38 6 Provide a welcoming basket food and drink to the guests 517 5 2,585 1,309.38 676,950.95 7 Carries the guest’s stuffs and take guests into the room 517 10 5,170 2,618.77 1,353,901.89 8 Housekeeping doing room cleaning 517 25 12,925 6,546.91 3,384,754.74
9 FO contact HK for room check, is there any goods that bought by
guest and checking for guest stuff that is left front 517 6 3,102 1,571.26 812,341.14 10 FO contact FandB to check out the guest dining Bill 517 2 1,034 523.75 270,780.38
11 Print the bill 517 1 517 261.88 135,390.19
12 Ask for guest’s signature 517 1 517 261.88 135,390.19
13 Receive the payment 517 2 1,034 523.75 270,780.38
Used Capacity 31,537
8,258,801.56
Unused Capacity 75,459 19,760,943.44
TOTAL , , ,
J
A
MAR
Vol
. 12 · No. 1 ·
20
14
53
Appendix Eleven: TDABC Cost of Performing Activities (Royal Suite- Reservation)
No Activity Qty
Time (minute)
Cost (IDR)
Unit Total Unit Total
1 2 3 4 5 = 3 x 4 6 7 = 3 x 6
1 Welcoming Guest 369 1 369 261.88 96,632.46
2 Asked on whether the guest has made a previous reservation or go
show 369 1 369 261.88 96,632.46
3 Ask for proof of a reservation
Do some checking 369 1 369 261.88 96,632.46
4 Provide guest room key 369 1 369 261.88 96,632.46
5 Asking guests if there are any valuable goods that want to be stored in
safety box, because there is not safety box in each rooms 369 2 738 523.75 193,264.91 6 Provide a welcoming basket food and drink to the guests 369 5 1,845 1,309.38 483,162.28 7 Carries the guest’s stuffs and take guests into the room 369 10 3,690 2,618.77 966,324.56 8 Housekeeping doing room cleaning 369 25 9,225 6,546.91 2,415,811.41
9 FO contact HK for room check, is there any goods that bought by
guest and checking for guest stuff that is left front 369 6 2,214 1,571.26 579,794.74 10 FO contact FandB to check out the guest dining Bill 369 2 738 523.75 193,264.91
11 Print the bill 369 1 369 261.88 96,632.46
12 Ask for guest’s signature 369 1 369 261.88 96,632.46
13 Receive the payment 369 2 738 523.75 193,264.91
Used Capacity 21,402
5,604,682.47
Unused Capacity 55,114 14,432,932.53
TOTAL 76,516 , ,
JAMA
R
V
o
l. 12 · No. 1 ·
20
14
54
Appendix Twelve: TDABC Cost of Performing Activities (Royal Suite- Go show)
No Activity Qty Time
(minute)
Cost (IDR)
Unit Total Unit Total
1 2 3 4 5 = 3 x 4 6 7 = 3 x 6
1 Welcoming Guest 369 1 369 261.88 96,632.46
2 Asked on whether the guest has made a previous reservation or go
show 369 1 369 261.88 96,632.46
3 Record the guest data 369 4 1,476 1,047.51 386,529.83
4 Provide guest room key 369 1 369 261.88 96,632.46
5 Asking guests if there are any valuable goods that want to be stored
in safety box, because there is not safety box in each rooms 369 2 738 523.75 193,264.91 6 Provide a welcoming basket food and drink to the guests 369 5 1,845 1,309.38 483,162.28 7 Carries the guest’s stuffs and take guests into the room 369 10 3,690 2,618.77 966,324.56 8 Housekeeping doing room cleaning 369 25 9,225 6,546.91 2,415,811.41
9 FO contact HK for room check, is there any goods that bought by
guest and checking for guest stuff that is left front 369 6 2,214 1,571.26 579,794.74 10 FO contact FandB to check out the guest dining Bill 369 2 738 523.75 193,264.91
11 Print the bill 369 1 369 261.88 96,632.46
12 Ask for guest’s signature 369 1 369 261.88 96,632.46
13 Receive the payment 369 2 738 523.75 193,264.91
Used Capacity 22,509
5,894,579.83
Unused Capacity 54,007 14,143,035.17
TOTAL 76,516 , ,
JAMA
R
V
o
l. 12
· No. 1 ·
2
014