Int. J. of GEOM
Faculty of Engineering, Unive 3rdInternational Confe Bukittinggi : October 1
This proceeding aims
or literature review in the f
have been presented in 3rd
taken place in Rocky Hotel B
The theme of Confere
education and training for
globalization era, and par
challenges, we need the i
Vocational and technical educ
of education and work in or
Undoubtedly, TVET
Gufron Ph.D (Directorate
Education-Indonesia), and
They all have a great contribut
Finally, thank a milli
success of 3
rdInternationa
gratitude to all scholars who suppor
OMATE, Month, Year, Vol.00, No.00 (Sl. No. 00), pp.
00-niversitas Negeri Padang
nference on Technical and Vocation Education and Train er 16-17, 2015
FOREWORDS
ms to disseminate valuable ideas and issues ba
e field of vocational, technical and engineering
3rd International Conference on TVET. This
otel Bukittinggi West Sumatra, October 16 and 17,
onference focused on the perspective of technical
or sustainable society to face the challenges of
particularly Asian Economic Community. To
e innovation and change in human resource
education and training have essential roles to c
order to establish sustainable society.
T need to enhance the quality of learning
ive learning, including learning in the
innovation and applied engineering as well
nt of management and leadership in TVET
onal and technical teacher education.
search findings have been shared and discussed
have been collected and selected through schol
rs’
.as well as teachers, professors, and post gra
onference.
kers have taken apart in the conference, namely
sity-USA), Prof. Yusuke Ono (Tottori Universi
him Ph.D (University of Malaya, Malaysia), a
ate General of Human Resources Developm
d Syahril Ph.D (Dean of Faculty Engineering
tribution for the success of the conference.
illion for all participants of the conference who
onal conference on TVET 2015. and most im
ho support and tolerated our mistake during the
Table Of Contents
1. PostgreSQL, A Platform for Multiple Sources Data Retrieval,
Abdul Yadi ... 1 2. Information Retrieval System For Research Abstract Using Genetic Algorithm With Jaccard
Similarity Factor
Elin Haerani, Rubanam ... 9 3. Addie Model Approach Through The Task Learning Course Of Knowledge In Textile Clothing
Depateman Procedures State University Educational Field
Dina Ampera ... 16 4. Role Of Information Technology In Education Entrepreneurship In Higher Education, Gunawan
Ali, Wulan Andang Purnomo, Wahyu Prima ... 22 5. Development Media Study Of Natural Culture Minangkabau With Kim
Arga Budaya ... 26 6. Improving Quality Community-Based Education
Zonny Amanda Putra ... 33 7. Study Of Student Learning Activities On The Subject Of Physics Using Cooperative Learning In
State 3 Of Senior High Schools In Bungo
Despita, Agus Suparno ... 39 8. The Role Of Locus Control And Learning Styles In The Development Of The Blended Learning
Model At UNP
Z. Mawardi Effendi, Hansi Effendi, Hastria Effendi ... 43 9. Learning Outcomes In Vocational Education: A Business Plan Development By Production-Based
Learning Model Approach
Indrati Kusumaningrum, Hendra Hidayat, Ganefri, Sartika Anori, Mega Silfia Dewy ... 49 10. Effect Of Social Network Of Adolescent Learning Behaviour
Ikhwansyah ... 62 11. Implementation Of Media Interactive Learning Based Wlan Technology (Study At SMK Kampar)
Kori Cahyono ... 68 12. Model Development Work-Based Learning The Course Of Blasting Mining Engineering
Department
Murad ... 73 13. Professional Development Of Vocational Teachers Padang Through Advanced Education And
Training
Ramli ... 82 14. Intelligent System Design "QAIS" Based On Artificial Intelligence At The University Of
Muhammadiyah Riau LPMI
Resmi Darni ... 90 15. Geographic Information System Design Shortest Route Location-Based Health Care Android
Rice Novita, Welita ... 95 16. Implementation Of Green Productivity To Increase Productivity And Environmental Performance
(Case Study At Sme Bowo )
Riko Ervil, Nesky Luciana ... 101 17. Strategy Implementation Of Supervision In Vocational High School In Bungo, Jambi
Sayuti Hamzan, Eman Tu Ferli ... 105 18. Learning Of Crystal Symmetry By Using 3Ds Max Software
Baharuddin,Indra Daulay ... 115 20. Development Of Blended Learning Model In Human-Computer Interaction At University
Faiza Rini, Ari Saiful Arifin Rahman ... 120 21. Online Tracer Study Of Bung Hatta University
Karmila Suryani, Khairudin ... 127 22. Identifying Initial Damage Of Palm Oil Screw Press Of Drive Shaft
Purwo Subekti, Eddy Elfiano, Legisnal Hakim ... 134 23. Weather Stations Prototype To Flood Detection In High Rainfall Area
Yulastri, Era Madona, Lifwarda, Anggara Nasution ... 139 24. An Evaluation Of Electricity Construction Service Industrial Needs-Based Electrical Installer
Sukardi, M. Giatman ... 143 25. System Management Development Universal Intermediate Education Towards Compulsory 12
Years
Muhammad Sahnan, Daswarman ... 155 26. English Specific Purposes, Elda Martha Suri ... 164 27. Need Assessment By Nominal Group Technique Student Learning Programme
Syafiatun Siregar ... 167 28. Vocational And Technical Teachers Educations
Ungsi, AOM ... 172 29. Analysis Of Vocational Learning System In Department Of Education Building Technique
Kinanti Wijaya, Asri Lubis ... 175 30. Learning Based On Student Thinking
Dedy Irfan ... 180 31. Teaching And Learning Through The Virtual Laboratory
Aswardi ... 186 32. Reforming Fishery Study Expertise Program Of Vocational High Schools (VHSS) Adapted To New
Paradigm Of Fishery Resorces Management
Asahan Pasaribu ... 190 33. Application Information System Rental Facilities At The Universitas Lancang Kuningbased Online
NurlianaNasution, Mhd. Arief Hasan, Yummastian ... 198 34. An Improving Of The Soft Skills And Hard Skill Abilities For Vocational High Schools Students In
Learning Process On Service Production Units
Adi Sutopo ... 202 35. Biometric Application For Eyeiris’sdetection Based Artificial Neural Network Using Discrete
Hopfield Algorithm
Dicky Nofriansyah, Haryadi, Amrizal ... 207 36. The Effect Of Instructional Drill And Practice Method And Low Self-Efficacy Toward Fashion
Drawing Achievement At SMK Negeri Medan
Farihah ... 214 37. Study Of Ground Water Contamination By Leachate Around Air Dingin Landfill Padang
Yaumal Arbi, Tri Padmi Damanhuri, Idris Maxdoni Kamil ... 218 38. Service Excellence Competence Enhancement For Students Of Finance And Banking Diploma III
Faculty Of Economics Uii To Increase Competitiveness Level To Face Asean Economic Community Aidha Trisanty, Nurfauziah ... 228 39. Need And Analysis Of Soft Skills For Students Of The Mechanical Engineering Department Of
Vocational High School
40. Environment Influence Toward Operational Performance In Handcraft Central Industry Silungkang Village Sawahlunto
Rasidah Nasrah ... 239 41. Optimizing The Personal Website Of The Publication Educator By Applying UML
Erdisna, Muhammad Ikhlas ... 242 42. An Evaluation Study On The Effectiveness Of Evacuation Routes Utilization In The Tsunami
Potential Area At Padang City
Fitra Rifwan... 248 43. Needs Analysis Of English For Mechanical Engineering Students
Martini ... 254 44. Characteristics Of The Permeability Coefficient (K) At The Regional Flood Inundation Often In
Padang
Totoh Andayono, Fitra Rifwan ... 258 45. Pengembangan Model E-Learning Dan E-Assessment Berorientasi Problem Based Learning Pada
Mata Pelajaran ‘Memelihara Transmisi’ Pada Kelas XI Kompetensi Keahlian Teknik Kendaraan Ringan-SMK Di Sentra Pendidikan BLPT Padang
Wakhinuddin ... 262 46. Modeling Unified Modeling Language (Uml) For The Implementation Of E-Community Alumni
(Case Study In Graduate Program Upi “YPTK” Padang)
Febriyanno Suryana, Masriadi, Eryunizon ... 273 47. Evaluation Program Work Practice Industry (Prakerin) In The Era Centralized Vocational
Education In The West Sumatra Using Model CIPPO, Ambiyar ... 278 48. The Need Analysis For The Design Of The Entrepreneurship Product-Oriented Graphical Design
Interactive CD Of The Students Of SMK Of Dharmasraya Regency
Kasman Rukun, Asrul Huda, Yeka Hendriyani ... 286 49. Transient Response Study on Transformer Windings Under Impulse Voltage Stresses
Hendri Masdi, Rusnardi Rahmat ... 291 50. Design Of Portal Door In Vehicles Parking System Using Programmable Logic Device (PLD)
Technology
Muhammad Irmansyah, Era Madona, Amelia Yolanda, Ratna Dewi ... 296 51. Ground Motion Characteristics In Padang, Indonesia
3rd
International Conference on Technical and Vocation Education and Training Bukittinggi : October16-17, 2015
ABSTRACT: Several powerful earthquakes have struck Padang during recent years, one of the largest of which was an M 7.6 event that occurred on September 30, 2009 and caused more than 1000 casualties. Following the event, we conducted a questionnaire survey to estimate the shaking intensity distribution during the earthquake. About 500 residents of Padang were interviewed. The residents received explanations for each item on the questionnaire from the interviewers, and answers were filled in directly on the answer sheets. From this survey we produced a map of the shaking intensity distribution in Padang. In addition to the questionnaire survey, we performed single observations of microtremors at 110 sites in Padang. The results enabled us to estimate the site-dependent amplification characteristics of earthquake ground-motion. We also conducted a 12-site microtremor array investigation to gain a representative determination of the soil condition of subsurface structures in Padang. From the dispersion curve of array observations, the central business district of Padang corresponds to relatively soft soil condition with Vs30 less than 400 m/s, the predominant
periods due to horizontal vertical ratios (HVSRs) are in the range of 2.0 to 4.0 s, and the seismic intensity obtained is upper 5 (5+) in the JMAi scale. By making these observations, we can
obtain a relationship between soil types, predominant periods and seismic intensities.
Keywords: Peak Ground Acceleration, Seismic Intensity of the Japan Meteorology Agency, Padang Earthquake, MicrotremorObservations.
I. INTRODUCTION
Seismic intensity is one of the simplest and most important parameters for describing the degree of ground shaking during an earthquake. Sometimes it has a strong correlation with the human response to ground shaking, observations of damage, and earthquake effect. In this study, we adopt the seismic intensity scale of the Japan Meteorology Agency (IJMA) scale, an instrumental seismic intensity that was first adopted in Japan after the 1995 Kobe earthquake. Its scale runs from 0 to 7, with ten classes including lower 5, upper 5, lower 6 and upper 6. We propose the use of the instrumental IJMA to make initial and fast estimations of damage following a seismic event.
The city of Padang,locatedon the west coast of Sumatra in western Indonesia, lies close to the Sumatran subduction zone that is formed by the subduction of the Indo-Australian Plate beneath the Eurasian Plate. Relative motion of the plates occurs at a rate of about 50 to 70 mm/year and this is the main source of subduction-related seismicity in the area [1]. Based on our catalog, seven giant earthquakes have occurred in this
region since records began: 1779 (Mw 8.4), 1833 (Mw 9.2), 1861 (Mw 8.3), 2004 (Mw 9.2), 2007 (Mw 7.9 and 8.4) and
2009 (Mw 7.6). The hypocenter of the Padang earthquake that occurred on September 30,2009 was located in the ocean slab of the Indo-Australian Plate at -0.81°S, 99.65°E andat a depth of 80 km. It produced a high degree of shakingand the
tremor was felt in the Indonesian capital, Jakarta, about 923 km from the epicenter. The tremors also were felt in neighboring countries such as Malaysia and Singapore [2]. The earthquake caused landslides and collateral debris flows in the hills surrounding Lake Maninjau. A major landslide in GunungNan Tigo, Padang Pariamancompletely destroyed some villages and forced road closures.
This 1900-km-long active strike-slip fault zone that runs along the backbone of Sumatra poses seismic and fault hazards to a dense population distributed on and around the fault zones [3]. The Sumatran Fault is highly segmented. It consists of 20 major geometrically defined segments and the slip rate along the fault increase to the northwest, from about 5 mm/yr[3]. This fault also has generated large destructive earthquakes, e.g.,1892 (Mw 7.1), 1943 (Mw 7.6) and 2007 (Mw 6.4). These faults are capable of generating strong ground motion in the future that would greatly affect vulnerable structures. According to our catalogs, the Sumatran Fault produces a very high annual rate of earthquakes, many of which occur in the shallow region under the island of Sumatra (Fig. 1).
Faculty of Engineering, Universitas Negeri Padang 1
Rusnardi.R1, Hendri2, Syahr3 ,Henny Yustisia1,
1Civil Engineering Department, Padang State
University, Indonesia
3rd
International Conference on Technical and Vocation Education and Training Bukittinggi : October16-17, 2015
3rd
International Conference on Technical and Vocation Education and Training Bukittinggi : October16-17, 2015
Fig.1 seismicity of sumatra island from 2005 to 2010,mw>6.5, <100km depth of hypocenter, and padang city.
1. REGIONAL GEOLOGY AND RECENT EARTHQUAKES
Kurinci Padang
The city of Padang, with a population of 856,814 people as of 2008, is the capital of West Sumatra province. The location of the city center is at 100.38°E, 0.95°S. The main part of Padang is situated on an alluvial plain between the Indian Ocean and the mountains. For the most part, the mountainous area is formed of Tertiary sedimentary rocks with outcrops of metamorphic rocks seen in some places. The alluvial plain spreads along the base of the mountains and is roughly 10 km wide in the east-west direction and 20 km wide in the north-south direction.
(a) Padang (a) (a)
The topography of the Padang region (Fig.4(a)) is very similar to the tsunami-damaged area of Miyagi Prefecture in Japan, that was inundated by as much as 4-5 km from the coast after the March 11, 2011 Mw 9.0 Tohoku earthquake off the east coast of Honshu. In Padang, about 600,000 people live in the coastal area (covering about 60 km2). The population density is very high, about 8500 people/km2. The city is located on the coast of the Indian Ocean between the Sumatran Fault and the Sunda Trench Fault. Both faults are active with slip rate ranging from10 to 27 mm/year [3]. According to our catalog, 2995 events with a magnitude greater than 4 occurred in this region from AD 1779 to 2010. The seven giant earthquakes mentioned previously have all been strongly felt here. For
example, the source of the 2009 Padang earthquake was located in the ocean slab of the Indo-Australian Plate.
It produced extensive shaking and severe damage to tsunami of significance [4].Due to this earthquake, 1117 people were reported killed, 1214 severely injured, 1688 slightly injured, and 3 were left missing in West Sumatra. The earthquake also destroyed many houses, buildings and infrastructure (heavily damaged houses numbered 114,797, with 67,198 moderately damaged and 67,837 slightly damaged). In Padang,5458 buildings sustained damage [5]. This event occurred at the end of the working day, just 15 minutes afteroffices and schools closed; if it had struck earlier, the number of causalities would definitely have been higher as a result of building collapses. Several hours after Padang earthquake, 1st
October 2009, Sumatran fault line generated Mw7.1 and 10km depth. Due to this earthquake destroyed many houses and building (heavily damaged houses numbered 600, with 550 moderately damaged). Fig.2(a) shows Padang earthquake and Kurinci earthquake.
(b)
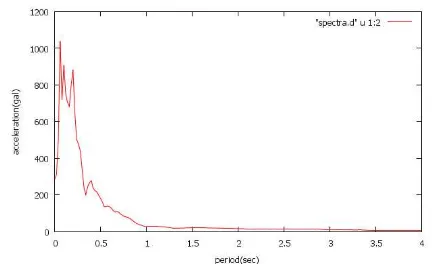
There are four accelerometers in Padang. Three were donated by Engineers Without Borders Japan (EWBJ) and installed in 2008, and the other was installed by the Indonesian Government’s Bureau of Meteorology, Climatology and Geophysics (BMKG). However, only one ground motion record is available for the Padang earthquake. Due to an electric power cut during the earthquake, only the BMKG device recorded the time history of the earthquake. The observed record shows about 20 s of strong shaking with a peak ground acceleration (PGA) of 0.3 g and a predominant
period of 0.5 s (Fig. 2(b)). response spectra at law period is greater then Indonesia code for rock condition (0.83g)
(Fig.2b).The location of this station is a mountainous suburb about 12 km in from the coast.The subsurface conditionat this station is rocky; the average shear wave velocity for the upper 30 mof the subsurface here, Vs30, is 1200 m/s [6].
(c)
Fig.2 Seismicity and time series. (a) two giant earthquake in
Padang Mw7.6 and Kurunci Mw7.1, (b) time series of Padang earthquake, (c) response spectra due to Padang earthquake.
The paucity of measured ground motion information for this earthquake results in a need for transforming observed data (seismic intensity) into parameters that are
3rd
International Conference on Technical and Vocation Education and Training Bukittinggi : October16-17, 2015
more usefulfor engineering purpose (e.g., engineering ground-motion measures)[7]. From seismic intensity, we can evaluate historical earthquakes, assess seismic hazard and damage, correlate different intensity scales, and rapidly assess the severity of ground shaking [8]. In additional, we performed a 12-site microtremor array observations to determine the shear velocity of subsurface structures at several districts in Padang. From these observations, we obtained relationship between soil types, predominant periodand seismic intensity.
2. DAMAGE FROM THE 2009 PADANG EARTHQUAKE
The city of Padang covers an area of about 695 km2 and is divided into 11 districts: B. T. Kabung, K. Tangah, Kuranji, L. Begalung, L. Kilangan, Nanggalo, P. Barat, P. Selatan, P.Timur, P. Utara, and Pauh. 51.0% of the land is forested, 28.52% is used for farming, 9.54% for housing and 7.1% for rice fields [9]. The population of more than 857,000 is increasing by 2% per year. The K. Tangah district has the highest population and most extensive area compared with the other districts in the city.
The central business area of Padang is close to the coast and consist of several district: P. Barat, P. Utara, P. Selatan and P. Timur, B.T. Kabung, K. Tangah. The downtown area is utilized as a center of political and commercial activities. Although the Padang earthquake affected all districts of the city, the major damage occurred downtown, because about 80% of population lives near the coast.
The majority of houses in the city are one- and two-storey non-engineered structures. These structures are typically built of confined masonry, with reinforced-concrete (RC) frames acting as confinement for the brick masonry walls. There are three general categories of houses in Padang: permanent houses (RC), semi-permanent houses (mix of RC and wood) and traditional houses (wood). Unfortunately, no detailed damage statistics are available for each type of building, so we cannot classify the category of the house.
This earthquake also affected lifelines in Padang. The strong ground shaking destroyed public water distribution pipes leading to 2,906 reported leakage points in total
[10]. Damage to pipelines forced the cessation of water delivery to consumers for several weeks.
3. SITE CHARACTERIZATION BY
MICROTREMOR OBSERVATION
4.1 SINGLE OBSERVATIONS
A microtremor is a very small ground motion that can be recorded on the ground surface. It can be produced by avariety of excitations (e.g., wind, traffic, breaking sea waves). A full microtremor record can be described by one vertical and two horizontal components. Our analysis was conducted using the recorded microtremor. First, the horizontal and vertical spectrum ratios (HVSR) were computed for all sites (Fig. 3).HVSR (Horizontal-Vertical Spectra Ratio) is consists in estimating the ratio between the Fourier amplitude spectra of the horizontal (H) to vertical (V) components of ambient noise vibrations recorded at one single station.
The peak period of the HVSR is known to correspond to the resonant period of the site. This method postulates the shape of the Fourier spectrum [11].
Equation. (1) shows the method used to calculate HVSR using the observed records.
HVSR= FNSiω2+FFWiω2FUDiω2
(1)
where FNSi(ω) and FUDi(ω) denote the Fourier
amplitude of the NS, EW and UD components of each
interval, respectively, and ω is the frequency.
We performed 110 single site surveys that sampled every district of the city of Padang. These observations were carried out in November 2008, September, November, and December 2009 and January 2010. The locations of
3rd
International Conference on Technical and Vocation Education and Training Bukittinggi : October16-17, 2015
observations are plotted in Fig.3. Microtremor was measured using a GPL- 6A3P sensor. The two horizontal (NS and EW)and the vertical (UD) components were recorded simultaneously for 10 minutes with a 100 Hz sampling frequency.
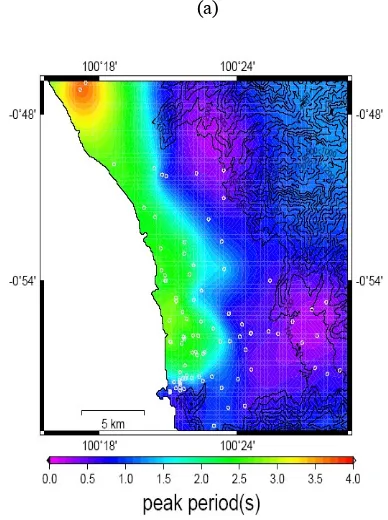
We estimated the distribution of the peak periods of the HVSRs for all sites in Padang using the ordinary kriging technique (Fig.3). From single observations, we obtained a predominant period of 2.0 to 4.0 s in the central business district and less than 1.0 s in the mountainous areas. These results indicate an affect related to the thickness of alluvium in the coastal area of Padang city, which decreases in thickness inland.
(a)
Fig. 3Observation sites and results of HVSR.(a) Microtremor
single observation sites at every district in Padang, (b) Distributed HVSR ratio.
4.2MICROTREMOR ARRAY OBSERVATIONS The velocity of surface waves is well known to vary as a function of frequency (or period) due to dispersion. Since dispersion isa function of subsurface structure, the substructure can be estimated from a Rayleigh wave dispersion curve. We carried out microtremor array investigations using 12 sites at severaldistricts in Padang(Fig.4(a)). Dispersion curves were calculated using the SPAC method [12]to obtain a velocity structure from the microtremor recordings. An outline of the procedure follows. It is necessary to simultaneously record microtremors with an instrument array of at least three stations. The dispersion of a measured surface wave is a response to the subsurface structure directly below the array, and the estimation of the subsurface structure
causing the dispersion is determined by means of inversion of Rayleigh waves. The basic principles of the SPAC method assume that the complex wave motions of microtremors are stochastic processes in time and space. A spatial autocorrelation coefficient for a circular array can then be defined when the waves composing the microtremor (i.e., the surface waves) are dispersive. Hence, the spatial autocorrelation is a function of phase velocity and frequency.
Rayleigh wave records were measured for the 12-array observation sites using the SPAC method and inversion analysis was undertaken on the observed dispersion curves to estimate the soil profiles. In the inversion analysis, the Particle Swarm Optimization (PSO) algorithm was adopted to solve the non-linear optimization problem [13]. The basic procedures of PSO are outlined below.
We estimate the subsurface structure of the model by solving a nonlinear minimizationproblem with the fitness function below.
vidt+1=ω vidt+c1r1pidt-xidt+c2r2pgdt-xgdt2
xidt+1=xidt+vidt+1
(3)
where vidt is particle velocity of the ithcomponent in
dimension d in the interaction, xidt is the particle position
of the ith component in dimension d in interaction,c1 and
c2 are constant weight factors, piis the best position
3rd
International Conference on Technical and Vocation Education and Training Bukittinggi : October16-17, 2015
achieved by particle i, pg is the best position found by the
neighbor of particle i, r1and r2 are random factors in the
[0,1] interval and ω is the inertia weight. Before
performing the inversion analysis, the subsurface structure was assumed to consist of horizontal layers of elastic and homogeneous media above a semi-infinite elastic body. The shear wave velocity and thickness of each layer are the parameters determined by the inversion analysis. The results enable us to determine the condition of shallow subsurface structures [14]. The outline of the SPAC method for the phase velocity calculation of Rayleigh waves follows.The spatial autocorrelation function is defined as
∅r,θ,ω=u0,0,ω,t*ur,θ,ω,t (4)
where ut is the average velocity of the wave in the time
domain, and the harmonic waves of frequency ω of the
microtremor have the velocity wave forms u0,0,ω,t and
ur,θ,ω,t, observed at the center of the array C(0,0) at
point Xr,θ on the array.
The spatial autocorrelation coefficient ρ is defined as the
average of the autocorrelation function in all directions over the circular array:
ρr,ω=12π∅(0,ω)02π∅r,θ,ωdθ (5)
3rd
International Conference on Technical and Vocation Education and Training Bukittinggi : October16-17, 2015
where ∅(0,w) is the SPAC function at the center C(0,0)
of the circular array. By integration of the (5) we obtain
ρr,ω=Joωrcω (6)
where Jo(x) is the zero-order Bessel function of the first
kind of x, and cω is the phase velocity at frequency ω.
The SPAC coefficient ρr,ω can be obtained in the
frequency domain using the Fourier transform of the observed microtremors.
ρr,ω=12π02πRe[SCx(ω,r,θ]SCω.SX(ω,r,θ)dθ
(7)
where Sc(ω) and Sx (ω,r,θ) are the power densities of
the microtremor at sites C and X respectively, and
SCX(ω,r,θ) is the cross spectrum between ground motions
at these two sites. Thus the SPAC coefficients may be obtained by averaging the normalized coherence function defined as the spectrum between points C and X in the
direction θ. From the SPAC coefficient ρ(r,ω), the phase
velocity is calculated for every frequency from the Bessel function argument of (6), and the velocity model can be inverted.
(a)
Altitude
3rd
International Conference on Technical and Vocation Education and Training Bukittinggi : October16-17, 2015
(b) (c) (d)
Fig.4Observation sites, soil profile anddistribution of average shearwave velocity, (a) Array observation sites, (b) layer 1 (Vs < 400m/s) and (c) layer 2 (Vs >400m/s), (d) Distribution of Vs30 (m/sec).
5 SHAKINGCHARACTERISTICS BY
QUESTIONNAIRE SURVEY
5.1 Survey Outline
Seismic intensity has been used to quantify the severity of the ground shaking based on the observed or felt effect in a limited area [7]. The method was originally developed by [15] and has been widely applied to the development of seismic macro or micro zoning maps in Japan since 1970. The method has also been applied in India and Indonesia by Honda in 2005. It has been useful for estimating seismic shaking in a limited area and for determining intensity distributions over local areas[7]. The original questionnaire sheet was written in Japanese; however, it was translated into Indonesian, for its application to Aceh. The questionnaire has 35 items that cover recognition of shaking, location, shaking duration, possibility of movement, structural damage, swinging of hanging objects, and 27 other items.
For the 2009 Padang earthquake, some sentences were modified to make it more relevant for local people while not changing the original topics covered by the questionnaire. People living near the observation points were interviewed using the questionnaire [15]. The questionnaire survey was conducted from December 24to 31,2010, three months after the main shock.The survey was carried out in all districts of Padang by distributing
and completing 500 questionnaires through a direct interview process with residents of the city. The interviewers explained each item of the questionnaire to residents, discussed the responses given, and documented the answers on the standard answer sheets.
5.2 Estimation of JMA Intensity
The calculation of the seismic intensity determined by the questionnaire is described as:
IQ=1Neinqβi(mi)
(8)
where mi is chosen by a respondent for the ith question
(e.g., i=12 and m12=12), βimiis a seismic coefficient, nq
is the number of effective questions of each questionnaire
and Ne is the number of responses from all questions. To
obtain the JMA intensity (IJMA), the result from (8) is
inserted into ( 9)[16].
IJMA=2.958 x (IQ-1.456)0.547
(9)
3rd
International Conference on Technical and Vocation Education and Training Bukittinggi : October16-17, 2015
Finally, to obtain the JMA intensity (IJMA) for each
district, the calculation for each questionnaire is averaged as follows.
IJMA=1Ni=1NIJMA(i)
(10)
where N is number of questionnaires in one location, and
IJMA(i) is the seismic intensity for each questionnaire.
The results of the questionnaire survey conducted to estimate the shaking intensity distribution in Padang during the earthquake are summarized in mapped. The results of the questionnaire survey conducted to estimate the shaking intensity distribution in Padang during the earthquake are in mapped. The seismic intensity (IJMA) for the suburbs and downtown were lower 5 (5-) and upper 5 (5+) respectively (Fig.5). A JMA seismic intensity, IJMA, value of 5- corresponds to 4.5<IJMA<5.0 and 5+ equates to 5.0<IJMA<5.5. A value of 5+ corresponds to very strong ground motion where many people are considerably frightened and find it difficult to move. Non-engineered structures sometimes collapse, wallscrack, and gravestones and stone lanterns overturn. A value of 5- corresponds to strong ground motion. Many people are frightened and feel the need to hold on to something stable. Occasionally, less earthquake-resistant buildings suffer damage to walls, and windows may break and fall. The distribution of various intensity values came from differences in the subsurface structural conditions of each district.
5.3 SHAKING CHARACTERISTICS
By comparing the results of the 500 questionnaires of the seismic intensity survey with microtremor observations (110 single-site observations and numerous other 12-site array observations), we found a correlation, in which the subsurface area or site is seen to correspond to the soft soil condition (which we here define as Vs30<400 m/s) that
exceeds the predominant period. This area corresponds to the thick alluvium in the coastal area of Padang.The
thickness of the alluvium gradually decreases in a landward direction from
the coast.
Fig.5Distributionof seismic intensity at every districts.
As a result, greater seismic intensities are observed in the coastal area and the value decreases from coastal to mountain areas. Important information from respondents’ answers were collated. The area was divided in two by considering subsurface structure condition: shear velocities Vs30<400 m/s, corresponding to soft soil (area
1), and Vs30>400 m/s, corresponding to the engineering
bedrock conditions (area 2).
The structural type, the age of building, and the number of floors in each of the two areas were found to be generally the same. However, the shaking duration was significantly different.
In area 1, 96% of respondents said that the duration of shaking was longer than 2minutes, but in area 2, only 39% of respondents felt the duration of shaking to be longer than 2 minutes. These observations support the existence of a thick alluvial layer that caused the prolonged shaking that most people living in the coastal area felt during the earthquake.
6 CONCLUSIONS
Our survey conducted in Padang consisted of (1) microtremor observations (single and 12-channel arrays) made before and after the earthquake of September 30, 2009, and (2) a questionnaire survey of 500 people in the Padang area. The central part of the city, consisting of the four districts, P. Utara, P. Barat, P. Selatan and P. Timur, experienced greater seismic intensities (5+) compared with other areas (districts) of Padang.
According to microtremor observations, downtown Padang is underlain by soft soil conditions (Vs30<400 m/s). Consistent results concerning the soil
condition were found based on predominant period observations and the questionnaire survey. In both cases, the coastal area was determined to have a soft soil conditions (Vs30<400 m/s), a longer predominant period,
and a greater seismic intensity.
Padang has a thick alluvial layer in the coastal area (with a predominant period between 2.0 and 4.2 s) that thins toward the mountains (with a predominant period less than 2.0 s). The subsurface geology also changes slowly from soft soil in the coastal area to rocky conditions in the mountains. The seismic intensity decreases from the coastal area (5+) to mountains ( 4+).
These results provide critical information for making shaking maps, updating hazard maps, and developing disaster prevention countermeasures in Padang.
7. REFERENCES
[1] Prawirodirjo, L., Y. Bock, J.F. 2000, One Century of Tectonic Deformation along the Sumatran Fault from
3rd
International Conference on Technical and Vocation Education and Training Bukittinggi : October16-17, 2015
Triangulation and Global Positioning System Surveys, J. of Geophysical research, 105, 28, 343-28,363.
[3]Natawidjaja and Wahyu Triyoso 2007. The Sumatran Fault Zone-from Source to Hazard, J. of Earthquake and Tsunami, Vol. 1 No. 1, 21-47.
[4] EERI 2009. The Mw 7.6 Western Sumatra Earthquake of September 30, 2009, Special report.
[5]BNPB 2009. Total Damage Report and Verification for West Sumatra due to Padang Earthquake, BNPB report, 2009
[6] Rusnardi, J. Kiyono, Y. Ono. 2010, Seismic Hazard Analysis for Indonesia, Proc. of International Symposium on a Robust and Resilient Society against Natural Hazards and Environmental Disasters and the third AUN/SEED-Net Regional Conference on Geodisaster Mitigation, pp.317-325.
[7] Tselentis. G-Akis and LaurentiuDanciu. 2008. Empirical Relationship between Modified Mercalli Intensity and Engineering Ground-motion Parameters in Greece, bull. Of the Seismological Society of America, vol.98, No.4, pp.1863-1875 [8] Wald, D.J., V. Quintoriano, T.H. Heaton, H. Kanamori,
C.W. Scrivner, and C.B Worden (1999). TriNet”ShakeMaps”: Rapid Generation of Peak Ground Motion and Intensity Maps for Earthquake in southern California, Earthquake Spectra 15, no. 3, 537-555.
[9]Pemerintah kota Padang.availableat at
www.Padang.go.id (Padang local government
website).
[10] Padang spring water agency, www.pdampadang.co.id
[12] Aki, K. 1957. Space and Time Spectra of Stationary Stochastic Waves, with Special Reference to Microtremor, Bull. Earth. Res. Inst., Vol. 35, No. 3, 415-456.
[13]Keneddy, J. and Eberhart, R. C. (1995), Particle Swarm Optimization, Proc. Of IEEE International conference on Neural Networks, Vol.4,pp.1942-1948. [14]Ono, Y., Kiyono, J., Rusnardi, P. R. and Noguchi, T.
2010. Microtremor Observation in Padang City, Indonesia to Estimate Site Amplification of Seismic Ground Motion, Proc. of International Symposium on a Robust and Resilient Society against Natural Hazards and Environmental Disasters and the third AUN/SEED-Net Regional Conference on
Geodisaster Mitigation, pp.386-391.
[15]Otha, Y., Goto, N., and Ohashi, H., (1979). A questionnaire Survey for Estimating Seismic Intensity, full. Fac. Eng., Hokkaido University 92, 241-252 [in Japanese]
[16] Fallahi. A, P. Teymourzadeh, M. Miyajima, T. Tobita and R. Alaghebandian (2008). Statistical Study to Determine JMA Earthquake Intensity by
Questionnaire Survey in 2003 Bam (Iran) Earthquake, The 14th
World conference on earthquake engineering, October 12-17, Beijing, China.