LAMPIRAN A-UJI VALIDITAS
R E L I A B I L I T Y A N A L Y S I S - S C A L E (A L P H A) Independensi
Item-total Statistics
Scale Scale Corrected
Mean Variance Item- Squared Alpha if Item if Item Total Multiple if Item Deleted Deleted Correlation Correlation Deleted
IND_1 104,4375 96,5992 ,5584 ,7622 ,7355
IND_2 104,4219 96,3430 ,6147 ,7638 ,7333
IND_3 105,1719 96,9382 ,2196 ,4273 ,7659
IND_4 104,4219 103,1367 ,3894 ,3807 ,7500
IND_5 104,6406 98,1069 ,3932 ,6398 ,7449
IND_6 104,3750 99,1905 ,5809 ,7906 ,7393
IND_7 105,1719 90,9700 ,3669 ,5092 ,7498
IND_8 105,3750 88,3333 ,4607 ,7361 ,7378
IND_9 105,1719 95,9224 ,2999 ,7129 ,7543
IND_10 104,5781 101,3906 ,3375 ,2982 ,7498
IND_11 104,8594 93,1386 ,4755 ,6042 ,7365
IND_12 104,4063 102,5942 ,2849 ,5160 ,7530
IND_13 104,1563 105,2768 ,3241 ,8218 ,7544
IND_14 104,3438 103,5942 ,2714 ,7353 ,7541
IND_15 104,2188 105,1577 ,3208 ,7619 ,7543
IND_16 104,6406 103,3767 ,2804 ,5161 ,7536
IND_17 105,4219 99,1049 ,1479 ,3493 ,7754
IND_18 104,7969 96,3232 ,4755 ,5550 ,7388
Reliability Coefficients 18 items
R E L I A B I L I T Y A N A L Y S I S - S C A L E (A L P H A) Penghargaan
Item-total Statistics
Scale Scale Corrected
Mean Variance Item- Squared Alpha if Item if Item Total Multiple if Item Deleted Deleted Correlation Correlation Deleted
PHG_1 56,2656 44,2617 ,5840 ,4821 ,6913
PHG_2 56,1563 48,7054 ,3597 ,3730 ,7208
PHG_3 56,3750 42,7143 ,5676 ,6291 ,6888
PHG_4 56,3125 46,2183 ,3420 ,4101 ,7225
PHG_5 55,9063 50,4673 ,3030 ,2430 ,7276
PHG_6 56,0781 48,8986 ,3364 ,3385 ,7231
PHG_7 56,4688 47,3641 ,2799 ,2671 ,7314
PHG_8 57,0313 42,5069 ,3950 ,4280 ,7183
PHG_9 57,0313 43,8403 ,3539 ,3761 ,7246
PHG_10 56,3906 44,1783 ,4521 ,2806 ,7061
PHG_11 56,1406 48,7259 ,3222 ,2740 ,7243
Reliability Coefficients 11 items
R E L I A B I L I T Y A N A L Y S I S - S C A L E (A L P H A) fasilitas
Item-total Statistics
Scale Scale Corrected
Mean Variance Item- Squared Alpha if Item if Item Total Multiple if Item Deleted Deleted Correlation Correlation Deleted
FAS_1 12,3125 33,1071 ,2966 ,3203 ,7218
FAS_2 12,5156 32,0950 ,4938 ,3416 ,6629
FAS_3 11,7344 26,2299 ,6183 ,5893 ,6117
FAS_4 12,8438 33,3720 ,3895 ,2755 ,6905
FAS_5 12,1719 27,0970 ,5557 ,6185 ,6361
FAS_6 12,9531 35,4740 ,3455 ,2498 ,7019 _
Reliability Coefficients 6 items
LAMPIRAN B-UJI RELIABILITAS
R E L I A B I L I T Y A N A L Y S I S - S C A L E (A L P H A) Independensi
Item-total Statistics
Scale Scale Corrected
Mean Variance Item- Squared Alpha if Item if Item Total Multiple if Item Deleted Deleted Correlation Correlation Deleted
IND_1 99,0000 86,5397 ,5962 ,7563 ,7499
IND_2 98,9844 86,7140 ,6309 ,7581 ,7490
IND_3 99,7344 87,9442 ,2045 ,4223 ,7873
IND_4 98,9844 93,8251 ,3611 ,3463 ,7676
IND_5 99,2031 87,6248 ,4400 ,6132 ,7587
IND_6 98,9375 89,0119 ,6292 ,7891 ,7534
IND_7 99,7344 81,7537 ,3671 ,5006 ,7699
IND_8 99,9375 79,5833 ,4512 ,7203 ,7589
IND_9 99,7344 86,1347 ,3118 ,6867 ,7720
IND_10 99,1406 91,2656 ,3657 ,2981 ,7650
IND_11 99,4219 84,0255 ,4705 ,5639 ,7550
IND_12 98,9688 93,7768 ,2376 ,4294 ,7726
IND_13 98,7188 95,3165 ,3427 ,8213 ,7701
IND_14 98,9063 93,7371 ,2803 ,7239 ,7703
IND_15 98,7813 95,2530 ,3339 ,7619 ,7702
IND_16 99,2031 93,3073 ,3030 ,5118 ,7691
IND_18 99,3594 87,5355 ,4478 ,5501 ,7581
Reliability Coefficients 17 items
R E L I A B I L I T Y A N A L Y S I S - S C A L E (A L P H A) Penghargaan
Item-total Statistics
Scale Scale Corrected
Mean Variance Item- Squared Alpha if Item if Item Total Multiple if Item Deleted Deleted Correlation Correlation Deleted
PHG_1 56,2656 44,2617 ,5840 ,4821 ,6913
PHG_2 56,1563 48,7054 ,3597 ,3730 ,7208
PHG_3 56,3750 42,7143 ,5676 ,6291 ,6888
PHG_4 56,3125 46,2183 ,3420 ,4101 ,7225
PHG_5 55,9063 50,4673 ,3030 ,2430 ,7276
PHG_6 56,0781 48,8986 ,3364 ,3385 ,7231
PHG_7 56,4688 47,3641 ,2799 ,2671 ,7314
PHG_8 57,0313 42,5069 ,3950 ,4280 ,7183
PHG_9 57,0313 43,8403 ,3539 ,3761 ,7246
PHG_10 56,3906 44,1783 ,4521 ,2806 ,7061
PHG_11 56,1406 48,7259 ,3222 ,2740 ,7243
Reliability Coefficients 11 items
R E L I A B I L I T Y A N A L Y S I S - S C A L E (A L P H A) fasilitas
Item-total Statistics
Scale Scale Corrected
Mean Variance Item- Squared Alpha if Item if Item Total Multiple if Item Deleted Deleted Correlation Correlation Deleted
FAS_1 12,3125 33,1071 ,2966 ,3203 ,7218
FAS_2 12,5156 32,0950 ,4938 ,3416 ,6629
FAS_3 11,7344 26,2299 ,6183 ,5893 ,6117
FAS_4 12,8438 33,3720 ,3895 ,2755 ,6905
FAS_5 12,1719 27,0970 ,5557 ,6185 ,6361
FAS_6 12,9531 35,4740 ,3455 ,2498 ,7019 _
Reliability Coefficients 6 items
T ABEL FREK U EN SI
Frequencies
Penghargaan
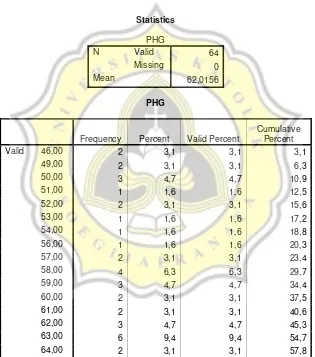
Statistics
PHG
N Valid 64 Missing 0 Mean 62,0156
PHG
Frequency Percent Valid Percent
Cumulative Percent
Valid 46,00 2 3,1 3,1 3,1
49,00 2 3,1 3,1 6,3
50,00 3 4,7 4,7 10,9
51,00 1 1,6 1,6 12,5
52,00 2 3,1 3,1 15,6
53,00 1 1,6 1,6 17,2
54,00 1 1,6 1,6 18,8
56,00 1 1,6 1,6 20,3
57,00 2 3,1 3,1 23,4
58,00 4 6,3 6,3 29,7
59,00 3 4,7 4,7 34,4
60,00 2 3,1 3,1 37,5
61,00 2 3,1 3,1 40,6
62,00 3 4,7 4,7 45,3
63,00 6 9,4 9,4 54,7
65,00 7 10,9 10,9 68,8
66,00 1 1,6 1,6 70,3
67,00 2 3,1 3,1 73,4
68,00 4 6,3 6,3 79,7
69,00 5 7,8 7,8 87,5
70,00 1 1,6 1,6 89,1
71,00 2 3,1 3,1 92,2
72,00 1 1,6 1,6 93,8
73,00 2 3,1 3,1 96,9
75,00 1 1,6 1,6 98,4
77,00 1 1,6 1,6 100,0
Total 64 100,0 100,0
Frequencies
Fa silit a s
Statistics
FAS
N Valid 64 Missing 0 Mean 14,9063
FAS
Frequency Percent Valid Percent
Cumulative Percent
Valid 6,00 5 7,8 7,8 7,8
8,00 7 10,9 10,9 18,8
9,00 4 6,3 6,3 25,0
11,00 2 3,1 3,1 32,8
12,00 8 12,5 12,5 45,3
13,00 4 6,3 6,3 51,6
14,00 5 7,8 7,8 59,4
15,00 2 3,1 3,1 62,5
17,00 1 1,6 1,6 64,1
18,00 3 4,7 4,7 68,8
19,00 2 3,1 3,1 71,9
20,00 4 6,3 6,3 78,1
21,00 3 4,7 4,7 82,8
22,00 3 4,7 4,7 87,5
23,00 1 1,6 1,6 89,1
24,00 2 3,1 3,1 92,2
26,00 1 1,6 1,6 93,8
28,00 2 3,1 3,1 96,9
29,00 1 1,6 1,6 98,4
32,00 1 1,6 1,6 100,0
Frequencies
Independensi
Statistics
IND
N Valid 64 Missing 0 Mean 105,4219
IND
Frequency Percent Valid Percent
Cumulative Percent
Valid 76,00 1 1,6 1,6 1,6
80,00 1 1,6 1,6 3,1
84,00 1 1,6 1,6 4,7
89,00 1 1,6 1,6 6,3
91,00 3 4,7 4,7 10,9
95,00 3 4,7 4,7 15,6
96,00 1 1,6 1,6 17,2
97,00 2 3,1 3,1 20,3
99,00 3 4,7 4,7 25,0
100,00 2 3,1 3,1 28,1
101,00 1 1,6 1,6 29,7
102,00 4 6,3 6,3 35,9
103,00 2 3,1 3,1 39,1
104,00 1 1,6 1,6 40,6
105,00 2 3,1 3,1 43,8
106,00 3 4,7 4,7 48,4
108,00 4 6,3 6,3 64,1
110,00 2 3,1 3,1 67,2
111,00 4 6,3 6,3 73,4
112,00 2 3,1 3,1 76,6
113,00 1 1,6 1,6 78,1
116,00 2 3,1 3,1 81,3
117,00 3 4,7 4,7 85,9
118,00 3 4,7 4,7 90,6
119,00 6 9,4 9,4 100,0
Explore
2 Mean 14,2400 ,93528 95%
Confidence Interval for
Mean
Lower Bound 12,3605 Upper Bound
16,1195
5% Trimmed Mean 13,8222 Median 12,0000 Variance 43,737 Std. Deviation 6,61341
Minimum 6,00 Maximum 32,00
Range 26,00 Interquartile Range 10,2500
Fasilitas
Valid Missing Total
2 Mean 103,8200 1,40544
Maximum 119,00
Range 43,00
Interquartile Range 12,5000
Skewness -,613 ,337
Kurtosis ,475 ,662
Independensi
USIA
Case Processing Summary
USIA
Cases
Valid Missing Total
N Percent N Percent N Percent
IND 1 15 100,0% 0 ,0% 15 100,0%
3 8 100,0% 0 ,0% 8 100,0%
2 Mean 104,7317 1,66126
Kurtosis ,480 ,724
3 Mean 104,8750 4,07710
PEND Statistic Std. Error
2 Mean 104,5294 1,61722
95%
3 Mean 105,1304 2,31707
Confidence Interval for Mean
Upper Bound
109,9357
5% Trimmed Mean 105,8841
Median 105,0000
Variance 123,482
Std. Deviation 11,11226
Minimum 76,00
Maximum 119,00
Range 43,00
Interquartile Range 17,0000
Skewness -,698 ,481
Kurtosis ,585 ,935
Explore
Penghargaan
JKL(jenis kelamin)
Case Processing Summary
JKL
Cases
Valid Missing Total
N Percent N Percent N Percent
PHG 1 14 100,0% 0 ,0% 14 100,0%
2 50 100,0% 0 ,0% 50 100,0%
Descriptives
Penghargaan
USIA
Case Processing Summary
USIA
Cases
Valid Missing Total
N Percent N Percent N Percent
PHG 1 15 100,0% 0 ,0% 15 100,0%
2 41 100,0% 0 ,0% 41 100,0%
3 8 100,0% 0 ,0% 8 100,0%
Descriptives
USIA Statistic Std. Error
PHG 1 Mean 63,6667 1,49815
95% Confidence Interval for Mean
Lower Bound 60,4535 Upper Bound
PHG(a)
a All requested variables entered.
b Dependent Variable: ABSUT
Model Summary
a Predictors: (Constant), FAS, PHG
ANOVA(b)
Coefficients(a)
Model
Unstandardized
Coefficients
Standardize
d
Coefficients
t
Sig.
B
Std.
Error
Beta
1
(Consta
nt)
1,634
6,652
,246
,807
PHG
,088
,104
,107
,838
,405
FAS
,049
,118
,053
,416
,679
a Dependent Variable: ABSUT
UJI MULTIKOLINIERITAS
Regression
Variables Entered/Removed(b)
Model
Variables Entered
Variables
Removed Method
1 FAS,
PHG(a) . Enter a All requested variables entered.
Model Summary a Predictors: (Constant), FAS, PHG
ANOVA(b)
a Predictors: (Constant), FAS, PHG b Dependent Variable: IND
Model Summary
) 105,803 10,983 9,633 ,000
PHG ,024 ,173 ,018 ,139 ,890
FAS -,125 ,195 -,082 -,643 ,523