7.1.
Kurva Standar
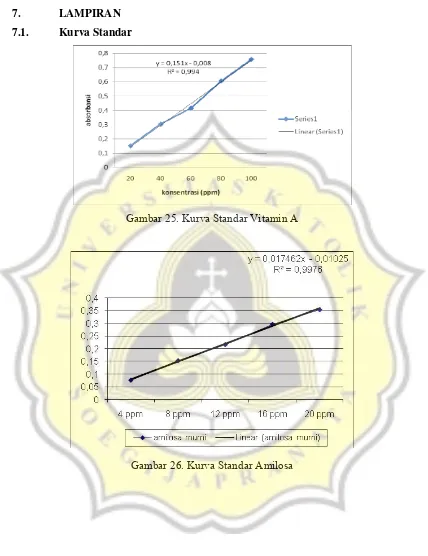
Gambar 25. Kurva Standar Vitamin A
Standart Mutu Bihun Instan Menurut SNI 01-3742-1995
No Uraian
Satuan Persyaratan
1.
2.
3.
4.
5.
6.
7.
8.
9.
10.
11.
12.
Keadaan :
1.1.
bau
1.2.
rasa
1.3.
warna
Benda-benda asing
Keutuhan,%,b/b
Uji Kematangan
(bihun : air = 1:5) b/b
Air,%, b/b
Abu tanpa garam,%, b/b
Protein (Nx6.25), %, b/b
Derajat asam, mg KOH/100g
contoh
Bahan tambahan makanan
Cemaran Logam :
10.1. Timbal (Pb), mg/kg
10.2. Tembaga (Cu), mg/kg
10.3. Seng (Zn), mg/kg
10.4 Raksa (Hg), mg/kg
Arsen (As), mg/kg
Cemaran Mikroba:
12.1. Angka lempeng Total
12.2. E. Coli
12.3. Kapang
Menit
Koloni/g
APM/g
Koloni/g
Normal
Normal
Normal
Tidak boleh ada
Min. 90
Maks. 3
Maks.11
Maks. 2
Min. 6
Maks. 3
Sesuai SNI. 0222-M dan peraturan
Men.Kes.No.722/Menkes/Per/IX/88
Maks. 1.0
Maks. 10.0
Maks. 40.0
Maks. 0.05
Maks. 0.5
Maks. 1.0 x 10
6<3
Maks. 1.0 x 10
4Nama
:
Tanggal
Sampel :
kwetiau
Atribut :
Dihadapan Anda terdapat 8 sampel kwetiau. Amatilah sampel berurutan dari kiri ke
kanan. Setelah mengamati sampel pertama, Anda boleh mengulang sesering yang
Anda perlukan. Berilah skor pada kode sampel pertama (diperbolehkan memberi
skor yang sama) dan jangan membandingkan antar sampel.
Kode sampel
Score
Keterangan :
9 = sungguh sangat dapat diterima sekali 4 = tidak dapat diterima 8 = sangat dapat diterima sekali 3 = sangat tidak dapat diterima
7 = sangat dapat diterima 2 = sangat tidak dapat diterima sekali
6 = dapat diterima 1 = sungguh sangat tidak dapat diterima sekali
5 = netral
Komentar
...
...
...
Tests of Normality
,183 6 ,200* ,915 6 ,468
,184 6 ,200* ,964 6 ,853
,268 6 ,200* ,882 6 ,280
,184 6 ,200* ,968 6 ,876
,213 6 ,200* ,960 6 ,820
,171 6 ,200* ,928 6 ,563
,279 6 ,158 ,852 6 ,163
KH k_air abu protein lemak serat_kasar vit_A
Statistic df Sig. Statistic df Sig.
Kolmogorov-Smirnova Shapiro-Wilk
This is a lower bound of the true significance. *.
Lilliefors Significance Correction a.
UJI NORMALITAS KIMIA KWETIAU UBI JALAR UNGU
Tests of Normality
,157 6 ,200* ,986 6 ,978
,167 6 ,200* ,926 6 ,551
,159 6 ,200* ,985 6 ,974
,244 6 ,200* ,879 6 ,266
,228 6 ,200* ,919 6 ,500
,306 6 ,082 ,770 6 ,031
,200 6 ,200* ,941 6 ,669
,224 6 ,200* ,912 6 ,453
konsentrasi 0% ubi dehum 80% ubi dehum 90% ubi dehum 100% ubi dehum 0% ubi std 80% ubi std 90% ubi std 100% ubi std kadar_air
Statistic df Sig. Statistic df Sig.
Kolmogorov-Smirnova Shapiro-Wilk
This is a lower bound of the true significance. *.
Lilliefors Significance Correction a.
Tests of Normality
,265 6 ,200* ,828 6 ,104
,187 6 ,200* ,897 6 ,356
,246 6 ,200* ,912 6 ,450
,188 6 ,200* ,935 6 ,618
,221 6 ,200* ,894 6 ,342
,318 6 ,058 ,824 6 ,096
,295 6 ,111 ,760 6 ,025
,194 6 ,200* ,918 6 ,494
konsentrasi 0% ubi dehum 80% ubi dehum 90% ubi dehum 100% ubi dehum 0% ubi std 80% ubi std 90% ubi std 100% ubi std k_abu
Statistic df Sig. Statistic df Sig.
Kolmogorov-Smirnova Shapiro-Wilk
This is a lower bound of the true significance. *.
,285 6 ,139 ,829 6 ,104
,162 6 ,200* ,975 6 ,923
,211 6 ,200* ,924 6 ,532
,178 6 ,200* ,971 6 ,902
,189 6 ,200* ,920 6 ,508
,181 6 ,200* ,922 6 ,519
,272 6 ,187 ,849 6 ,156
,227 6 ,200* ,897 6 ,357
konsentrasi 0% ubi dehum 80% ubi dehum 90% ubi dehum 100% ubi dehum 0% ubi std 80% ubi std 90% ubi std 100% ubi std protein
Statistic df Sig. Statistic df Sig.
Kolmogorov-Smirnova Shapiro-Wilk
This is a lower bound of the true significance. *.
Lilliefors Significance Correction a.
Tests of Normality
,216 6 ,200* ,949 6 ,735
,265 6 ,200* ,846 6 ,146
,216 6 ,200* ,954 6 ,770
,260 6 ,200* ,895 6 ,346
,277 6 ,169 ,884 6 ,287
,224 6 ,200* ,908 6 ,420
,295 6 ,113 ,823 6 ,093
,145 6 ,200* ,987 6 ,979
konsentrasi 0% ubi dehum 80% ubi dehum 90% ubi dehum 100% ubi dehum 0% ubi std 80% ubi std 90% ubi std 100% ubi std lemak
Statistic df Sig. Statistic df Sig.
Kolmogorov-Smirnova Shapiro-Wilk
This is a lower bound of the true significance. *.
Lilliefors Significance Correction a.
Tests of Normality
,245 6 ,200* ,930 6 ,582
,162 6 ,200* ,987 6 ,981
,316 6 ,062 ,797 6 ,055
,275 6 ,174 ,930 6 ,579
,180 6 ,200* ,922 6 ,522
,218 6 ,200* ,966 6 ,868
,276 6 ,170 ,878 6 ,258
,244 6 ,200* ,862 6 ,195
konsentrasi 0% ubi dehum 80% ubi dehum 90% ubi dehum 100% ubi dehum 0% ubi std 80% ubi std 90% ubi std 100% ubi std serat
Statistic df Sig. Statistic df Sig.
Kolmogorov-Smirnova Shapiro-Wilk
This is a lower bound of the true significance. *.
,227 6 ,200* ,933 6 ,600
,175 6 ,200* ,954 6 ,771
,279 6 ,158 ,798 6 ,057
,172 6 ,200* ,973 6 ,915
,230 6 ,200* ,904 6 ,396
,241 6 ,200* ,905 6 ,406
,217 6 ,200* ,888 6 ,307
,236 6 ,200* ,911 6 ,441
konsentrasi 0% ubi dehum 80% ubi dehum 90% ubi dehum 100% ubi dehum 0% ubi std 80% ubi std 90% ubi std 100% ubi std karbo_bydiff
Statistic df Sig. Statistic df Sig.
This is a lower bound of the true significance. *.
Lilliefors Significance Correction a.
Tests of Normality
,176 6 ,200* ,947 6 ,714
,149 6 ,200* ,960 6 ,822
,317 6 ,060 ,804 6 ,063
,208 6 ,200* ,948 6 ,725
,136 6 ,200* ,958 6 ,807
,227 6 ,200* ,849 6 ,156
,174 6 ,200* ,954 6 ,772
,227 6 ,200* ,887 6 ,301
konsentrasi 0% ubi dehum 80% ubi dehum 90% ubi dehum 100% ubi dehum 0% ubi std 80% ubi std 90% ubi std 100% ubi std vitaminA_si
Statistic df Sig. Statistic df Sig.
Kolmogorov-Smirnova Shapiro-Wilk
This is a lower bound of the true significance. *.
Tests of Normality
,189 6 ,200* ,903 6 ,389
,212 6 ,200* ,876 6 ,249
,221 6 ,200* ,954 6 ,769
,163 6 ,200* ,955 6 ,777
,221 6 ,200* ,916 6 ,475
,197 6 ,200* ,973 6 ,911
,209 6 ,200* ,920 6 ,505
,178 6 ,200* ,954 6 ,772
konsentrasi 0% ubi dehum 80% ubi dehum 90% ubi dehum 100% ubi dehum 0% ubi std 80% ubi std 90% ubi std 100% ubi std kelentingan
Statistic df Sig. Statistic df Sig.
Kolmogorov-Smirnova Shapiro-Wilk
This is a lower bound of the true significance. *.
Lilliefors Significance Correction a.
Tests of Normality
,164 6 ,200* ,984 6 ,971
,252 6 ,200* ,917 6 ,482
,195 6 ,200* ,920 6 ,506
,324 6 ,048 ,840 6 ,130
,153 6 ,200* ,987 6 ,980
,197 6 ,200* ,934 6 ,615
,132 6 ,200* ,979 6 ,945
,149 6 ,200* ,952 6 ,754
konsentrasi 0% ubi dehum 80% ubi dehum 90% ui dehum 100% ubi dehum 0% ubi std 80% ubi std 90% ubi std 100% ubi std kekenyalan
Statistic df Sig. Statistic df Sig.
Kolmogorov-Smirnova Shapiro-Wilk
This is a lower bound of the true significance. *.
PENGUJIAN KIMIA
TWO WAY ANOVA COMPLETELY RANDOMIZED
Variable: KADAR AIR
Source SS df MS F P
---
Main Effects
kons 11.27848722 3 3.7594957402 20.808149089 .0000 ***
pgrg 1.5688746353 1 1.5688746353 8.6834457519 .0053 **
Interaction
kons x pgrg 9.4961649424 3 3.1653883141 17.519868759 .0000 ***
Error 7.226968096 40 0.1806742024
---
Total 29.570494894 47
Duncan's Multiple Range Test
Factor: kons
Error mean square = 0.1806742024
Degrees of freedom = 40
Significance level = 5%
LSD .05 = 0.3507155014
Rank Trt# Mean n Non-significant ranges
---
1 4 10.381387608 12 a
2 3 9.9656124886 12 b
3 2 9.8014531302 12 b
4 1 9.042071758 12 c
Duncan's Multiple Range Test
Factor: pgrg
Error mean square = 0.1806742024
Degrees of freedom = 40
Significance level = 5%
LSD .05 = 0.2479933093
Rank Trt# Mean n Non-significant ranges
---
1 2 (STD) 9.9784208705 24 a
TWO WAY ANOVA COMPLETELY RANDOMIZED
Variable: Abu
Source SS df MS F P
---
Main Effects
kons 10.812686682 3 3.6042288939 799.93914503 .0000 ***
pgrg 0.2189599496 1 0.2189599496 48.596978718 .0000 ***
Interaction
kons x pgrg 0.3122246613 3 0.1040748871 23.098859325 .0000 ***
Error 0.1802251542 40 0.0045056289
---
Total 11.524096447 47
Duncan's Multiple Range Test
Factor: kons
Error mean square = 0.0045056289
Degrees of freedom = 40
Significance level = 5%
LSD .05 = 0.0553840354
Rank Trt# Mean n Non-significant ranges
---
1 4 1.80944955 12 a
2 3 1.3755529046 12 b
3 2 0.9304836661 12 c
4 1 0.5433796286 12 d
Duncan's Multiple Range Test
Factor: pgrg
Error mean square = 0.0045056289
Degrees of freedom = 40
Significance level = 5%
LSD .05 = 0.039162427
Rank Trt# Mean n Non-significant ranges
---
1 1 1.2322565411 24 a
TWO WAY ANOVA COMPLETELY RANDOMIZED
Variable: PROTEIN
Source SS df MS F P
---
Main Effects
kons 89.2801595 3 29.760053167 151.49380879 .0000 ***
pgrg 21.573845595 1 21.573845595 109.82184814 .0000 ***
Interaction
kons x pgrg 2.7769918512 3 0.9256639504 4.7121003689 .0066 **
Error 7.8577608959 40 0.1964440224
---
Total 121.48875784 47
Duncan's Multiple Range Test
Factor: kons
Error mean square = 0.1964440224
Degrees of freedom = 40
Significance level = 5%
LSD .05 = 0.3657011262
Rank Trt# Mean n Non-significant ranges
---
1 1 6.9774110187 12 a
2 2 6.0845060458 12 b
3 3 4.8636469578 12 c
4 4 3.3450832215 12 d
Duncan's Multiple Range Test
Factor: pgrg
Error mean square = 0.1964440224
Degrees of freedom = 40
Significance level = 5%
LSD .05 = 0.2585897462
Rank Trt# Mean n Non-significant ranges
---
1 1 5.988075949 24 a
TWO WAY ANOVA COMPLETELY RANDOMIZED
Variable: LEMAK
Source SS df MS F P
---
Main Effects
kons 26.355182768 3 8.7850609226 45.822194322 .0000 ***
pgrg 0.4916640503 1 0.4916640503 2.5644814365 .1172 ns
Interaction
kons x pgrg 0.2093197635 3 0.0697732545 0.3639318674 .7794 ns
Error 7.6688260373 40 0.1917206509
---
Total 34.724992619 47
Duncan's Multiple Range Test
Factor: kons
Error mean square = 0.1917206509
Degrees of freedom = 40
Significance level = 5%
LSD .05 = 0.3612778503
Rank Trt# Mean n Non-significant ranges
---
1 4 6.0185103163 12 a
2 3 4.8608143931 12 b
3 2 4.5395978592 12 b
4 1 3.9930180424 12 c
Duncan's Multiple Range Test
Factor: pgrg
Error mean square = 0.1917206509
Degrees of freedom = 40
Significance level = 5%
LSD .05 = 0.2554620179
Rank Trt# Mean n Non-significant ranges
---
1 1 4.9541928651 24 a
TWO WAY ANOVA COMPLETELY RANDOMIZED
Variable: SERAT KASAR
Source SS df MS F P
---
Main Effects
kons 173.66568824 3 57.888562745 490.14342297 .0000 ***
pgrg 3.7495868456 1 3.7495868456 31.747814146 .0000 ***
Interaction
kons x pgrg 6.6892268953 3 2.2297422984 18.879265103 .0000 ***
Error 4.7242141816 40 0.1181053545
---
Total 188.82871616 47
Duncan's Multiple Range Test
Factor: kons
Error mean square = 0.1181053545
Degrees of freedom = 40
Significance level = 5%
LSD .05 = 0.2835578551
Rank Trt# Mean n Non-significant ranges
---
1 4 5.9404484741 12 a
2 3 4.2543213097 12 b
3 2 2.7367625148 12 c
4 1 0.782413462 12 d
Duncan's Multiple Range Test
Factor: pgrg
Error mean square = 0.1181053545
Degrees of freedom = 40
Significance level = 5%
LSD .05 = 0.2005056822
Rank Trt# Mean n Non-significant ranges
---
1 2 3.7079795395 24 a
TWO WAY ANOVA COMPLETELY RANDOMIZED
Variable: VITAMIN A
Source SS df MS F P
---
Main Effects
kons 387868250.16 3 129289416.72 821.01127897 .0000 ***
pgrg 1227897.0096 1 1227897.0096 7.7973690334 .0080 **
Interaction
kons x pgrg 1370840.8281 3 456946.9427 2.9016960813 .0466 *
Error 6299032.4265 40 157475.81066
---
Total 396766020.42 47
Duncan's Multiple Range Test
Factor: kons
Error mean square = 157475.81066
Degrees of freedom = 40
Significance level = 5%
LSD .05 = 327.42649193
Rank Trt# Mean n Non-significant ranges
---
1 4 7242.9683868 12 a
2 3 6806.5226993 12 b
3 2 5515.902411 12 c
4 1 122.90486951 12 d
Duncan's Multiple Range Test
Factor: pgrg
Error mean square = 157475.81066
Degrees of freedom = 40
Significance level = 5%
LSD .05 = 231.52549278
Rank Trt# Mean n Non-significant ranges
---
1 1 5082.0157924 24 a
TWO WAY ANOVA COMPLETELY RANDOMIZED
Variable: KH
by different
Source SS df MS F P
---
Main Effects
kons 6.6804797322 3 2.2268265774 3.5497003152 .0227 *
pgrg 16.612020382 1 16.612020382 26.480595563 .0000 ***
Interaction
kons x pgrg 12.384683526 3 4.128227842 6.580652405 .0010 **
Error 25.093122007 40 0.6273280502
---
Total 60.770305646 47
Duncan's Multiple Range Test
Factor: kons
Error mean square = 0.6273280502
Degrees of freedom = 40
Significance level = 5%
LSD .05 = 0.6535130165
Rank Trt# Mean n Non-significant ranges
---
1 1 79.669522621 12 a
2 4 79.149964376 12 ab
3 3 79.133663076 12 ab
4 2 78.614464569 12 b
Duncan's Multiple Range Test
Factor: pgrg
Error mean square = 0.6273280502
Degrees of freedom = 40
Significance level = 5%
LSD .05 = 0.4621034856
Rank Trt# Mean n Non-significant ranges
---
1 2 79.7301925 24 a
PENGUJIAN FISIK
TWO WAY ANOVA COMPLETELY RANDOMIZED
Variable: KELENTINGAN
Source SS df MS F P
---
Main Effects
kons 3.1934619658 3 1.0644873219 69.051646743 .0000 ***
pgrg 1.18428E-06 1 1.18428E-06 7.682241E-05 .9931 ns
Interaction
kons x pgrg 0.0277025752 3 0.0092341917 0.5990077402 .6194 ns
Error 0.616632548 40 0.0154158137
---
Total 3.8377982733 47
Duncan's Multiple Range Test
Factor: kons
Error mean square = 0.0154158137
Degrees of freedom = 40
Significance level = 5%
LSD .05 = 0.1024448463
Rank Trt# Mean n Non-significant ranges
---
1 1 1.5546184622 12 a
2 2 1.4560095934 12 a
3 3 1.3513890035 12 b
4 4 0.8819162987 12 c
Duncan's Multiple Range Test
Factor: pgrg
Error mean square = 0.0154158137
Degrees of freedom = 40
Significance level = 5%
LSD .05 = 0.0724394455
Rank Trt# Mean n Non-significant ranges
---
1 1 1.3111404143 24 a
TWO WAY ANOVA COMPLETELY RANDOMIZED
Variable: KEKENYALAN
Source SS df MS F P
---
Main Effects
kons 0.0737652397 3 0.0245884132 786.64328729 .0000 ***
pgrg 7.29432E-06 1 7.29432E-06 0.2333630687 .6317 ns
Interaction
kons x pgrg 1.501337E-04 3 5.004457E-05 1.6010478862 .2043 ns
Error 0.0012502955 40 3.125739E-05
---
Total 0.0751729632 47
Duncan's Multiple Range Test
Factor: kons
Error mean square = 3.125739E-05
Degrees of freedom = 40
Significance level = 5%
LSD .05 = 0.0046129975
Rank Trt# Mean n Non-significant ranges
---
1 1 0.1157297756 12 a
2 2 0.0570521578 12 b
3 3 0.0325827683 12 c
4 4 0.0107735103 12 d
Duncan's Multiple Range Test
Factor: pgrg
Error mean square = 3.125739E-05
Degrees of freedom = 40
Significance level = 5%
LSD .05 = 0.0032618818
Rank Trt# Mean n Non-significant ranges
---
1 1 0.0544243799 24 a
Test Statisticsa,b
19,393 13,680 5,873 57,596 82,861 23,693
7 7 7 7 7 7
,007 ,057 ,555 ,000 ,000 ,001
Chi-Square df
Asymp. Sig.
warna aroma tekstur rasa ints_rasa overall
Kruskal Wallis Test a.
Grouping Variable: perlakuan b.
UJI BEDA NYATA PARAMETER WARNA
Ranks
50 52,08 2604,00
50 48,92 2446,00
100 konsentrasi
0% t.ubi CD 80% t ubi CD Total warna
N Mean Rank Sum of Ranks
Test Statisticsa
1171,000 2446,000 -,559 ,576 Mann-Whitney U
Wilcoxon W Z
Asymp. Sig. (2-tailed)
warna
Grouping Variable: konsentrasi a.
Ranks
50 54,95 2747,50
50 46,05 2302,50
100 konsentrasi
0% t.ubi CD 90% t.ubi CD Total warna
N Mean Rank Sum of Ranks
Test Statisticsa
1027,500 2302,500 -1,583 ,114 Mann-Whitney U
Wilcoxon W Z
Asymp. Sig. (2-tailed)
warna
50 56,50 2825,00
50 44,50 2225,00
100 0% t.ubi CD
100% t.ubi CD Total
warna
Test Statisticsa
950,000 2225,000 -2,138 ,033 Mann-Whitney U
Wilcoxon W Z
Asymp. Sig. (2-tailed)
warna
Grouping Variable: konsentrasi a.
Ranks
50 49,96 2498,00
50 51,04 2552,00
100 konsentrasi
0% t.ubi CD 0% t.ubi STD Total warna
N Mean Rank Sum of Ranks
Test Statisticsa
1223,000 2498,000 -,191 ,848 Mann-Whitney U
Wilcoxon W Z
Asymp. Sig. (2-tailed)
warna
Grouping Variable: konsentrasi a.
Ranks
50 59,32 2966,00
50 41,68 2084,00
100 konsentrasi
0% t.ubi STD 80% t.ubi STD Total
warna
809,000 2084,000 -3,122 ,002 Mann-Whitney U
Wilcoxon W Z
Asymp. Sig. (2-tailed)
warna
Grouping Variable: konsentrasi a.
Ranks
50 57,00 2850,00
50 44,00 2200,00
100 konsentrasi
0% t.ubi STD 90% t.ubi STD Total
warna
N Mean Rank Sum of Ranks
Test Statisticsa
925,000 2200,000 -2,310 ,021 Mann-Whitney U
Wilcoxon W Z
Asymp. Sig. (2-tailed)
warna
Grouping Variable: konsentrasi a.
Ranks
50 57,02 2851,00
50 43,98 2199,00
100 konsentrasi
0% t.ubi STD 100% STD Total warna
N Mean Rank Sum of Ranks
Test Statisticsa
924,000 2199,000 -2,320 ,020 Mann-Whitney U
Wilcoxon W Z
Asymp. Sig. (2-tailed)
warna
Grouping Variable: konsentrasi a.
Ranks
50 47,60 2380,00
50 53,40 2670,00
100 konsentrasi
80% t.ubi STD 90% t.ubi STD Total
warna
1105,000 2380,000 -1,036 ,300 Mann-Whitney U
Wilcoxon W Z
Asymp. Sig. (2-tailed)
warna
Grouping Variable: konsentrasi a.
Ranks
50 48,55 2427,50
50 52,45 2622,50
100 konsentrasi
80% t.ubi STD 100% STD Total warna
N Mean Rank Sum of Ranks
Test Statisticsa
1152,500 2427,500 -,699 ,485 Mann-Whitney U
Wilcoxon W Z
Asymp. Sig. (2-tailed)
warna
Grouping Variable: konsentrasi a.
Ranks
50 51,15 2557,50
50 49,85 2492,50
100 konsentrasi
90% t.ubi STD 100% STD Total warna
N Mean Rank Sum of Ranks
Test Statisticsa
1217,500 2492,500 -,234 ,815 Mann-Whitney U
Wilcoxon W Z
Asymp. Sig. (2-tailed)
warna
50 57,62 2881,00
50 43,38 2169,00
100 konsentrasi
80% t ubi CD 80% t.ubi STD Total
warna
N Mean Rank Sum of Ranks
Test Statisticsa
894,000 2169,000 -2,530 ,011 Mann-Whitney U
Wilcoxon W Z
Asymp. Sig. (2-tailed)
warna
Grouping Variable: konsentrasi a.
Ranks
50 51,71 2585,50
50 49,29 2464,50
100 konsentrasi
90% t.ubi CD 90% t.ubi STD Total
warna
N Mean Rank Sum of Ranks
Test Statisticsa
1189,500 2464,500 -,436 ,663 Mann-Whitney U
Wilcoxon W Z
Asymp. Sig. (2-tailed)
warna
Grouping Variable: konsentrasi a.
Ranks
50 51,03 2551,50
50 49,97 2498,50
100 konsentrasi
100% t.ubi CD 100% STD Total warna
1223,500 2498,500 -,192 ,848 Mann-Whitney U
Wilcoxon W Z
Asymp. Sig. (2-tailed)
Grouping Variable: konsentrasi a.
Ranks
50 53,75 2687,50
50 47,25 2362,50
100 konsentrasi
80% t ubi CD 90% t.ubi CD Total warna
N Mean Rank Sum of Ranks
Test Statisticsa
1087,500 2362,500 -1,164 ,244 Mann-Whitney U
Wilcoxon W Z
Asymp. Sig. (2-tailed)
warna
Grouping Variable: konsentrasi a.
Ranks
50 55,41 2770,50
50 45,59 2279,50
100 konsentrasi
80% t ubi CD 100% t.ubi CD Total
warna
N Mean Rank Sum of Ranks
Test Statisticsa
1004,500 2279,500 -1,758 ,079 Mann-Whitney U
Wilcoxon W Z
Asymp. Sig. (2-tailed)
warna
50 51,82 2591,00
50 49,18 2459,00
100 konsentrasi
90% t.ubi CD 100% t.ubi CD Total
warna
N Mean Rank Sum of Ranks
Test Statisticsa
1184,000 2459,000 -,478 ,633 Mann-Whitney U
Wilcoxon W Z
Asymp. Sig. (2-tailed)
warna
Grouping Variable: konsentrasi a.
UJI BEDA NYATA PARAMETER RASA
Ranks
50 41,28 2064,00
50 59,72 2986,00
100 konsentrasi
0% t.ubi CD 80% t ubi CD Total rasa
N Mean Rank Sum of Ranks
Test Statisticsa
789,000 2064,000 -3,278 ,001 Mann-Whitney U
Wilcoxon W Z
Asymp. Sig. (2-tailed)
rasa
Grouping Variable: konsentrasi a.
Ranks
50 40,41 2020,50
50 60,59 3029,50
100 konsentrasi
0% t.ubi CD 90% t.ubi CD Total rasa
745,500 2020,500 -3,562 ,000 Mann-Whitney U
Wilcoxon W Z
Asymp. Sig. (2-tailed)
Grouping Variable: konsentrasi a.
Ranks
50 38,67 1933,50
50 62,33 3116,50
100 konsentrasi
0% t.ubi CD 100% t.ubi CD Total
rasa
N Mean Rank Sum of Ranks
Test Statisticsa
658,500 1933,500 -4,183 ,000 Mann-Whitney U
Wilcoxon W Z
Asymp. Sig. (2-tailed)
rasa
Grouping Variable: konsentrasi a.
Ranks
50 48,51 2425,50
50 52,49 2624,50
100 konsentrasi
80% t ubi CD 90% t.ubi CD Total rasa
N Mean Rank Sum of Ranks
Test Statisticsa
1150,500 2425,500 -,706 ,480 Mann-Whitney U
Wilcoxon W Z
Asymp. Sig. (2-tailed)
rasa
50 47,08 2354,00
50 53,92 2696,00
100 konsentrasi
80% t ubi CD 100% t.ubi CD Total
rasa
N Mean Rank Sum of Ranks
Test Statisticsa
1079,000 2354,000 -1,218 ,223 Mann-Whitney U
Wilcoxon W Z
Asymp. Sig. (2-tailed)
rasa
Grouping Variable: konsentrasi a.
Ranks
50 49,23 2461,50
50 51,77 2588,50
100 konsentrasi
90% t.ubi CD 100% t.ubi CD Total
rasa
N Mean Rank Sum of Ranks
Test Statisticsa
1186,500 2461,500 -,450 ,653 Mann-Whitney U
Wilcoxon W Z
Asymp. Sig. (2-tailed)
rasa
Grouping Variable: konsentrasi a.
Ranks
50 52,78 2639,00
50 48,22 2411,00
100 konsentrasi
0% t.ubi CD 0% t.ubi STD Total rasa
N Mean Rank Sum of Ranks
Test Statisticsa
1136,000 2411,000 -,820 ,412 Mann-Whitney U
Wilcoxon W Z
Asymp. Sig. (2-tailed)
rasa
50 46,50 2325,00
50 54,50 2725,00
100 konsentrasi
80% t ubi CD 80% t.ubi STD Total
rasa
N Mean Rank Sum of Ranks
Test Statisticsa
1050,000 2325,000 -1,427 ,154 Mann-Whitney U
Wilcoxon W Z
Asymp. Sig. (2-tailed)
rasa
Grouping Variable: konsentrasi a.
Ranks
50 50,90 2545,00
50 50,10 2505,00
100 konsentrasi
90% t.ubi CD 90% t.ubi STD Total
rasa
N Mean Rank Sum of Ranks
Test Statisticsa
1230,000 2505,000 -,141 ,887 Mann-Whitney U
Wilcoxon W Z
Asymp. Sig. (2-tailed)
rasa
Grouping Variable: konsentrasi a.
Ranks
50 50,46 2523,00
50 50,54 2527,00
100 konsentrasi
100% t.ubi CD 100% STD Total rasa
1248,000 2523,000 -,014 ,989 Mann-Whitney U
Wilcoxon W Z
Asymp. Sig. (2-tailed)
rasa
Grouping Variable: konsentrasi a.
Ranks
50 36,32 1816,00
50 64,68 3234,00
100 konsentrasi
0% t.ubi STD 80% t.ubi STD Total
rasa
N Mean Rank Sum of Ranks
Test Statisticsa
541,000 1816,000 -5,009 ,000 Mann-Whitney U
Wilcoxon W Z
Asymp. Sig. (2-tailed)
rasa
Grouping Variable: konsentrasi a.
Ranks
50 38,38 1919,00
50 62,62 3131,00
100 konsentrasi
0% t.ubi STD 90% t.ubi STD Total
rasa
N Mean Rank Sum of Ranks
Test Statisticsa
644,000 1919,000 -4,311 ,000 Mann-Whitney U
Wilcoxon W Z
Asymp. Sig. (2-tailed)
rasa
Grouping Variable: konsentrasi a.
Ranks
50 35,97 1798,50
50 65,03 3251,50
100 konsentrasi
0% t.ubi STD 100% STD Total rasa
523,500 1798,500 -5,146 ,000 Mann-Whitney U
Wilcoxon W Z
Asymp. Sig. (2-tailed)
rasa
Grouping Variable: konsentrasi a.
Ranks
50 52,67 2633,50
50 48,33 2416,50
100 konsentrasi
80% t.ubi STD 90% t.ubi STD Total
rasa
N Mean Rank Sum of Ranks
Test Statisticsa
1141,500 2416,500 -,770 ,441 Mann-Whitney U
Wilcoxon W Z
Asymp. Sig. (2-tailed)
rasa
Grouping Variable: konsentrasi a.
Ranks
50 51,02 2551,00
50 49,98 2499,00
100 konsentrasi
80% t.ubi STD 100% STD Total rasa
N Mean Rank Sum of Ranks
Test Statisticsa
1224,000 2499,000 -,187 ,852 Mann-Whitney U
Wilcoxon W Z
Asymp. Sig. (2-tailed)
rasa
50 48,61 2430,50
50 52,39 2619,50
100 konsentrasi
90% t.ubi STD 100% STD Total rasa
N Mean Rank Sum of Ranks
Test Statisticsa
1155,500 2430,500 -,672 ,501 Mann-Whitney U
Wilcoxon W Z
Asymp. Sig. (2-tailed)
rasa
Grouping Variable: konsentrasi a.
UJI BEDA NYATA PARAMETER INTENSITAS RASA
Ranks
50 37,74 1887,00
50 63,26 3163,00
100 konsentrasi
0% t.ubi CD 80% t ubi CD Total intns_rasa
N Mean Rank Sum of Ranks
Test Statisticsa
612,000 1887,000 -4,486 ,000 Mann-Whitney U
Wilcoxon W Z
Asymp. Sig. (2-tailed)
intns_rasa
Grouping Variable: konsentrasi a.
Ranks
50 37,99 1899,50
50 63,01 3150,50
100 konsentrasi
0% t.ubi CD 90% t.ubi CD Total intns_rasa
624,500 1899,500 -4,403 ,000 Mann-Whitney U
Wilcoxon W Z
Asymp. Sig. (2-tailed)
Grouping Variable: konsentrasi a.
Ranks
50 35,65 1782,50
50 65,35 3267,50
100 konsentrasi
0% t.ubi CD 100% t.ubi CD Total
intns_rasa
N Mean Rank Sum of Ranks
Test Statisticsa
1224,000 2499,000 -,186 ,852 Mann-Whitney U
Wilcoxon W Z
Asymp. Sig. (2-tailed)
intns_rasa
Grouping Variable: konsentrasi a.
Ranks
50 47,93 2396,50
50 53,07 2653,50
100 konsentrasi
80% t ubi CD 100% t.ubi CD Total
intns_rasa
N Mean Rank Sum of Ranks
Test Statisticsa
1121,500 2396,500 -,909 ,363 Mann-Whitney U
Wilcoxon W Z
Asymp. Sig. (2-tailed)
intns_rasa
50 49,82 2491,00
50 51,18 2559,00
100 konsentrasi
0% t.ubi CD 0% t.ubi STD Total intns_rasa
N Mean Rank Sum of Ranks
Test Statisticsa
1216,000 2491,000 -,244 ,808 Mann-Whitney U
Wilcoxon W Z
Asymp. Sig. (2-tailed)
intns_rasa
Grouping Variable: konsentrasi a.
Ranks
50 47,37 2368,50
50 53,63 2681,50
100 konsentrasi
80% t ubi CD 80% t.ubi STD Total
intns_rasa
N Mean Rank Sum of Ranks
Test Statisticsa
1093,500 2368,500 -1,116 ,265 Mann-Whitney U
Wilcoxon W Z
Asymp. Sig. (2-tailed)
intns_rasa
Grouping Variable: konsentrasi a.
Ranks
50 46,35 2317,50
50 54,65 2732,50
100 konsentrasi
90% t.ubi CD 90% t.ubi STD Total
intns_rasa
1042,500 2317,500 -1,506 ,132 Mann-Whitney U
Wilcoxon W Z
Asymp. Sig. (2-tailed)
Grouping Variable: konsentrasi a.
Ranks
50 50,37 2518,50
50 50,63 2531,50
100 konsentrasi
100% t.ubi CD 100% STD Total intns_rasa
N Mean Rank Sum of Ranks
Test Statisticsa
1243,500 2518,500 -,046 ,963 Mann-Whitney U
Wilcoxon W Z
Asymp. Sig. (2-tailed)
intns_rasa
Grouping Variable: konsentrasi a.
Ranks
50 34,77 1738,50
50 66,23 3311,50
100 konsentrasi
0% t.ubi STD 80% t.ubi STD Total
intns_rasa
N Mean Rank Sum of Ranks
Test Statisticsa
463,500 1738,500 -5,546 ,000 Mann-Whitney U
Wilcoxon W Z
Asymp. Sig. (2-tailed)
intns_rasa
50 34,05 1702,50
50 66,95 3347,50
100 konsentrasi
0% t.ubi STD 90% t.ubi STD Total
intns_rasa
N Mean Rank Sum of Ranks
Test Statisticsa
427,500 1702,500 -5,805 ,000 Mann-Whitney U
Wilcoxon W Z
Asymp. Sig. (2-tailed)
intns_rasa
Grouping Variable: konsentrasi a.
Ranks
50 35,22 1761,00
50 65,78 3289,00
100 konsentrasi
0% t.ubi STD 100% STD Total intns_rasa
N Mean Rank Sum of Ranks
Test Statisticsa
486,000 1761,000 -5,387 ,000 Mann-Whitney U
Wilcoxon W Z
Asymp. Sig. (2-tailed)
intns_rasa
Grouping Variable: konsentrasi a.
Ranks
50 50,47 2523,50
50 50,53 2526,50
100 konsentrasi
80% t.ubi STD 90% t.ubi STD Total
intns_rasa
1248,500 2523,500 -,011 ,991 Mann-Whitney U
Wilcoxon W Z
Asymp. Sig. (2-tailed)
Grouping Variable: konsentrasi a.
Ranks
50 50,97 2548,50
50 50,03 2501,50
100 konsentrasi
80% t.ubi STD 100% STD Total intns_rasa
N Mean Rank Sum of Ranks
Test Statisticsa
1226,500 2501,500 -,169 ,865 Mann-Whitney U
Wilcoxon W Z
Asymp. Sig. (2-tailed)
intns_rasa
Grouping Variable: konsentrasi a.
Ranks
50 50,99 2549,50
50 50,01 2500,50
100 konsentrasi
90% t.ubi STD 100% STD Total intns_rasa
N Mean Rank Sum of Ranks
Test Statisticsa
1225,500 2500,500 -,178 ,858 Mann-Whitney U
Wilcoxon W Z
Asymp. Sig. (2-tailed)
intns_rasa
Grouping Variable: konsentrasi a.
50 45,37 2268,50
50 55,63 2781,50
100 konsentrasi
0% t.ubi CD 80% t ubi CD Total overall
N Mean Rank Sum of Ranks
Test Statisticsa
993,500 2268,500 -1,827 ,068 Mann-Whitney U
Wilcoxon W Z
Asymp. Sig. (2-tailed)
overall
Grouping Variable: konsentrasi a.
Ranks
50 43,67 2183,50
50 57,33 2866,50
100 konsentrasi
0% t.ubi CD 90% t.ubi CD Total overall
N Mean Rank Sum of Ranks
Test Statisticsa
908,500 2183,500 -2,421 ,015 Mann-Whitney U
Wilcoxon W Z
Asymp. Sig. (2-tailed)
overall
Grouping Variable: konsentrasi a.
Ranks
50 43,02 2151,00
50 57,98 2899,00
100 konsentrasi
0% t.ubi CD 100% t.ubi CD Total
overall
876,000 2151,000 -2,637 ,008 Mann-Whitney U
Wilcoxon W Z
Asymp. Sig. (2-tailed)
Grouping Variable: konsentrasi a.
Ranks
50 48,35 2417,50
50 52,65 2632,50
100 konsentrasi
80% t ubi CD 90% t.ubi CD Total overall
N Mean Rank Sum of Ranks
Test Statisticsa
1142,500 2417,500 -,769 ,442 Mann-Whitney U
Wilcoxon W Z
Asymp. Sig. (2-tailed)
overall
Grouping Variable: konsentrasi a.
Ranks
50 32,69 1634,50
18 39,53 711,50
68 konsentrasi
80% t ubi CD 100% t.ubi CD Total
overall
N Mean Rank Sum of Ranks
Test Statisticsa
359,500 1634,500 -1,306 ,192 Mann-Whitney U
Wilcoxon W Z
Asymp. Sig. (2-tailed)
overall
50 48,88 2444,00
50 52,12 2606,00
100 konsentrasi
90% t.ubi CD 100% t.ubi CD Total
overall
N Mean Rank Sum of Ranks
Test Statisticsa
1169,000 2444,000 -,579 ,563 Mann-Whitney U
Wilcoxon W Z
Asymp. Sig. (2-tailed)
overall
Grouping Variable: konsentrasi a.
Ranks
50 53,60 2680,00
50 47,40 2370,00
100 konsentrasi
0% t.ubi CD 0% t.ubi STD Total overall
N Mean Rank Sum of Ranks
Test Statisticsa
1095,000 2370,000 -1,118 ,263 Mann-Whitney U
Wilcoxon W Z
Asymp. Sig. (2-tailed)
overall
Grouping Variable: konsentrasi a.
Ranks
50 52,58 2629,00
50 48,42 2421,00
100 konsentrasi
80% t ubi CD 80% t.ubi STD Total
overall
1146,000 2421,000 -,743 ,457 Mann-Whitney U
Wilcoxon W Z
Asymp. Sig. (2-tailed)
Grouping Variable: konsentrasi a.
Ranks
50 52,39 2619,50
50 48,61 2430,50
100 konsentrasi
90% t.ubi CD 90% t.ubi STD Total
overall
N Mean Rank Sum of Ranks
Test Statisticsa
1155,500 2430,500 -,671 ,502 Mann-Whitney U
Wilcoxon W Z
Asymp. Sig. (2-tailed)
overall
Grouping Variable: konsentrasi a.
Ranks
50 52,08 2604,00
50 48,92 2446,00
100 konsentrasi
100% t.ubi CD 100% STD Total overall
N Mean Rank Sum of Ranks
Test Statisticsa
1171,000 2446,000 -,560 ,575 Mann-Whitney U
Wilcoxon W Z
Asymp. Sig. (2-tailed)
overall
50 44,05 2202,50
50 56,95 2847,50
100 konsentrasi
0% t.ubi STD 80% t.ubi STD Total
overall
N Mean Rank Sum of Ranks
Test Statisticsa
927,500 2202,500 -2,302 ,021 Mann-Whitney U
Wilcoxon W Z
Asymp. Sig. (2-tailed)
overall
Grouping Variable: konsentrasi a.
Ranks
50 42,82 2141,00
50 58,18 2909,00
100 konsentrasi
0% t.ubi STD 90% t.ubi STD Total
overall
N Mean Rank Sum of Ranks
Test Statisticsa
866,000 2141,000 -2,729 ,006 Mann-Whitney U
Wilcoxon W Z
Asymp. Sig. (2-tailed)
overall
Grouping Variable: konsentrasi a.
Ranks
50 42,09 2104,50
50 58,91 2945,50
100 konsentrasi
0% t.ubi STD 100% STD Total overall
829,500 2104,500 -2,971 ,003 Mann-Whitney U
Wilcoxon W Z
Asymp. Sig. (2-tailed)
Grouping Variable: konsentrasi a.
Ranks
50 48,33 2416,50
50 52,67 2633,50
100 konsentrasi
80% t.ubi STD 90% t.ubi STD Total
overall
N Mean Rank Sum of Ranks
Test Statisticsa
1141,500 2416,500 -,771 ,441 Mann-Whitney U
Wilcoxon W Z
Asymp. Sig. (2-tailed)
overall
Grouping Variable: konsentrasi a.
Ranks
50 47,04 2352,00
50 53,96 2698,00
100 konsentrasi
80% t.ubi STD 100% STD Total overall
N Mean Rank Sum of Ranks
Test Statisticsa
1077,000 2352,000 -1,226 ,220 Mann-Whitney U
Wilcoxon W Z
Asymp. Sig. (2-tailed)
overall
50 49,16 2458,00
50 51,84 2592,00
100 konsentrasi
90% t.ubi STD 100% STD Total overall
N Mean Rank Sum of Ranks
Test Statisticsa
1183,000 2458,000 -,473 ,636 Mann-Whitney U
Wilcoxon W Z
Asymp. Sig. (2-tailed)
overall
Grouping Variable: konsentrasi a.
UJI
KENDALL’S TAU b
Overall - warna
Symmetric Measures
-,037 ,039 -,953 ,340
400 Kendall's tau-b
Ordinal by Ordinal N of Valid Cases
Value
Asymp.
Std. Errora Approx. Tb Approx. Sig.
Not assuming the null hypothesis. a.
Using the asymptotic standard error assuming the null hypothesis. b.
Overall – Aroma
Symmetric Measures
,172 ,040 4,310 ,000
400 Kendall's tau-b
Ordinal by Ordinal N of Valid Cases
Value
Asymp.
Std. Errora Approx. Tb Approx. Sig.
Not assuming the null hypothesis. a.
Using the asymptotic standard error assuming the null hypothesis. b.
Overall – tekstur
Symmetric Measures
,037 ,041 ,898 ,369
400 Kendall's tau-b
Ordinal by Ordinal N of Valid Cases
Value
Asymp.
Std. Errora Approx. Tb Approx. Sig.
Not assuming the null hypothesis. a.
,301 ,039 7,592 ,000 400
Kendall's tau-b Ordinal by Ordinal
N of Valid Cases
Value
Asymp.
Std. Errora Approx. Tb Approx. Sig.
Not assuming the null hypothesis. a.
Using the asymptotic standard error assuming the null hypothesis. b.
Overall – intens_rasa
Symmetric Measures
,097 ,039 2,455 ,014
400 Kendall's tau-b
Ordinal by Ordinal N of Valid Cases
Value
Asymp.
Std. Errora Approx. Tb Approx. Sig.
Not assuming the null hypothesis. a.