Summary To quantify the effects of crown thinning on the water balance and growth of the stand and to analyze the ecophysiological modifications induced by canopy opening on individual tree water relations, we conducted a thinning experi-ment in a 43-year-old Quercus petraea stand by removing trees from the upper canopy level. Soil water content, rainfall inter-ception, sap flow, leaf water potential and stomatal conduc-tance were monitored for two seasons following thinning. Seasonal time courses of leaf area index (LAI) and girth increment were also measured.
Predawn leaf water potential was significantly higher in trees in the thinned stand than in the closed stand, as a conse-quence of higher relative extractable water in the soil. The improvement in water availability in the thinned stand resulted from decreases in both interception and transpiration. From Year 1 to Year 2, an increase in transpiration was observed in the thinned stand without any modification in LAI, whereas changes in transpiration in the closed stand were accompanied by variations in LAI. The different behaviors of the closed and open canopies were interpreted in terms of coupling to the atmosphere. Thinning increased inter-tree variability in sap flow density, which was closely related to a leaf area competi-tion index. Stomatal conductance varied little inside the crown and differences in stomatal conductance between the treat-ments appeared only during a water shortage and affected mainly the closed stand. Thinning enhanced tree growth as a result of a longer growing period due to the absence of summer drought and higher rates of growth. Suppressed and dominant trees benefited more from thinning than trees in the codomi-nant classes.
Keywords: leaf area index, leaf water potential, soil water, stomatal conductance.
Introduction
Sessile oak (Quercus petraea (Matt.) Liebl), which covers 1.8 million ha in France, produces high quality wood. Tradition-ally, sessile oak stands originating from natural regeneration have been subjected to successive low intensity thinnings (Ningre and Doussot 1993). If high stand densities are main-tained, this silvicutural practice produces wood with regular
but narrow growth rings. However, as a consequence of such moderate thinning treatments, the high stand density fre-quently leads to crown shrinkage and slow diameter growth rate. This effect can only be reversed by heavy thinning (Mosandi et al. 1991). Recently, a more dynamic silvicultural practice has been implemented whereby trees are selected during the early stages of stand development and the areas around the selected trees subjected to heavy thinning. The selection of 60--100 crop trees per ha at an age of 40--60 years is now a widely accepted practice, because diameter growth is much less restricted by competition compared with classical silviculture treatments.
Studies on coniferous tree species have shown that thinning of forest stands can result in increased tree growth, by appor-tioning the available soil water among fewer trees (Black et al. 1980, Morikawa et al. 1986, Aussenac and Granier 1988). The growth of thinned stands of several species has been related to reduced soil water stress (Zahner 1968), as a consequence of a reduction of both canopy interception and stand transpiration. Jarvis (1975) outlined the changes in volume flow, hydraulic resistance and leaf water potential that might be expected to occur after thinning. Changes in transpiration rate, conducting cross-sectional area, canopy leaf area, water potential and hydraulic resistance following thinning have been considered as a set of homeostatic relationships by Whitehead et al. (1984). These relationships interact closely with both positive and negative feedbacks, and lead to transient stages in which causes or consequences of the observed phenomena are diffi-cult to identify. Moreover, it is not known how environmental conditions (rainfall, drought) influence the effects of thinning (Stogsdill et al. 1992). Information about some of these vari-ables may allow a functional explanation and prediction of the consequences of thinning on water relations at the individual tree and stand levels.
The two primary objectives of this study were (1) to quantify the effects of a heavy thinning on water balance, growth and leaf area index of an oak stand, and (2) to analyze the ecophysi-ological modifications induced by canopy opening at the indi-vidual tree level. Additional observations were also conducted to estimate the time lag before post-thinning canopy closure and to describe some of the physiological phenomena occur-ring duoccur-ring this transient stage.
Effects of thinning on soil and tree water relations, transpiration and
growth in an oak forest (Quercus petraea (Matt.) Liebl.)
N. BRÉDA, A. GRANIER and G. AUSSENAC
INRA, Unité de Bioclimatologie et Ecophysiologie, Champenoux, F-54280 Seichamps, France
Received March 7, 1994
Materials and methods
Experimental plots
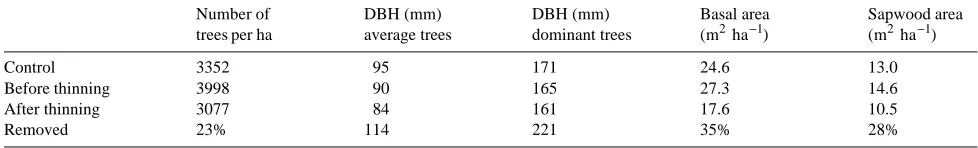
An almost pure 43-year-old natural oak stand was selected in Champenoux Forest, France (48°44′ N, 6°14′ E, altitude 237 m). In February 1992, 35% of the basal area (28% of the sapwood area) was removed from half of the stand (0.16 ha), leaving a plot with a basal area of 17.6 m2 ha−1 and tree density of 3077 trees ha−1. As shown by the diameter distribution (Figure 1), the crown thinning (Braathe 1957) removed mainly trees from the upper- and middle-crown classes especially among the codominant trees, leading to an opening of the canopy. The thinning type index, defined as the ratio of mean diameter of trees removed to the mean diameter of the whole crop before thinning (Hamilton and Christie 1973), was 1.26. An index value of >1 characterizes the removal of trees from the dominant crown class. Characteristics of the thinning and stand parameters of both treatments are given in Table 1. Removal of 35% of the original basal area was severe com-pared to conventional oak thinning practices (Ningre 1990). A 17.5-m high scaffolding tower was built in each plot and gave access to two levels of the crown of the sampled trees. Data were obtained during the two growing seasons following the thinning.
Meteorological data and precipitation interception
A weather station was installed on the top of a tower (2 m above the canopy) to record global radiation (pyranometer, Cimel, Paris, France), wet and dry bulb temperatures (venti-lated psychrometer, INRA model), and wind speed (anemome-ter A100R, Campbell Scientific, Logan, UT). Potential evapotranspiration (PET, mm) was calculated according to the Penman (1948) formula. Interception of global radiation was measured with three (control, unthinned plot) or six (thinned plot) linear thermopyranometers (INRA) horizontally fixed 1.5 m above the soil surface. Rainfall was measured by both a standard rain gauge in an opening adjacent to the study area (50 m) and a tipping bucket rain gauge above the canopy (Campbell ARG 100, Campbell Scientific, U.K.). Throughfall under the canopy was measured after each rain event in 21 gauges, with a collection area of 400 cm2, that were evenly distributed along three lines in each plot.
Soil water content
Volumetric soil water content was measured with a neutron probe (Norolisk Elektrisk Apparatfabrik, Denmark). Two 1.4-m long access tubes were installed within the control plot and 12 in the thinned plot where the spatial variability was ex-pected to be higher as a result of canopy opening. The center of each plot was also equipped with a 2.8-m long access tube. Soil water content was measured at approximately 2-week intervals from April until October during both 1992 and 1993. Relative extractable water (REW) was calculated as REW = (R
− Rmin)/EW, where R and Rmin are the actual soil water content and the minimum soil water content observed during the ex-periments, respectively, and EW is the maximum observed extractable water (EW = 180 and 130 mm for soil depths of 260 and 140 cm, respectively; see Bréda et al. 1995). Predawn leaf water potential
Predawn leaf water potential (Ψwp) was measured at least every week with a pressure chamber on two leaves from two trees per treatment. Mean values per treatment were calculated at each date. Midday leaf water potential (Ψwm) was measured at solar noon for each tree and a mean value was calculated from five replicates (two leaves from the base and three from the upper crown). Each midday water potential was a mean value of 10 replicates.
Sap flux and stand transpiration
Xylem sap flux density (SFD, dm3 dm−2 h−1) was monitored on four control trees and six (1992) or eight (1993) thinned Figure 1. Sapwood area (m2) distribution in each diameter class (mm)
before thinning (solid bars) and after thinning (white bars). Trees sampled for sap flow measurements in 1993 are indicated by their respective diameter class; * = control trees, 0 = thinned trees.
Table 1. Stand characteristics of control and treated plots, before and after thinning in 1992; DBH = diameter at breast height.
Number of DBH (mm) DBH (mm) Basal area Sapwood area
treesper ha average trees dominant trees (m2 ha−1) (m2 ha−1)
Control 3352 95 171 24.6 13.0
Before thinning 3998 90 165 27.3 14.6
After thinning 3077 84 161 17.6 10.5
trees. Sample trees were selected in all crown classes (domi-nant, codominant and suppressed) to match the diameter dis-tribution of the stand. This sampling procedure is illustrated in Figure 1 where trees studied in 1993 are marked. Radial sap flowmeters (Granier 1985, 1987) were inserted in the north side of stems before bud break and kept until autumn leaf fall. Sap flow (SF, dm3 h−1) was calculated as the product of SFD and actual sapwood area (SA, dm2), which was either esti-mated by a linear regression from SA to DBH (Bréda et al. 1993a, 1993b) or directly assessed on cores taken at flowmeter height at the end of the growing season. Mean daily stand transpiration (T, mm day−1) was computed from stand sap-wood area (see Table 1) and SFD by the procedure described by Bréda et al. (1993a, 1993b).
Specific hydraulic conductance
The soil-to-leaf hydraulic conductance (gL, µmol m−2 s−1 Pa−1) expressed per unit of sapwood area was calculated for two sample trees from each treatment on sunny days as the ratio of sap flux density (SFD) to leaf water potential gradient (Ψwp−
Ψwm) (Cohen et al. 1983).
Stomatal conductance
A steady-state porometer (model LI-1600, Li-Cor Inc., Lin-coln, NE) with a cuvette aperture of 2 cm2 was used to measure midday stomatal conductance (gs, cm s−1). The porometer was stored in the shade between measurements and carried in an isothermal backpack during tower climbing to prevent heating of the cuvette. Two control and two thinned oaks were inten-sively sampled on the east side of the crown: 10 leaves from the crown base and 10 others from the upper crown were measured. A total of 80 measurements (4 trees × 2 canopy levels × 10 leaves) were commonly stored in a storage module within a 1-h period. Only mature and fully expanded leaves were randomly sampled; factors such as sun exposure, acces-sibility, and the absence of caterpillars or Oidium damage were considered during the sampling.
Growth
Circumference increment was measured with a forest rule at breast height three to four times per month from mid-March to late October. A 100-tree subsample was taken in each plot in order to be statistically representative of the total stand diame-ter distribution, as well as of the stand diamediame-ter distribution for each circumference class (< 200 mm, 200--300 mm, 300--400 mm, > 400 mm).
Sapwood area and leaf area
During October 1993, all leaves were harvested from three control and six thinned trees, either after the tree had been felled or as the trees stood, by means of scaffolding towers. Total leaf area and the proportion of crown and epicormic shoots were determined. The quantity of epicormic shoots was identical in both treatments. Subsamples were removed from each treatment (crown/epicormic shoots, thinned/unthinned tree) for leaf area measurement (planimeter, Delta-T Devices, Cambridge, U.K.) and mass/area ratio calculation. The
sap-wood area at breast height (DBH) was measured directly on discs or cores.
Stand and leaf area index
Seasonal patterns of stand area index (SAI) including both leaf and wood area were established by means of a Demon leaf-area measurement system (Assembled Electronics, Sydney, Australia) that used direct solar beam transmission to compute gap fractions (Lang et al. 1985). Data collection was made on sunny days and included repeated measurements for at least three different times during each day. For each sun angle, a reference measurement was first taken in a nearby opening (forest road, 30 m away). Each of the two plot areas was then sampled by eight random transects of about 20 m each, and finally a new reference reading was stored. The SAI was computed for each day of measurement by averaging the logs of the measured transmittances with Demsoft, a computer software package (CSIRO, Canberra, Australia). This proce-dure accommodates natural gaps in the canopy similar to those in the thinned plot (Lang and Yuequin 1986). The SAI meas-urements were performed at breast height, so that the under-story was not taken into account.
Because the Demon system was not suitable for measuring local leaf area index or individual tree leaf area (Welles 1990), the LAI-2000 (Li-Cor Inc.) was used to estimate the stand competition index around each sample tree. Four below-can-opy measurements in four azimuth orientations were repli-cated twice for each tree. The above-canopy reference was taken from the top of the highest scaffolding tower, 2 m above the canopy. Measurements were performed on Day 265 (Sep-tember 22, 1993) early in the morning. The competition index was computed as SAItree /(4.5 − SAIlocal ), where SAI of the studied tree was determined within fields of view depending on lateral crown extension; 4.5 m2 m−2 was the maximum SAI measured in the control stand and within a 10-m radius area of the stand.
Maximal leaf area index (LAI) was computed from an autumn leaf-fall collection based on 21 leaf traps in both the thinned and control plots. Leaf traps (0.25 m2) were located beside each rain gauge. Litter collection was performed once a week from September 30 until December 31, on which date all the leaves had fallen. Leaves were dried for 48 h at 80 °C. Dry weights were converted to leaf areas based on litter spe-cific leaf area (g m−2) by sampling fresh litter from each basket at different dates and measuring leaf area with a planimeter (Delta-T Devices). Different specific leaf areas were deter-mined by linear regression of all sampled dates and baskets for the two studied years. There were no significant differences between thinned and control plots (66.5 g m−2 in 1992, 77.2 g m−2 in 1993).
Results
Water availability
midsummer (Days 205--220). In 1993, in contrast, spring rain-fall was below normal, August was exceptionally dry, and rainfall was heavy in early September. Cumulated PET over the growing season (May--October) was 650 and 570 mm during 1992 and 1993, respectively.
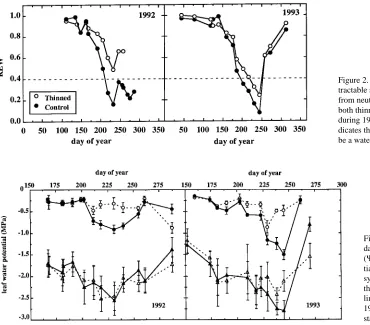
Rainfall interception was 16% in the thinned plot and 23% in the control plot during 1992, whereas in 1993, rainfall interception was 17% in both plots. As a consequence of both rainfall distribution and higher throughfall in the thinned plot, relative extractable soil water was higher in the thinned plot than in the control plot during the 2 years following thinning (Figure 2). Based on an REW value of 0.4 as the threshold for soil water deficit (see Granier 1987, Bréda et al. 1995), soil water deficits only occurred in the control plot for an ~80-day period in 1992 beginning at the end of July, whereas during 1993, soil water deficits occurred in both plots during the period from about mid-July until early September (about 57 and 35 days in the control and thinned plots, respectively).
Time-course of leaf water potential
The seasonal patterns of predawn leaf water potential (Ψwp) (Figure 3) reflected differences in water availability between the 2 years. During 1992, Ψwp of trees in the thinned plot never dropped below −0.5 MPa, whereas control trees experienced water stress from Day 210 until Day 255, and Ψwp reached −0.8 MPa during the period of maximum drought. The greatest difference in Ψwp between trees in the control and thinned plots
was 0.6 MPa on Day 230. Throughout the 1992 growing season, midday leaf water potentials (Ψwm) did not differ between treatments, but they were highly variable inside tree crowns as well as among both thinned and control trees.
During 1993, Ψwp was lower in control than in thinned trees from Day 190 until Day 245. Predawn leaf water potential was
−0.8 MPa on Day 225 in the thinned trees and recovered to about −0.5 MPa immediately after the rain events. The rainy period had no influence on Ψwp of control trees because of the slightly higher interception (+7%) by these trees. The differ-ence in Ψwp between treatments increased until Day 245, when
Ψwp reached a value of about −1.5 MPa in the control trees. The heavy late-season rainfall allowed Ψwp to recover to −0.25 MPa in both treatments. Throughout 1993, control trees exhib-ited slightly but consistently lower Ψwm than thinned trees; large differences between treatments only occurred on Days 237 and 245.
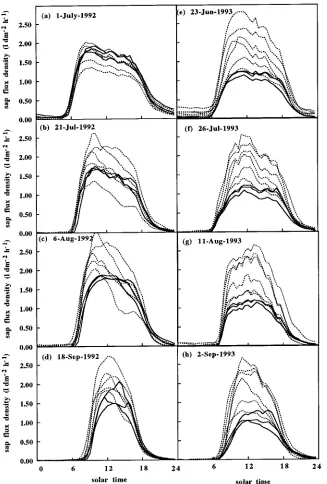
Diurnal variation of SFD
Daily time courses of sap flux densities (SFD, dm3 dm−2 h−1) of control and thinned trees were monitored during four sunny days without water stress in 1992 (Figures 4a--d) and 1993 (Figure 4f--h). Until July 1992 (Figure 4a), both control and thinned trees exhibited a stable daily pattern of SFD, with the exception of the suppressed tree (see also Bréda et al. 1993a), with maximum values of around 2 dm3 dm−2 h−1. Later in the year, SFD of trees in the thinned plot increased with maximum
Figure 2. Seasonal patterns of relative ex-tractable soil water (REW) computed from neutron probe measurements in both thinned (s) and unthinned (d) plots during 1992 and 1993. The dotted line in-dicates the value of REW considered to be a water deficit threshold.
values reaching 2.5 dm3 dm−2 h−1, whereas SFD of control trees remained constant, with midday values ranging between 1.0 and 1.5 dm3 dm−2 h−1. The codominant and suppressed trees in the thinned plot exhibited a diurnal time course of SFD that was asymmetric in shape as a result of early exposure to sun each day through the canopy opening, whereas the domi-nant trees in the thinned plot and all the control trees exhibited symmetric curves centered around midday (Figures 4b and 4c). In 1993, the maximum midday value of SFD of the control trees was reduced to 1.0 dm3 dm−2 h−1, whereas a large scatter-ing of SFD values rangscatter-ing from 1.0 to 2.5 dm3 dm−2 h−1 was again observed among trees in the thinned plot (Figure 4f).
To test the hypothesis that an imbalance in allometric rela-tions was induced by thinning and resulted in changes in SFD,
we analyzed the relationship between sapwood area at breast height (SA, cm2) and leaf area (LA, m2). No differences were detected among treatments, and a single significant relation-ship was established for both control and thinned trees (Fig-ure 5).
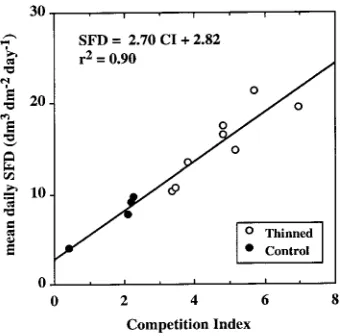
Because an imbalance in allometric relations did not explain the variability in SFD (cf. Tomé and Burkhart 1989), we used an analysis based on competition for water or light use. An empirical index for competition stress was computed as the ratio of LAI of the studied tree versus a maximum LAI of 4.5 m2 m−2. This competition index was highest for trees with large crowns and neighbors with low leaf area, and satisfactorily explained the variability in SFD (Figure 6).
Specific hydraulic conductance (gL) was highly variable Figure 4. Diurnal trends of sap flux den-sity measured on three control (solid lines) and five or six thinned (dotted lines) trees during 1992 (a--d) and 1993 (e--h). Pre-dawn leaf water potentials (Ψwp) were (a) and (b) Ψwp control = Ψwp thinned = −0.4 MPa; (c) Ψwp control = −0.7 MPa and
Ψwp thinned = −0.5 MPa; (d) Ψwp control = Ψwp thinned = −0.5 MPa; (e) and (f)
Ψwp control = Ψwp thinned = −0.25 MPa; (g) Ψwp control = −0.7 MPa and Ψwp thinned = −0.4 MPa; (h) Ψwp control =
during 1992, and no treatment related difference was detected (Figure 7). In 1993, after a decrease in the early summer (see Bréda et al. 1993a, 1993b), inter-tree variability in gL in each plot was low, and there was a significant difference between treatments as a result of a decrease in gL in the control trees to 1.0 µmol m−2 s−1 Pa−1, which was about half the value of gL in trees in the thinned plot.
Stomatal conductance (gs)
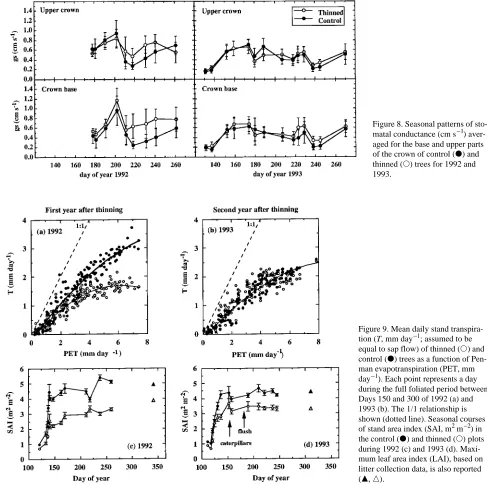
A progressive increase in gs as a result of both leaf maturation and increasing vapor pressure deficit (VPD) was observed until mid-July in 1992 and until mid-June in 1993 (bud break occurred earlier in 1993; Bréda et al. 1993a, 1993b). Leaf maturity allowing maximal stomatal conductances was reached on Day 200 in both the base and upper crown (Fig-ure 8). On average, midday stomatal conductances were al-most identical between the top and the base of the crown, as well as between treatments and between years. Differences between treatments only appeared in response to water stress. Thus, some differences between treatments appeared during the period of water stress in 1992 (after Day 210) and the differences were greater in the crown base than in the upper crown. Drought caused a decrease in gs of trees in the thinned plot but had no effect on gs of control trees. Only a slight difference in gs was noted between treatments during the period of water stress in 1993 (after Day 220), however, be-cause the drought be-caused a decline in gs in trees in both treatments. On a seasonal basis, both gs and minimum leaf water potential were lower in 1993 than in 1992 for all treat-ments and crown layers because of lower vapor pressure defi-cits during 1993.
Stand transpiration and leaf area index
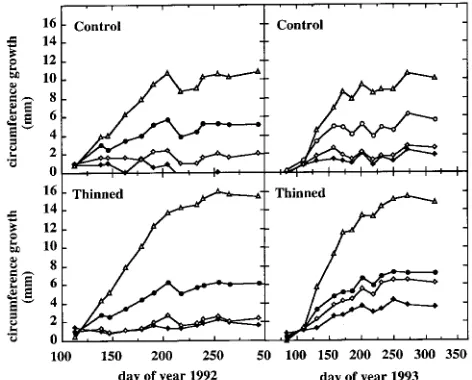
During 1992, the relationship between daily stand transpira-tion (T, mm day−1) and Penman evapotranspiration (PET, mm day−1) differed between control and thinned plots (Figure 9a). Maximum T in the thinned plot (2 mm day−1) was reached as PET exceeded 4 mm day−1, whereas in the control plot, maxi-mum T values of about 3 mm day−1 were only observed at PET values above 6 mm day−1. In 1992, the slope of the linear part of the T/PET relationship (PET ranging from 0 to 4 mm day−1) Figure 5. Total leaf area (leaves from crown and epicormic shoots) as
a function of sapwood area at breast height for control (d) and thinned (s) trees. Data were obtained at the end of 1993.
Figure 6. Relationship between total mean daily sap flux density, calculated for the period from Day 232 to Day 241 (1993), and the competition index for six thinned (s) and four control (d) trees.
was significantly higher in the control plot than in the thinned plot (slope = 0.50 and 0.38, respectively). There was no inter-treatment difference in the T/PET relationship in 1993 (Figure 9b) because of decreased transpiration of the control stand. Thus, the slope was reduced to 0.43 in the control plot, and there was a significant increase in the slope (0.48) in the thinned plot.
The difference in transpiration between 1992 and 1993 was partly related to variations in leaf area (Figures 9c and 9d). There was a significant difference in stand leaf area index between treatments throughout 1992 (Figure 9c). The leaf litter data collection indicated a difference of only 1.0, but this was probably an underestimate due to the intermixing of leaves by wind. Maximum stand leaf area index values for the thinned
and control plots were 3.3 and 5.1, respectively (Table 2). In 1993 (Figure 9d), the between-treatment difference in stand leaf area index was reduced to 0.9 as a result of a decrease in the stand leaf area index of the control plot (maximum: 4.2); the value of the thinned plot remained constant (maximum: 3.3). The values of stand leaf area index for the two years are consistent with the observed differences in stand transpiration and rainfall interception. The decrease of LAI in control trees and the stability of LAI in trees in the thinned plot may be attributed partly to heavy caterpillar damage in spring 1993, which reduced LAI by about 0.5.
Circumference increment
Although not statistically significant in the first year after Figure 8. Seasonal patterns of sto-matal conductance (cm s−1) aver-aged for the base and upper parts of the crown of control (d) and thinned (s) trees for 1992 and 1993.
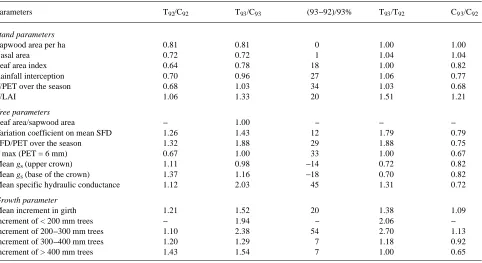
treatment, mean girth increment was higher in trees in the thinned plot than in the control plot (Table 3) because of the larger effect of thinning on dominant trees (> 400 mm in circumference) than on suppressed trees. A shrinkage of bark tissues in all circumference classes was observed during the 1992 drought. The difference in mean girth increment between treatments was statistically significant (t-test, 95%) in the second year. During 1993, girth increment was high both in dominant trees and in trees in the 200--300 mm class, whereas growth of trees in the codominant class (300--400 mm) was not improved. A comparison of inter-year growth for each plot indicated that control trees had a girth increment of about 5.5 mm during both 1992 and 1993. These increments were lower than those observed earlier (7.08 mm in 1989 and 8.4 mm in 1990) but similar to the value obtained during the dry year of 1991 (5.1 mm). Figure 10 illustrates the high girth increment in thinned trees in 1992, especially in dominant trees and to a lesser extent suppressed trees, whereas the codominant trees did not benefit from the thinning treatment. Trees in the thinned plot exhibited a significantly higher growth in circum-ference during 1993 than during 1992, which was explained by better growth in the two smallest tree classes. The absence of a significant difference in growth in the dominant trees be-tween 1992 and 1993 may be ascribed to the severe water shortage in 1993. The intra-year growth course showed that the higher girth increment in trees in the thinned plot compared with control trees resulted both from a higher growth rate and a longer growing period (Figure 10). The growing period of the control trees was limited by the summer drought and growth stopped around Day 200 (mid-July), whereas trees in the thinned plot exhibited sustained growth until Day 250 (mid-September).
Table 4 summarizes the modifications induced by thinning during the first and second years.
Discussion
We observed an 18% reduction in LAI in the control plot from Year 1 to Year 2 that was accompanied by an almost propor-tional decrease in rainfall interception (see Tables 3 and 4). The reduction in LAI led to an equivalent reduction (15%) in the T/PET ratio (Figure 11). The thinning treatment caused imme-diate decreases in both LAI and rainfall interception. However, in the second year after thinning, both treatments had similar interception rates (17%) despite a difference in LAI between plots of about 1.0. This was due to differences in canopy structure between the thinned and control plots. Both LAI and its distribution within the canopy are directly related to rainfall interception; however, LAI is not necessarily proportional to stand density. For this reason, many thinning experiments have shown that interception rate is not proportional to stand density (Rutter 1968, Aussenac and Granier 1988, Stogsdill et al. 1989). Aussenac (1975) observed only a small reduction in Table 2. Stand area index (based on Demon measurements) and leaf
area index (based on litter collection data) of control and thinned plots at the end of 1992 and 1993.
SAI Demon LAI Litter collection
1992
Control 5.11 4.91
Thinned 3.29 3.86
1993
Control 4.21 4.25
Thinned 3.30 3.15
Table 3. Cumulated circumference increment (mm) over two growing seasons for trees in the control (C) and thinned (T) plots. Significant differences (t-test) between treatments or years are indicated (NS = nonsignificant, * = significant at 95%).
Circumference 1992 1993 Treatment effect Year effect
C T C T C92 versus T92 C93 versus T93 C92 versus C93 T92 versus T93
All classes 5.3 6.4 5.8 8.8 1.02 (NS) 3.04* 0.41 (NS) 2.42*
< 200 mm 0.0 1.7 1.8 3.5 1.83 (NS) 1.74 (NS) 1.96 (NS) 1.88*
200--300 mm 2.1 2.3 2.6 6.2 0.29 (NS) 3.59* 0.50 (NS) 3.81*
300--400 mm 5.1 6.1 5.6 7.2 0.96 (NS) 1.59 (NS) 0.45 (NS) 1.09 (NS)
> 400 mm 10.8 15.4 10.0 15.4 4.64* 5.31* −0.75 (NS) −0.08 (NS)
rainfall interception (from 23.8 to 17.2%) as a result of a large decrease in stand density (70% of stems removed) in thinned oak stands, although the reduction was proportional to vari-ations in LAI (28%).
The relative extractable water was higher in the thinned plot than in the control plot, although the difference was not signifi-cant during the whole season (cf. Sucoff and Hong 1974, Donner and Running 1986, Aussenac and Granier 1988, Stogsdill et al. 1992). The more rapid development of soil water deficits in the control plot than in the thinned plot during 1992 was due to greater soil water extraction and reduced throughfall (Stogsdill et al. 1992). Because predawn leaf water potential (Ψwp) reflects soil water potential in the wettest
rooted horizon (Aussenac et al. 1984, Bréda et al. 1995), the higher Ψwp in thinned trees than in control trees is consistent with the observed higher water availability in the thinned plot compared with the control plot (cf. Sucoff et al. 1974, Donner and Running 1986, Aussenac and Granier 1988, Cregg et al. 1990, Pothier and Margolis 1990).
Although LAI in the thinned plot did not increase between 1992 and 1993, a lower soil water content was observed during 1993 as a result of (1) a higher transpiration rate of trees in the thinned plot, (2) a larger amount of oak sprouts in the under-story that invaded the thinned plot, and (3) a lower rainfall. The understory was not taken into account in the LAI measure-ments, although competition for soil water by the understory may occur (Black et al. 1980, Stogsdill et al. 1992). Whitehead et al. (1984) showed a rapid increase in leaf area after thinning in Pinus sylvestris L. Aussenac and Granier (1988), studying the effects of thinning in a young Douglas-fir plantation, ob-served a rapid recovery (in 3 years) of the pre-thinning water balance that was related to root recolonization and an increase in tree foliar mass in the thinned stand, leading to higher transpiration rates. Cregg et al. (1990) also reported rapid changes in canopy leaf area of Pinus taeda L. in response to thinning. In the oak stand in our study, two growing seasons may not have been sufficient to detect any crown enlargement after thinning, which takes longer in oak than in coniferous species.
Thinning led to a proportional decrease in T/PET as a func-tion of LAI. This is consistent with the results of Morikawa et al. (1986), who measured a 17% decrease in transpiration rate, associated with a 22% decrease in stand leaf mass caused by thinning in a 31-year-old Chamaecyparis obtusa Endl. stand. Table 4. Summary of the parameters modified either by thinning (expressed as the thinned versus control ratio for 1992 and 1993) or from one year to the other (expressed as the 93 versus 92 ratio in thinned and control trees).
Parameters T92/C92 T93/C93 (93--92)/93% T93/T92 C93/C92
Stand parameters
Sapwood area per ha 0.81 0.81 0 1.00 1.00
Basal area 0.72 0.72 1 1.04 1.04
Leaf area index 0.64 0.78 18 1.00 0.82
Rainfall interception 0.70 0.96 27 1.06 0.77
T/PET over the season 0.68 1.03 34 1.03 0.68
T/LAI 1.06 1.33 20 1.51 1.21
Tree parameters
Leaf area/sapwood area -- 1.00 -- --
--Variation coefficient on mean SFD 1.26 1.43 12 1.79 0.79
SFD/PET over the season 1.32 1.88 29 1.88 0.75
T max (PET = 6 mm) 0.67 1.00 33 1.00 0.67
Mean gs (upper crown) 1.11 0.98 −14 0.72 0.82
Mean gs (base of the crown) 1.37 1.16 −18 0.70 0.82
Mean specific hydraulic conductance 1.12 2.03 45 1.31 0.72
Growth parameter
Mean increment in girth 1.21 1.52 20 1.38 1.09
Increment of < 200 mm trees -- 1.94 -- 2.06
--Increment of 200--300 mm trees 1.10 2.38 54 2.70 1.13
Increment of 300--400 mm trees 1.20 1.29 7 1.18 0.92
Increment of > 400 mm trees 1.43 1.54 7 1.00 0.65
During 1993, because the 16% increase in T/PET was not accompanied by an increase in LAI, the T/PET ratio increased 34%, suggesting a positive effect of thinning on crown insola-tion. During 1993 in the control plot, the T/PET ratio decreased 27% and LAI decreased 22% (Figure 11). We conclude that LAI limits transpiration (T/PET) in canopies with high LAI such as in the control plots, whereas in open canopies with a low LAI, transpiration is also dependent on climatic factors such as net radiation, wind and VPD.
The variation coefficient of the mean sap flow density (SFD) was consistently larger among trees in the thinned plot than among trees in the control plot, and this variation increased between 1992 and 1993. Tree transpiration was not correlated with stem diameter, but it was closely related to a local leaf area competition index. This finding is consistent with the results of Morikawa et al. (1986), who found no difference in sap flow density before and after thinning in trees in the intermediate crown position. Dye and Olbrich (1993) found that SFD maxima in Eucalyptus were closely and linearly related to the sapwood area/leaf area (SA/LA) ratio. In oaks, the SFD to SA/LA relationship was poor, indicating that the SA/LA ratio was not linked with the increase in SFD.
There are many studies of the effects of stand density on the relationship between leaf area and sapwood area in coniferous species (see review by Shelburne et al. 1993) showing that a large amount of leaf area per unit sapwood area is a charac-teristic of low-density stands. We did not observe such a relationship in the allometric balance in oaks nor did we find significant differences in sapwood width among treatments on cores taken at the end of 1993. Pothier and Margolis (1990) also reported that thinning did not affect sapwood area in birch and fir even after 2 years, although Ψwp was affected. Phelps and Chen (1991) found that, 15 years after thinning, the amount of heartwood was significantly greater in white oak trees from unthinned stands than from thinned stands, regard-less of crown class. They also observed that, in both codomi-nant and suppressed trees, the radial width of sapwood was 12 and 23% larger in thinned than in control white oak trees, respectively.
Seasonal changes in stomatal behavior could be attributed to changes in both leaf expansion and maturation (Bréda et al. 1993a, 1993b) and soil water status. Stomatal conductance of control trees decreased with increasing drought to values simi-lar to those observed during the dry summer of 1991 (0.2 cm s−1) (Bréda et al. 1993a, 1993b). Differences in midday sto-matal conductance between leaves in the upper and lower parts of tree canopies in both the control and thinned plots were small, which is consistent with the small difference in midday leaf water potential between the upper and lower crown layers. Leaf-to-leaf variability was larger than variability between crown layers. When a moderate water stress was imposed, however, the decline in gs was more marked in leaves at the crown base than in the upper crown (cf. Tan et al. 1977).
The similarity in midday gs between treatments contrasted with the increase in sap flow density measured in the thinned trees. However, even with identical gs, total tree transpiration could differ because of differences in vertical profiles of VPD
(not measured in this study). In addition, Meinzer and Grantz (1991) and Meinzer et al. (1993) emphasized the importance of taking into account the decoupling influence of the leaf and canopy boundary layers when comparing transpiration esti-mated from porometric measurements or stem heat balance. A good agreement between transpiration measured at leaf or tree level generally requires an intensive sampling procedure that incorporates both multilayer and multi-orientation sampling (Leverenz et al. 1982, Dolman et al. 1991, Dye and Olbrich 1993).
The soil-to-leaf hydraulic conductance (gL) increased 24% in response to thinning, as a consequence of the increase in sap flux density and the constancy of the soil-to-leaf water poten-tial gradients. Similar differences in gL between control and thinned trees were also observed when expressed on a leaf area basis (instead of a sapwood area basis). The hydraulic conduc-tance values expressed per unit of leaf area are consistent with values reported by Reich and Hinckley (1989) and Simonin et al. (1994) for various oak species and confirm the hypothesis of a proportional decrease in both sapwood width and leaf area in unthinned trees.
Thinning enhanced radial growth during 1992. As a result of the less severe water deficits in late summer in the thinned plot than in the control plot, radial growth was maintained for a longer period at a sustained rate in the thinned plot than in the control plot (cf. Zahner 1968, Aussenac and Granier 1988). Radial expansion ceased in stems of control trees when REW was in the range of 0.45 to 0.35. At the same time, REW in the thinned plot was about 0.55 and growth was still occurring at a high rate. However, we could not establish a close relation-ship between cessation of girth increment and REW, probably because of the influence of climatic conditions during the previous year. Previous effects of recurrent droughts, spring frost and reduction of LAI have to be taken into account in explaining interannual growth variation in this ring-porous species. Circumference increment of dominant trees was sig-nificantly improved by thinning, and the growth rate of the suppressed trees was influenced more by thinning than that of the codominant trees, probably because of an increase in light for tree crowns which was more significant for the suppressed trees than for the codominant trees (cf. Schlesinger 1978, Phelps and Chen 1991).
In conclusion, thinning induced a significant increase in individual tree and stand-level transpiration of oaks, as a con-sequence of higher water and energy availability. But neither leaf area nor sapwood area increased, contrary to the rapid increase in leaf area generally observed in coniferous trees. This specific behavior of oaks is likely related to their slow growth, which is highly dependent on previous climatic condi-tions.
Acknowledgments
References
Aussenac, G. 1975. Couverts forestiers et facteurs du climat: leurs intéractions, conséquences écophysiologiques chez quelques rési-neux. Thèse de Docteur es Sciences, Univ. Nancy I, Paris, France, 234 p.
Aussenac, G. and A. Granier. 1988. Effects of thinning on water stress and growth in Douglas-fir. Can. J. For. Res. 18:100--105. Aussenac, G., A. Granier and M. Ibrahim. 1984. Influence du
dessèchement du sol sur le fonctionnement hydrique et la crois-sance du douglas (Pseudotsuga menziessi (Mirb.) Franco). Acta Oecol. Oecol. Plant 5:241--253.
Black, T.A., C.S. Tan and J.U. Nnyamah. 1980. Transpiration rate in Douglas-fir trees in thinned and unthinned stands. Can. J. Soil Sci. 60:625--631.
Braathe, P. 1957. Thinnings in even-aged stands: a summary of Euro-pean literature. Faculty of Forestry, University of New Brunswick, Fredericton, NB, Canada, 92 p.
Bréda, N., H. Cochard, E. Dreyer and A. Granier. 1993a. Water transfer in a mature oak stand (Quercus petraea): seasonal evolu-tion and effects of a severe drought. Can. J. For. Res. 23:1136--1143. Bréda, N., H. Cochard, E. Dreyer and A. Granier. 1993b. Field com-parison of transpiration, stomatal conductance and vulnerability to cavitation of Quercus petraea and Quercus robur under water stress. Ann. Sci. For. 50:571--582.
Bréda, N., A. Granier, F. Barataud and C. Moyne. 1995. Soil water dynamics in an oak stand: soil moisture, water potentials and root water uptake. Plant Soil. In press.
Cohen, Y., M. Fuchs and S. Cohen. 1983. Resistance to water uptake in a mature citrus tree. J. Exp. Bot. 34:451--460.
Cregg, B.M., T.C. Hennessey and P.M. Dougherty. 1990. Water rela-tions of loblolly pine trees in southern Oklahoma following pre-commercial thinning. Can. J. For. Res. 20:1508--1513.
Dolman, A.J., J.H.C. Gash, J. Roberts and W.J. Schuttelworth. 1991. Stomatal and surface conductance in tropical rainforest. Agric. For. Meteorol. 54:303--318.
Donner, B.L. and S.W. Running. 1986. Water stress response after thinning Pinus contorta stands in Montana. For. Sci. 32:614--625. Dye, P.J. and B.W. Olbrich. 1993. Estimation transpiration from
6-year-old Eucalyptus grandis tree: development of a canopy conduc-tance model and comparison with independent sap flux measurements. Plant Cell Environ. 16:45--53.
Granier, A. 1985. Une nouvelle méthode pour la mesure du flux de sève brute dans le tronc des arbres. Ann. Sci. For. 42:193--200. Granier, A. 1987. Evaluation of transpiration in a Douglas-fir stand by
means of sap flow measurements. Tree Physiol. 3:309--320. Hamilton, G.J. and J.M. Christie. 1973. Construction and application
of stand yield models. In Growth Models for Tree and Stand Simulation. Ed. J. Fries. Proceedings of IUFRO meeting, Stock-holm, pp 223--237.
Jarvis, P.G. 1975. Water transfer in plants. In Heat and Mass Transfer in the Plant Environment. Part 1. Eds. D.A. de Vries and N.G. Afgan. Scripta Book Co., Washington, D.C., pp 369--394. Lang, A.R.G., X. Yuegin and J.M. Norman. 1985. Crop structure and
the penetration of direct sunlight in discontinuous canopies. Agric. For. Meteorol. 37:229--243.
Lang, A.R.G. and X. Yuegin. 1986. Estimation of leaf area index from transmission of direct sunlight in discontinuous canopies. Agric. For. Manage. 37:229--243.
Leverenz, J.W., J.D. Deans, E.D. Ford, P.G. Jarvis, R. Milne and D. Whitehead. 1982. Systematic spatial variation of stomatal conduc-tance in a Sitka Spruce plantation. J. Appl. Ecol. 19:835--851.
Meinzer, F.C., G. Goldstein, N.M. Holbrook, P. Jackson and J. Cav-elier. 1993. Stomatal and environmental control of transpiration in a lowland tropical forest tree. Plant Cell Environ. 16:429--436. Meinzer, F.C. and D.A. Grantz. 1991. Coordination of stomatal,
hy-draulic and canopy boundary layer properties: do stomatal balance conductance by measuring transpiration? Physiol. Plant. 83:324--329.
Morikawa, Y., A. Hattori and Y. Kiyono. 1986. Transpiration of a 31-year-old Chamaecyparis obtusa Endl. stand before and after thinning. Tree Physiol. 2:105--114.
Mosandi, R., H.E. Kateb and J. Ecker. 1991. Untersuchungen zur Behandlung von jungen Eichenbeständen. Forstw. Cbl. 110:358--370.
Ningre, F. 1990. Comparison de différentes modalités d’éclaircie du chêne sessile. Premiers résultats d’un dispositif expérimental situé en forêt domaniale de Réno-Valdieu (Orne). R.F.F., XLII, pp 254--264.
Ningre, F. and R. Doussot. 1993. La ressource forestière française en chêne rouvre et pédonculé, analyse et explication historique. Ann. Sci. For. 50:593--606.
Penman, H.L. 1948. Natural evaporation from open water, bare soils, and grass. Proc. R. Soc. Ser. A 193:120--145.
Phelps, J.E. and P.Y.S. Chen. 1991. Wood and drying properties of white oak from thinned and unthinned plantations. For. Prod. J. 41:34--38.
Pothier, D. and H.A. Margolis. 1990. Change in the water relations of balsam fir and white birch saplings after thinning. Tree Phsyiol. 6:371--380.
Reich, P.B. and T.M. Hinckley. 1989. Influence of pre-dawn potential and soil-to-leaf hydraulic conductance on maximal daily leaf diffu-sive conductance in two oak species. Funct. Ecol. 3:719--726. Rutter, A.J. 1968. Water consumption by forests. In Water Deficits and
Plant Growth. Vol. II. Ed. T.T. Kozolwski, Academic Press, New York, pp 23--76.
Schlesinger, R.C. 1978. Increased growth of released white oak poles continues through two decades. J. For. 76:726--727.
Shelburne, V.B., R.L. Hedden and R.M. Allen. 1993. The effects of site, stand density, and sapwood permeability on the relationship between leaf area and sapwood area in loblolly pine (Pinus taeda L.). For. Ecol. Manage. 58:193--209.
Simonin, G., H. Cochard, C. Delatour, A. Granier and E. Dreyer. 1994. Vulnerability of young oaks (Quercus robur) to embolism: re-sponses to drought and to an inoculation with Ophiostoma querci. Ann. Sci. For. 51:493--504.
Stogsdill, W.R., R.F. Wittwer, T.C. Hennessey and P.M. Dougherty. 1989. Relationship between throughfall and stand density in a Pinus taeda plantation. For. Ecol. Manage. 29:105--113.
Stogsdill, W.R., R.F. Wittwer, T.C. Hennessey and P.M. Dougherty. 1992. Water use in thinned loblolly pine plantations. For. Ecol. Manage. 50:233--245.
Sucoff, E. and S.G. Hong. 1974. Effects of thinning on needle water potential in red pine. For. Sci. 20:25--29.
Tan, C.S., T.A. Black and J.U. Nnyamah. 1977. A simple diffusion model of transpiration applied to a thinned Douglas-fir stand. Ecol-ogy 59:1221--1229.
Tomé, M. and H.E. Burkhart. 1989. Distance-dependent competitions measures for predicting growth of individual trees. For. Sci. 35:816--831.
Welles, J.M. 1990. Some indirect methods of estimating canopy struc-ture. Sens. Rev. 5:31--43.