Summary Physical and functional properties of foliage were measured at a variety of microsites in a broad-leaved Notho-fagus fusca (Hook. f.) Ørst. canopy. The light climate of the foliage at these sites was monitored for 39 days in the late spring and early summer with in situ sensors. Foliage nitrogen content (N), mean leaf angle, and gas exchange characteristics were all correlated with the amount of light reaching the microsites during foliage development. Foliage N content on a leaf area basis ranged between ~1 and 2.5 g N m−2 and was highest at the brightest sites. Light-saturated photosynthetic rates ranged between ~4 and 9 µmol m−2 s−1, increasing from the darkest to brightest sites.
A biochemical model of photosynthesis was fitted to foliage characteristics at the different microsites and used to integrate foliage assimilation among the sites over 39 days. The actual arrangement of foliage physiological characteristics in the observed microsites led to higher total canopy rates of net assimilation than >99% of the combinations of observed foli-age characteristics randomly assigned to the observed mi-crosites. Additional simulations first related the maximum rates of electron transport (Jmax), ribulose bisphosphate turn-over (Vc,max), and dark respiration (Rd) of Nothofagus fusca foliage to nitrogen content and then allowed foliage N (and consequently leaf gas exchange characteristics) to vary across the canopy. The observed N allocation pattern results in greater total canopy assimilation than uniform or >99% of the simula-tions with random distribusimula-tions of N among the microsites (constrained so that the total N allocated was equivalent to that observed in the microsites). However, the observed pattern of N allocation places less N in the brightest microsites and results in substantially less total assimilation than a simulated canopy in which N was allocated in an optimal manner where the N distribution is such that the partial derivative of leaf assimilation (A) with respect to leaf nitrogen content, ∂A/∂N, is constant among microsites. These results suggest that other factors such as wind or herbivory reduce the integrated assimi-lation of high-N foliage relatively more than lower-N foliage and that a ∂A/∂N optimality criteria based only on formula-tions of leaf gas exchange overestimate canopy assimilation. Keywords: light penetration, optimization, photosynthesis model, remote sensing, simulation model.
Introduction
The positive relationship between leaf nitrogen and photosyn-thetic capacity (e.g., Mooney and Gulmon 1979, Field 1983, Field and Mooney 1986) is one of the most robust results of modern ecophysiology. This relationship is based on the fact that the principal carboxylating enzyme of plants, ribulose-bisphosphate carboxylase-oxygenase (Rubisco) makes up a significant fraction of the total leaf protein (Björkman 1968). Because nitrogen is generally a scarce resource that limits plant carbon gain (Chapin et al. 1987), natural selection will favor individuals that allocate N in an efficient manner through the canopy (Field 1983, Hirose and Werger 1987, Hollinger 1989, Field 1991). Field (1983) suggested that N would be allocated optimally in a plant canopy when the marginal in-crease in assimilation (A) with an increase in N was constant throughout the canopy (∂A/∂N constant). Studies of N alloca-tion in a variety of tree and crop species indicating that more N is allocated per unit foliage area or per unit foliage mass in the brighter sites at the top of a canopy than at the darker sites lower in the canopy are consistent with this hypothesis (e.g., Field 1983, DeJong and Doyle 1985, Hirose and Werger 1987, Hirose et al. 1989, Hollinger 1989, Evans 1989, Leuning et al. 1991a, 1991b, Ellsworth and Reich 1993). Several studies (Sellers et al. 1992, Wu 1993, Anten et al. 1995) have ad-dressed this issue analytically for simple radiation models in one-dimensional plant canopies and shown that ∂A/∂N is con-stant when N is allocated at a site within the canopy in propor-tion to the fracpropor-tion of photosynthetically active radiapropor-tion (FPAR, hereafter referred to as the fraction of photosyntheti-cally active photon flux density, FPPFD) received at that site. Field validation of these results is desirable because the results of Sellers et al. (1992) provide important simplifications and constraints for models of land surface CO2 exchange.
The goal of this study was to assess the optimal allocation hypothesis experimentally with coordinated measurements of light, N, and photosynthetic performance in a variety of mi-crosites in the canopy of a large forest tree species. A model that coupled stomatal conductance to assimilation was used to integrate assimilation over time and among microsites based on the half-hourly mean photosynthetically active photon flux density (PPFD) in each microsite and above-canopy values for temperature and humidity. In the first set of simulations, leaf parameters were estimated for foliage in each microsite. This
Optimality and nitrogen allocation in a tree canopy
D. Y. HOLLINGER
Manaaki Whenua - Landcare Research, PO Box 31-011, Christchurch, New Zealand Present address: USDA Forest Service, PO Box 640, Durham, NH 03824, USA
Received July 21, 1995
allowed the calculation of canopy assimilation with leaves in their native positions to be compared with simulations in which leaves were substituted into other than their original PPFD microsites. In a second set of simulations, key leaf parameters were related to leaf nitrogen values and the N at any microsite used to set model parameters for subsequent simula-tions. This allowed the calculation of canopy assimilation with the observed pattern of N distribution to be compared with other ways of allocating the same total quantity of N among the microsites.
Materials and methods
This study was carried out in undisturbed, old-growth Notho-fagus forest near the township of Maruia, South Island, New Zealand (42°12′ S, 172°15′ E; 400 m a.s.l.). The forest is dominated by emergent Nothofagusfusca (Hook. f.) Ørst. (red beech) trees, a temperate, broad-leaved evergreen, approxi-mately 30 m tall with a 15-m canopy depth. The vegetation, soils, climate, and forest--atmosphere gas and energy exchange at this site have been described elsewhere (Stewart et al. 1991, Kelliher et al. 1992, Hollinger et al. 1994).
The canopy was reached with a 32-m tall square scaffolding tower. A column of canopy ~9 m on a side was accessible from the tower. Microsites within the canopies of several Notho-fagusfusca were chosen to represent the range of light condi-tions from the top (~32 m) to the lowest layers at ~17 m. Photodiodes (NEC model PH-201A) were affixed to horizon-tal supports at 30 of these microsites, and the photosyntheti-cally active photon flux densities (PPFD) recorded at 3-s intervals and stored as 30-min averages with a system consist-ing of Model 21X data logger and two model AIM16 multi-plexers (Campbell Scientific, Logan, UT). The lack of near infrared sensitivity in the photodiodes makes them suitable PPFD sensors within the canopy (Gutschick et al. 1985). Data were recorded for 39 days, starting in the southern spring just before leaf expansion (Julian Day 302) and finishing about 4 weeks after new leaves were fully expanded. Total and diffuse PPFD, rainfall, wind speed, wind direction, air temperature, and relative humidity were measured above the canopy.
The foliage of branches at the microsites was sampled in early summer to determine leaf size, mass, nitrogen concentra-tion, and orientation. These data were used to calculate the foliage mass per unit area, N content per unit area, and G-func-tion for leaf radiaG-func-tion intercepG-func-tion (Lemeur 1973, Ross 1981). Canopy sampling methodology and sample preparation fol-lowed Hollinger (1989). Neutral density shade cloth bags (~50% shade) were affixed to eight branches before bud break to determine if leaf N content was affected by PPFD exposure during leaf expansion. Control and shaded foliage N contents were compared with a paired t-test.
Leaf gas exchange characteristics were determined during the (southern) summer of 1990 at 14 of the PPFD microsites and several other locations in the canopy with the system consisting of two climatized cuvettes described in Hollinger (1987). Cuvette CO2 partial pressure was regulated by mixing CO2-free air with ~1% CO2 in N2 by mass flow controllers (Tylan Corp., Torrance, CA). At each site, water vapor and CO2
exchange were measured at three different partial pressures of CO2 (~150, 300, and 450 µmol CO2 m−2 s−1; ~1000 µmol m−2 s−1 PPFD) and at a range of PPFDs (~340 µmol CO2 mol−1). The influences of temperature and leaf--air vapor pressure difference (∆W) on leaf gas exchange were determined on an additional four samples of foliage. All gas exchange data were calculated using the equations of Farquhar and Sharkey (1982) and expressed on a projected area basis.
Leaf model
Gas exchange data were used to estimate the biochemical parameters of a mechanistic model of leaf assimilation de-scribed by Berry and Farquhar (1978) and further developed by Farquhar et al. (1980) and Farquhar and von Caemmerer (1982). The model of leaf assimilation was coupled to a semi-empirical model of stomatal conductance (Ball et al. 1987, Ball 1988) following generally after Collatz et al. (1991) and Leuning (1995). The coupled models were used to estimate integrated daily assimilation within and between the different microsites of the Nothofagus canopy based on the measured PPFD data at each microsite. In this way the performance of foliage that developed in one microsite could be evaluated in other microsites.
Following Farquhar and von Caemmerer (1982), assimila-tion (A) is calculated as;
A=Vc(1 −Γ∗/Ci)−Rd, (1)
where Vc is the carboxylation velocity, Γ* is the CO2 compen-sation point without dark respiration, Ci is the intercellular partial pressure of CO2, and Rd is the rate of dark respiration. The carboxylation velocity is the lesser of either the ribulose bisphosphate (RuP2) saturated rate (Wc) or the electron trans-port limited rate of RuP2 regeneration (J′) (Farquhar et al. 1980). The RuP2 saturated rate is regulated by a maximum carboxylation velocity (Vc,max), Ci, the intercellular partial pressure of O2 (Oi), and the Michaelis constants for CO2 (Kc) and O2 (Ko).
The maximum rate of electron transport depends on irradi-ance (I) and a maximum rate of electron transport (Jmax) (Farquhar and von Caemmerer 1982).
Because enzymatic reaction rates are temperature depend-ent, the Michaelis constants, dark respiration rate and maxi-mum rate of RuP2 turnover are adjusted with the Arrhenius relation so that the rate at temperature T (rateT) is based on the rate at a base temperature (rate20) as;
rateT= rate20 e((TK− 293.16)E/(293.16RTK)), (2)
where TK is the absolute temperature, E is the activation energy (Table 1), and R is the universal gas constant (8.314 J K−1 mol−1). For the temperature response of Jmax, Farquhar et al. (1980) used a simplified version of an equation developed by Sharpe and DeMichelle (1977) that describes the effect of temperature on enzyme inactivation.
assimila-tion/temperature curves and Michaelis coefficients were esti-mated similarly from A/Ci curves following the methods of Kirschbaum and Farquhar (1984) and Brooks and Farquhar (1985). The activation energies and Michaelis coefficients were equivalent for all leaves in the simulations. Individual values for Jmax and Vc,max were then determined for foliage in the 14 microsites based on back-fitting the model using non-linear least square fits to A/Ci and A/PPFD curves from each microsite. The internal values of CO2 used in these fits were the values calculated from the gas exchange measurements of CO2 and H2O exchange.
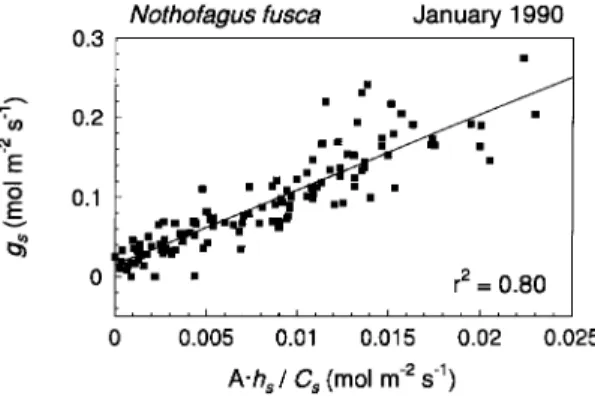
Stomatal conductance (gs) was calculated based on the semi-empirical relationship of Ball et al. (1987) as modified by Ball (1988);
gs=mAhs/ Cs+b, (3)
where hs is the relative humidity and Cs is the CO2 mole fraction (both at the leaf surface) and m and b are the slope and intercept obtained from regression analysis of cuvette gas exchange measurements. These coefficients were fitted from the total data set of Nothofagus CO2 and H2O exchange meas-urements (all A/Ci, A/∆W and A/PPFD curves where the PPFD was > 20 µmol m−2 s−1). Aphalo and Jarvis (1993) and Leuning (1995) present alternative, more mechanistic formulations of this relationship, but for the present study, Equation 3 was found sufficient.
The total assimilation of foliage in 14 microsites was deter-mined by running the coupled assimilation-conductance model for 39 days at a 30-min time step with the PPFD data for each microsite and above-canopy values of T and RH. The values of Vc,max, Jmax and Rd of foliage in each microsite were determined from the gas exchange measurements. All other
model parameters were identical among microsites. The exter-nal concentration of CO2 was fixed at 340 µl l−1. The integrated assimilation of leaves in their observed microsites was then compared with 5000 integrations of assimilation for foliage of the observed characteristics randomly assigned to the 14 mi-crosites. In these simulations, the set of Vc,max, Jmax and Rd measured for each microsite was randomly assigned to a mi-crosite such that each set was used once and assimilation summed for all sites over the 39 days.
In a second set of simulations, the total assimilation of foliage in the 14 microsites over 39 days was calculated as a function of foliage N content. To do this, Vc,max, Jmax and Rd20 were related to foliage N content by linear regression (Field 1983, Harley et al. 1992, Hollinger 1992). In the simulations here, the amount of N in each microsite was allowed to vary continuously within a range set by 80% of the lowest and 120% of the highest observed N content values. The total N content allocated among the 14 microsites was constrained to the observed total, 26.09 g m−2. Additional simulations were car-ried out with the actual N allocation pattern, N allocated equally to the 14 sites, and to determine constrained (leaf N limited to the range of values observed in the field) and uncon-strained (no limit to leaf N content except overall canopy limit of 26.09 g N m−2) patterns of N allocation that maximized total C gain over the 39-day sample period.
Results
Canopy light environment
On sunny days, the maximum half-hourly PPFD at this south-ern hemisphere site exceeded 2200 µmol m−2 s−1. However, on 13% of the study days the maximum above-canopy PPFD never exceeded 1000 µmol m−2 s−1. Integrated daily above-Table 1. Symbols, units, values and definitions for Nothofagus fusca leaf assimilation and stomatal conductance models (temperature-dependent parameters as at 20 °C).
Symbol Value Definition
Ci (Pa) 24.5 Intercellular partial pressure of CO2 (varies with I,gs, etc.)
O (Pa) 21,000 Partial pressure of O2
Γ* (Pa) 3.1 CO2 compensation point without Rd
Vc,max (µmol m−2 s−1) 40 Maximum carboxylation velocity (varies with leaf N) Jmax (µEq m−2 s−1) 80 Light saturated rate of electron transport (varies with leaf N)
Kc (Pa) 41 Michaelis constant for CO2
Ko (Pa) 35,000 Michaelis constant for O2
S (J K−1 mol−1) 700 Temperature coefficient for Jmax
H (J mol−1) 209,200 Temperature coefficient for Jmax
f 0.13 Fraction of light not absorbed by chloroplasts
m 9.4 Slope factor of conductance
b (mol m−2 s−1) 0.15 Stomatal conductance intercept
Activation energy (J mol−1) values
Kc 68,400
Ko 33,950
Rd 56,400
Vc,max 47,500
canopy PPFD ranged between 12 and 70 mol m−2. Overcast or predominantly diffuse light conditions were more common during foliage development than clear skies. During about 64% of the 30-min time periods within 4 h of solar noon, total PPFD was two-thirds or more diffuse. By contrast, during only 21% of these time periods did direct beam radiation exceed two-thirds or more of the total PPFD.
Sampled foliage microsites received photosynthetically ac-tive photon flux densities that ranged from 100 to about 8% of the above-canopy values. Examination of the fraction of total PPFD that was received at each sensor under clear (< 30% above-canopy diffuse PPFD) versus overcast conditions (> 70% above-canopy diffuse PPFD), shows that a higher proportion of above-canopy diffuse radiation penetrates through the canopy than direct beam radiation (Figure 1), presumably because of a higher frequency of gaps overhead than in the path of the solar beam.
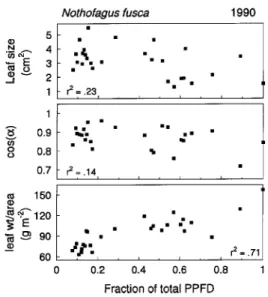
Leaf morphological characteristics
Leaf size, angle, and leaf mass per unit area (LMA) all varied significantly as a function of microsite light environment (Fig-ure 2). Leaves in the brighter microsites were about half the size of those in the darkest sites but had twofold higher LMA, indicating that individual leaf mass was roughly constant. Leaf nitrogen concentration did not vary significantly among leaves in the different microsites (data not shown), but because of the strong gradient in LMA, nitrogen mass per unit area (NMA) also varied among microsites (Figure 3). The variation in N was directly related to foliage PPFD during foliage develop-ment; the NMA of foliage from bright microsites that was shaded with neutral density screening was significantly less than that of adjacent, unscreened foliage (t = 4.56, P < 0.01), and more similar to foliage from lower PPFD microsites (Fig-ure 3).
Leaf physiological properties
Light saturated photosynthesis (Amax) and dark respiration at 20 °C (Rd) both varied significantly (P < 0.05) as a function of the foliage microsite light environment (Figure 4). For Amax and Rd, rates at the bottom of the canopy were about one-half and one-third, respectively, of those at the top. For Amax, the pattern of the residuals suggest that a saturating or curvilinear relationship may be a better model than the linear relationship shown in Figure 4.
The temperature optimum for Nothofagus assimilation was about 18 °C and dropped off rapidly above about 23 °C (Fig-ure 5). This response is consistent with the moderate summer temperatures at the site (Hollinger et al. 1994). The tempera-ture response was simulated in the model by fitting the activa-tion energies and H and S in the Jmax relationship (Table 1 and Figure 5).
Figure 1. Fraction of above-canopy PPFD reaching the fixed sensors during clear (diffuse PPFD < 30% of total) and overcast (diffuse PPFD > 70% of total) conditions. The PPFD fractional penetration is signifi-cantly greater under overcast than clear conditions (P < 0.01, z test).
Figure 2. Foliage characteristics as a function of the foliage PPFD environment.
The slope and intercept from a plot of Ahs/Cs versus gs (Figure 6) for Nothofagus were about 9.4 and 0.15 mol µ−2 s−1, respectively, which are values similar to those used by Collatz et al. (1991). Because of the uniformity of this relationship, constant values for the slope and intercept were used for all leaves in the simulation studies.
Canopy assimilation
Simulated total assimilation of leaves in their native microsites was greater than for more than 99.5% of the simulated arrange-ments of leaves randomly assigned to microsites (Figure 7A). The total assimilation was > 98% of the maximum possible by any combination of the observed foliage in the microsites. Given the inevitability of error in both the light environment and foliage gas exchange measurements, the actual arrange-ment of leaves in microsites is probably indistinguishable from
the optimum arrangement of the observed leaves in the canopy sites.
When the broader problem of leaves of any N content is considered, however, the results are less clear (Figure 7B). The actual allocation of N in leaves in the microsites results in simulated integrated carbon gain that is greater than that from more than 99.5% of all trials where N is randomly allocated among the microsites (constrained to be > 80 and < 120% of the observed minimum and maximum leaf N contents). The total amount of assimilate produced with the actual pattern of Figure 4. Leaf saturated photosynthesis, Amax, (PPFD = 1000 µmol
m−2 s−1) and dark respiration, Rd, at 20 °C as a function of the foliage microsite light environment. Solid lines are linear regressions between the fraction of above-canopy PPFD, FPPFD, and Amax (Amax = 4.2 + 4.5FPPFD, r2 = 0.37, P < 0.05) and FPPFD and Rd (Rd = −0.2 − 0.7FPPFD, r2 = 0.36, P < 0.05).
Figure 5. Nothofagus leaf assimilation as a function of temperature (leaf--air vapor pressure difference < 1 kPa). The solid line is the modeled response.
Figure 6. Nothofagus stomatal conductance data plotted against Ahs/Cs.
N allocation is about 8.5% greater than the mean of simula-tions in which N is randomly allocated and about 6.5% greater than allocating an equal amount of N to all microsites.
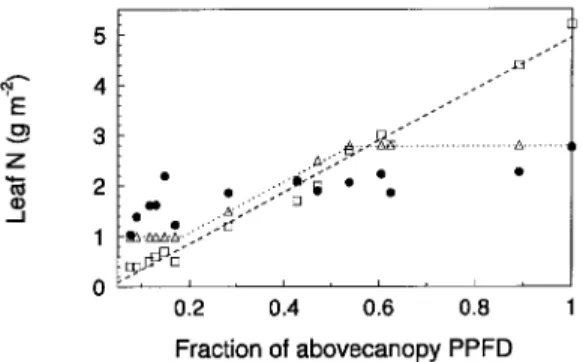
However, the simulated integrated canopy carbon gain for the observed canopy is about 5.5% less than that of a canopy where the total N is equivalent to that observed in the field and the N per leaf is allowed to vary across the observed range of values but allocated optimally (Figures 7B and 8). Removing the constraint that leaf N contents are limited to values ob-served in the field allows the unconstrained allocation pattern where ∂A/∂N is equivalent throughout the canopy. This pro-duces the allocation pattern where N content is approximately proportional to the fraction of PPFD received at each microsite (Figure 8). Canopy assimilation for this case is about 11% greater than for the observed canopy (Figure 7B). The simu-lated carbon gain of the observed canopy is thus about midway between canopies in which a fixed amount of N is allocated equally among all leaves or allocated so that ∂A/∂N is the same for all leaves.
Discussion
This and other studies (e.g., DeJong and Doyle 1985, Hollinger 1989, Vapaavuori and Vuorinen 1989, Leuning et al. 1991a, Ellsworth and Reich 1993) demonstrate that N is not allocated randomly within tree canopies. Simulations show that the observed patterns of N allocation result in a greater canopy carbon gain than patterns in which the same total quantity of N is allocated randomly or equally among microsites.
The present results, however, do not support the hypothesis that the distribution of canopy N maximizes instantaneous (or integrated) assimilation. There was less N in the brighter sites and more in the darker sites than is optimal according to the ∂A/∂N criterion. Similar results have recently been obtained from studies with herbaceous species (Evans 1993, Anten et al. 1995). There is undoubtedly a limit to allocation flexibility; tree canopies do not have a perfect ability to sense and compare light environments in different microsites and to translocate N accordingly. This is particularly true once a canopy has
devel-oped (but see Evans 1993). The shading experiments (Fig-ure 3), however, support a high degree of allocation flexibility, at least during leaf expansion.
A more likely reason why the canopy pattern of N allocation deviates from the ∂A/∂N optimality prediction is that the carb-on ‘‘cost’’ to nitrogen in this formulaticarb-on is implicitly either zero or scales linearly with N. A better optimality criterion would be to take N costs into account and calculate net assimi-lation after costs, ∂A/∂N −∂C/∂N, where ∂C/∂N is the partial derivative of the carbon cost with respect to N (Mooney and Gulmon 1979). These costs include the direct carbon costs of leaf construction and dark respiration as well as indirect costs associated with nutrient uptake and possible increased leaf losses with higher N. Mooney and Gulmon (1979) discuss the possibility of leaf herbivory increasing with higher leaf N and argue that leaf costs increase more than linearly with N. Under this alternate optimality criterion, any factors other than PPFD that affect leaf carbon gain or loss differently at different locations in the canopy will also influence the optimal distri-bution of N. This means factors such as sunflecks, photoinhibi-tion, and wind can have an effect similar to herbivory. For example, photoinhibition might reduce the assimilation of treetop foliage, and higher windspeeds may increase the prob-ability of loss of exposed leaves. The foliage most exposed to photoinhibition and wind is that with the most N at the top of the canopy, suggesting increased costs for high-N (exposed) leaves. In this instance, maximizing canopy photosynthesis by keeping ∂A/∂N −∂C/∂N constant would require less N in the most exposed sites (and more elsewhere) than the ∂A/∂N criterion. Thus, the result of including costs associated with both leaf properties and physical location is to reduce the slope of the relationship between FPPFD and leaf N, consistent with observation (Figure 8).
Conclusions
The pattern of N allocation in a canopy must be determined to model assimilation at the scale of the canopy, stand, or land-scape effectively. The first generation of canopy models (e.g., de Wit 1965, Duncan 1971) assumed a uniform distribution of N which may underestimate canopy assimilation by 5--10% if based on assimilation of foliage with an average N content. Sellers et al. (1992) used the rationale of optimizing canopy assimilation to propose a pattern where canopy N varied so that leaf N content was proportional to the fraction of above-can-opy PPFD reaching the foliage. The present study and other recent work (Evans 1993, Anten et al. 1995) suggest that this allocation pattern overestimates canopy assimilation by 5--10%. A better accounting of the costs associated with the acquisition of N and construction of the assimilatory system should lead to improved models of canopy N allocation. Be-cause a number of independent factors affect costs, such an analysis will be more difficult than that of determining the relationship between N and A.
In the meantime, modelers may wish to follow the pragmatic approach and allocate N as a linear function of the microsite PPFD:
N=FPPFD(Nmax−Nmin)+Nmin, (4)
where N is the nitrogen mass per unit foliage area at any location in the canopy, FPPFD is the fraction of the above-can-opy PPFD striking the foliage, Nmax is the maximum (top of canopy) N mass per unit foliage area and Nmin is the minimum (bottom of canopy) N mass per unit foliage area. For tree canopies with moderate to high LAI, present data (Hollinger 1989, Ellsworth and Reich 1993, this study) suggest about a 2.5-fold range between Nmin and Nmax.
Acknowledgments
I thank J. Hunt, T. McSeveny, and J. Byers for their expert assistance with the canopy and gas exchange measurements. Support for the field studies was provided by the New Zealand Department of Conserva-tion.
References
Anten, N.P.R., F. Schieving and M.J.A. Werger. 1995. Patterns of light and nitrogen distribution in relation to whole canopy carbon gain in C3 and C4 mono- and dicotyledonous species. Oecologia 101: 504--513.
Aphalo, P.J. and P.G. Jarvis. 1993. An analysis of Ball’s empirical model of stomatal conductance. Ann. Bot. 72:321--327.
Ball, J.T. 1988. An analysis of stomatal conductance. Ph.D. Thesis, Stanford University, Stanford, CA, USA, 89 p.
Ball, J.T., I.E. Woodrow and J.A. Berry. 1987. A model predicting stomatal conductance and its contribution to the control of photo-synthesis under different environmental conditions. In Progress in Photosynthesis Research. Ed. J. Biggens. Martinus Nijhoff Publish-ers, Dordrecht, The Netherlands, pp 221--224.
Berry, J. and G. Farquhar. 1978. The CO2 concentrating function of C4 photosynthesis. A biochemical model. In Proc. 4th Int. Congr. Photosynthesis, Reading, England. Eds. D. Hall, J. Coombs, and T. Goodwin. The Biochemical Society, London, pp 119--131. Björkman, O. 1968. Carboxydismutase activity in shade-adapted and
sun-adapted species of higher plants. Physiol. Plant. 21:1--10. Brooks, A., and G.D. Farquhar. 1985. Effect of temperature on the
CO2/O2 specificity of ribulose-1,5-bisphosphate carboxylase/oxy-genase and the rate of respiration in the light. Estimates from gas-exchange measurements on spinach. Planta 165:397--406. Chapin, F.S., III, A.J. Bloom, C.B. Field and R.H. Waring. 1987. Plant
responses to multiple environmental factors. BioScience 38:49--57. Collatz, G.J., J.T. Ball, C. Grivet and J.A. Berry. 1991. Physiological and environmental regulation of stomatal conductance, photosyn-thesis and transpiration: a model that includes a laminar boundary layer. Agric. For. Meteorol. 54:107--136.
DeJong, T.M. and J.F. Doyle. 1985. Seasonal relationships between leaf nitrogen content (photosynthetic capacity) and leaf canopy light exposure in peach (Prunus persica). Plant Cell Environ. 8:701--706.
Duncan, W.G. 1971. Leaf angles, leaf area, and canopy photosynthe-sis. Crop Sci. 11:482--485.
Ellsworth, D.S. and P.B. Reich. 1993. Canopy structure and vertical patterns of photosynthesis and related leaf traits in a deciduous forest. Oecologia 96:169--178.
Evans, J.R. 1989. Photosynthesis and nitrogen relationships in leaves of C3 plants. Oecologia 78:9--19.
Evans, J.R. 1993. Photosynthetic acclimation and nitrogen partition-ing within a lucern canopy. II. Stability through time and compari-son with a theoretical optimum. Aust. J. Plant Physiol. 20:69--82. Farquhar, G.D. and T.D. Sharkey. 1982. Stomatal conductance and
photosynthesis. Annu. Rev. Plant Physiol. 33:317--345.
Farquhar, G.D. and S. von Caemmerer. 1982. Modelling of photosyn-thetic response to environmental conditions. In Physiological Plant Ecology, Vol. 12B: Water Relations and Photosynthetic Productiv-ity. Eds. O.L. Lange, P.S. Nobel, C.B. Osmond and H. Ziegler. Springer-Verlag, New York, pp 549--587.
Farquhar, G.D., S. von Caemmerer and J.A. Berry. 1980. A biochemi-cal model of photosynthetic CO2 assimilation in leaves of C3 spe-cies. Planta 149:78--90.
Field, C. 1983. Allocating leaf nitrogen for the maximization of carbon gain: Leaf age as a control on the allocation program. Oecologia 56:341--347.
Field, C. 1991. Ecological scaling of carbon gain to stress and resource availability. In Response of Plants to Multiple Stresses. Eds. H.A. Mooney, W.E. Winner and E.J. Pell. Academic Press, New York, pp 35--65.
Field, C. and H.A. Mooney. 1986. The photosynthesis-nitrogen rela-tionship in wild plants. In On the Economy of Plant Form and Function. Ed. T.J. Givnish. Cambridge University Press, Cam-bridge, UK, pp 25--55.
Gutschick, V.P., M.H. Barron, D.A. Waechter and M.A. Wolf. 1985. Portable monitor for solar radiation that accumulates irradiance histograms from 32 leaf-mounted sensors. Agric. For. Meteorol. 33:281--290.
Harley, P.C., R.B. Thomas, J.F. Reynolds and B.R. Strain. 1992. Modelling photosynthesis of cotton grown in elevated CO2. Plant Cell Environ. 15:271--282.
Hirose, T. and M.J.A. Werger. 1987. Maximizing daily photosynthesis with respect to the leaf nitrogen pattern in the canopy. Oecologia 72:520--526.
Hirose, T., M.J.A. Werger and J.W.A. Rheenen. 1989. Canopy devel-opment and leaf nitrogen distribution in a stand of Carex acutifor-mis. Ecology 70:1610--1618.
Hollinger, D.Y. 1987. Photosynthesis and stomatal conductance pat-terns of two fern species from different forest understoreys. J. Ecol. 75:925--935.
Hollinger, D.Y. 1989. Canopy organization and foliage photosynthetic capacity in a broad-leaved evergreen montane forest. Funct. Ecol. 3:53--62.
Hollinger, D.Y. 1992. Leaf and simulated whole-canopy photosynthe-sis in two co-occuring tree species. Ecology 73:1--14.
Hollinger, D.Y., F.M. Kelliher, J.N. Byers, J.E. Hunt, T.M. McSeveny and P. L. Weir. 1994. Carbon dioxide exchange between an undis-turbed old-growth temperate forest and the atmosphere. Ecology 75:134--150.
Kelliher, F.M., B.M. Köstner, D.Y. Hollinger, J.N. Byers, J.E. Hunt, T.M. McSeveny, M. Meserth, P.L. Weir and E.-D. Schulze. 1992. Evaporation, xylem sap flow, and tree transpiration in a New Zea-land broad-leaved forest. Agric. For. Meteorol. 62:53--73. Kirschbaum, M.U.F., and G.D. Farquhar. 1984. Temperature
depend-ence of whole leaf photosynthesis in Eucalyptus pauciflora. Aust. J. Plant Physiol. 11:519--538.
Lemeur, R. 1973. A method for simulating the direct solar radiation regime in sunflower, Jerusalem artichoke, corn and soyabean cano-pies using actual stand data. Agric. Meteorol. 12: 229--247. Leuning, R. 1996. A critical appraisal of a combined
Leuning, R., R.N. Cromer and S. Rance. 1991a. Spatial distributions of foliar nitrogen and phosphorus in crowns of Eucalyptus grandis. Oecologia 88:504--510.
Leuning, R. Y.P. Wang and R.N. Cromer. 1991b. Model simulations of spatial distributions and daily totals of photosynthesis in Eucalyptus grandis canopies. Oecologia 88:494--503.
Mooney, H.A. and S.L. Gulmon. 1979. Environmental and evolution-ary constraints on photosynthetic characteristics of higher plants. In Topics in Plant Population Biology. Ed. O.T. Solbrig, S. Jain, G.B. Johnson and P.H. Raven. Columbia University Press, New York, pp 316--337.
Ross, J. 1981. The radiation regime and architecture of plant stands. Dr. Junk, The Hague, 381 p.
Sellers, P.J., J.A. Berry, G.J. Collatz, C.B. Field and F.G. Hall. 1992. Canopy reflectance, photosynthesis, and transpiration. III. A reana-lysis using improved leaf models and a new canopy integration scheme. Rem. Sens. Environ. 42:187--216.
Sharpe, P.S.H. and D.W. De Michelle. 1977. Reaction kinetics of poikilothermic development. J. Theor. Biol. 64:649--670.
Stewart, G.H., A.B. Rose, and T.T. Veblen. 1991. Forest development in canopy gaps in old-growth beech (Nothofagus) forests, N.Z. J. Veg. Sci. 2:679--690.
Vapaavuori, -E.M. and -A.H. Vuorinen. 1989. Seasonal variation in the photosynthetic capacity of a willow tree (Salix cv. Aquatica gigan-tea) canopy. 1. Changes in the activity and amount of ribulose 1,5-bisphosphate carboxylase-oxygenase and the content of nitro-gen and chlorophyll at different levels in the canopy. Tree Physiol. 5:423--444.
de Wit, C.T. 1965. Photosynthesis of leaf canopies. Agricultural Re-search Report No. 663, Centre Agric. Publications and Documenta-tion, Wageningen, 57 p.