Light penetration properties of NIR radiation in fruit with
respect to non-destructive quality assessment
Jeroen Lammertyn
a,*, Ann Peirs
a, Josse De Baerdemaeker
b, Bart Nicolaı¨
aaKatholieke Uni
6ersiteit Leu6en,Flanders Centre for Posthar6est Technology,Willem de Croylaan42,3001He6erlee,Belgium bKatholieke Uni
6ersiteit Leu6en,Department of Agrotechnique and-Economics,Kardinaal Mercierlaan92,3001He6erelee,Belgium Received 21 January 1999; accepted 11 October 1999
Abstract
Some issues related to the non-destructive measurement of apple quality attributes by means of NIR reflectance spectroscopy are addressed. A comparison was made between two optical configurations, which can be used to perform NIR-spectroscopic measurements: the bifurcated and the 0°/45° optical configuration. A relationship was established between the reflectance spectra (880 – 1650 nm) and the soluble solids content by means of the partial least squares technique. Depending on the data pre-processing method, correlation coefficients between 79 and 91% were obtained. The results obtained with the bifurcated fibre were only marginally better than those obtained with the 0°/45° configuration. The apple skin reflectance and skin transmission properties with regard to NIR radiation were also investigated. The intensity of the light source was high enough to penetrate through the apple skin and gather information about the apple parenchyma tissue. A method was developed to calculate the light penetration depth for each wavelength in the range from 500 to 1900 nm. This method was applied to measure the light penetration depth in ‘Jonagold’ apple fruit tissue. The penetration depth is wavelength dependent: up to 4 mm in the 700 – 900 nm range and between 2 and 3 mm in the 900 – 1900 nm range. © 2000 Elsevier Science B.V. All rights reserved.
Keywords:Quality; PLS; Light penetration; Sugar; Optical configuration; Apple
www.elsevier.com/locate/postharvbio
1. Introduction
In recent years research has been focused on the development of non-destructive techniques for
measuring quality attributes of apples such as pH, sugar content and firmness. The advantages of these techniques include fast execution, limited sample pre-processing and easy use in process control and grading systems. NIR-spectroscopy is one such technique, and NIR methods have al-ready been used to detect bruises on apples (e.g. Pen et al., 1985; Upchurch et al., 1994). Kawano et al. (1992) studied the sugar content in peaches
* Corresponding author. Tel.: +32-16-322376; fax: + 32-16-322955.
E-mail address: [email protected] (J. Lammertyn)
with an optical fibre in interactance mode. Slaughter (1995) determined that visible and NIR-spectroscopy could be used to measure non-de-structively the internal quality of peaches and nectarines as characterised by their soluble solid (SSC), sugar, sorbitol and chlorophyll contents. Bellon-Maurel (1992) used the wavelength region between 800 – 1050 nm to built a model for sugar measurement. Recently, Moons et al. (1997) and Lammertyn et al. (1998) established a relationship between NIR spectra and apple fruit quality parameters such as acidity, pH, sugar content and texture parameters.
For internal quality measurements, it is impor-tant that the NIR radiation penetrates the apple tissue sufficiently, an issue not often discussed in the literature. Chen and Nattuvetty (1980) investi-gated the effect of the distance between the light incident and detection points on the transmittance and on the depth through which the detected light penetrated into the fruit. Hother et al. (1995) followed the changes in reflectance properties of unpeeled apple disks of varying thickness. They found that, depending on the variety and the wavelength, the penetration depth varied between 0 and 7 mm. For ‘Jonagold’ apples, the maximum depth was 5.5 mm. However, the authors only considered a wavelength range between 480 and 800 nm. It should also be noted that, even if the radiation sufficiently penetrates the apple tissue, reflected radiation due to internal scattering needs to be separated from that due to specular reflec-tion. Several optical configurations have been used in the literature, including bifurcated light guides and 0°/45° configurations. It is not clear how the configuration affects the quality of the calibration models.
The objectives of this paper were (i) to compare two optical configurations for measuring internal apple quality attributes by means of NIR reflec-tance measurements, (ii) to obtain fruit skin parameters which describe the interaction of the skin and the incident radiation, and (iii) to deter-mine the penetration depth values of NIR radia-tion in apple tissue for the wavelengths between 500 and 1900 nm.
2. Materials and methods
2.1. Fruit
Apples (Malus domestica Borkh. cv. Elstar) used for the first experiment were purchased at a local auction and stored for 2 days at 20°C and 70% relative humidity to equilibrate. For the cali-bration models, 60 apples were used. From each apple, four spectra (880 – 1650 nm) with the bifur-cated and with the 0°/45°-configuration (see fur-ther) were taken at exactly the same position. The soluble solids content, which is strongly correlated with the sugar content, was measured at the same positions with a digital refractometer (PR-101 Palette Series, ATAGO CO., Ltd., Japan).
‘Jonagold’ apples, used for the light penetration experiments, were also purchased at a local auc-tion and measured after 2 days of equilibraauc-tion at 20°C and 70% relative humidity.
2.2. Reflectance measurements
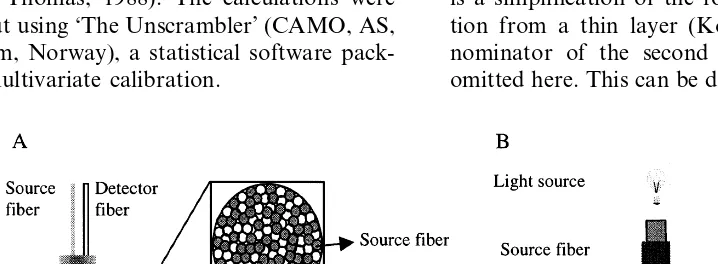
For each apple, four reflection spectra (880 – 1650 nm, wavelength increment 0.5 nm) were taken at four equidistant positions around the equator, with a spectrophotometer (Optical Spec-trum Analyser (OSA) 6602, Rees InsSpec-truments Ltd., Godalming, UK). The light source consisted of a 12 V/100 W tungsten halogen lamp (Philips 7724.M/28) that could be used both in the visible and near infrared region. Two different optical configurations were used. With the bifurcated op-tical configuration (type MIO-6134) the light is guided to the sample by source fibres, and from the sample with the detector fibres. In the head of the bifurcated cable, the source and detector fibres are situated randomly (Fig. 1(A)). The fibre has an active surface of 4 mm2
reflec-tion. Since the illuminated surface is larger, the intensity will be lower than with the bifurcated cable for a given light intensity. In both cases the reflected light is divided into individual wave-lengths by the diffracting gratings of the monochromator. Grating A is used for the wave-length range from 300 to 1080 nm and grating B for the range 1080 – 2000 nm. A silicon detector was used for the visible and the beginning of the near infrared range (300 – 1100 nm) and a PbS detector was used in the NIR range (1000 – 2000 nm). To compare both optical configurations the 0°/45° device was only used in the 880 – 1650 nm range. The signals were processed with software, model 6857 v1.30. The configuration was cali-brated with a He/Ne laser and a spectrum from a BaSO4-disc served as reference.
2.3. Measurement of internal apple quality
An average spectrum was calculated for each apple. The average spectra were pre-processed by reducing the number of points of measurement and taking the second derivative using the method of Savitzky – Golay (Savitzky and Golay, 1964). The second derivative or multiplicative scatter correction (MSC) was used to correct for additive and multiplicative effects in the spectra (Martens and Naes, 1989). The technique used for the calibration was partial least squares (PLS) (Haa-land and Thomas, 1988). The calculations were carried out using ‘The Unscrambler’ (CAMO, AS, Trondheim, Norway), a statistical software pack-age for multivariate calibration.
2.4. Skin reflectance and transmission properties
To obtain information about the light penetra-tion properties, an experiment based on earlier work of Lillesaeter (1982) was performed. Lille-saeter (1982) divided the information in a reflec-tance spectrum of a leaf into two components: information coming from the leaf and informa-tion coming from the background. In the present study the leaf surface was replaced by the skin of the apple and the background corresponded to the tissue under the skin.
The total reflected radiation (Rtot) consists of two components: the skin component, Rskin, which is the radiation reflected by the skin with a perfectly black background, and a background component, being the radiation reflected by a non-black background, changed by transmission through the skin. With the intensity of the inci-dent light beam and t, the transmission of the skin, the following formula can be derived:
Rtot=Rskin+Rback=rskinI+rbackt
2I (1)
with rskinand rbackthe reflectance of the skin and the background, respectively. The transmission parameter t is squared because the incident light crosses the skin twice before it is detected. Eq. (1) is a simplification of the formula for total reflec-tion from a thin layer (Kortu¨m, 1969). The de-nominator of the second term (1−rskinrback) is omitted here. This can be done whenrskinrback1.
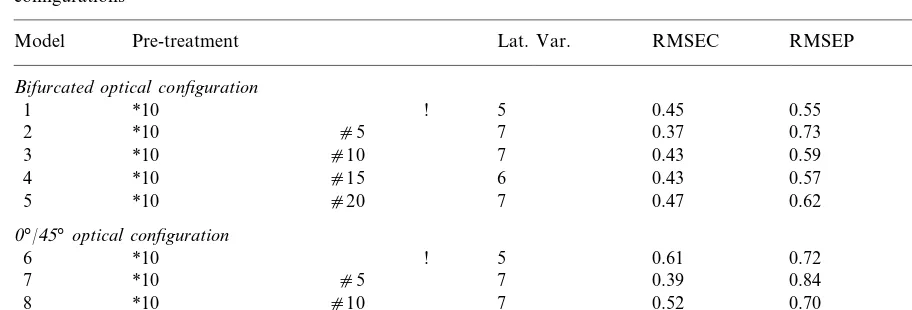
Table 1
Survey of the prediction performance of the different calibration SSC models for the bifurcated and the 0°/45° optical configurationsa
Lat. Var.
Model Pre-treatment RMSEC RMSEP Correlation
Bifurcated optical configuration
0°/45°optical configuration
!
a*xindicates the size (x) of the reduction of the original spectrum;cxdenotes the half of the interval (x) used for the calculation
of the second derivative using the method of Savitzky–Golay and ‘!’ indicates that multiplicative scatter correction (MSC) has been applied.
The total reflectance is defined as:
rtot= Rtot
I =rskin+rbackt 2
(2)
Two measurements with a different background (back1 and back2) are sufficient to solve the equa-tions in the skin parameterst and r
skin.
All the measurements for this test were exe-cuted with the spectrophotometer as described above using the 0°/45° optical configuration. For this test a piece of the red and the green side of the apple were used. The skin was carefully iso-lated from the fruit flesh with a razor blade and used for the measurements with the different backgrounds.
2.5. Penetration depth as a function of the wa6elength
calcu-lated for each thickness. For each wavelength and thickness the standard deviation was calculated based on the ten replications.
3. Results and discussion
3.1. Comparison of the optical configuration
In Table 1, a series of regression models is given for the prediction of the soluble solid content of ‘Elstar’ apples for both the bifurcated and the 0°/45° configurations. Choosing the best model is difficult, since it depends on a number of parame-ters: the root mean squared error of prediction and calibration (RMSEP and RMSEC), the dif-ference in explained y-variance between the cali-bration and the validation set, the difference between RMSEP and RMSEC, the correlation coefficient between the predicted and the mea-sured values, the number of latent variables, etc. (Lammertyn et al., 1998). Full cross validation is used to validate the models. RMSEP and RM-SEC are defined as follows:
RMSEP=
'
1Ip−1% Ip
i=1
(yˆi−yi−bias) 2
(7)
RMSEC=
'
1Ic−1% Ic
i=1 (yˆi−yi)
2 (8)
with yˆi=predicted value of the i-th observation; yi=measured value of thei-th observation; Ic= number of observations in the calibration set; Ip=number of observations in the validation set and
bias=1
Ip% Ip
i=1
(yˆi−yi).
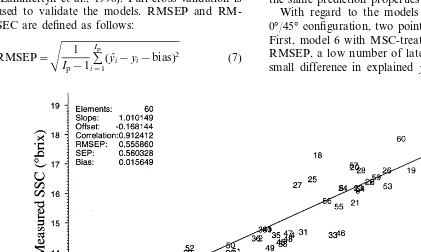
Amongst the different models based on spectra taken with the bifurcated optical fibre (Table 1), the model with MSC treatment has a low RMSEP value (0.55) and a small difference between RM-SEC and RMSEP. A large difference indicates that the calibration set does not represent the validation set. The correlation coefficient between measured and predicted values equals 0.91 (Fig. 2). Models based on data with other pre-treat-ments require one or two extra variables to reach the same prediction properties.
With regard to the models calculated for the 0°/45° configuration, two points should be noted. First, model 6 with MSC-treatment gives a good RMSEP, a low number of latent variables and a small difference in explained y-variance between
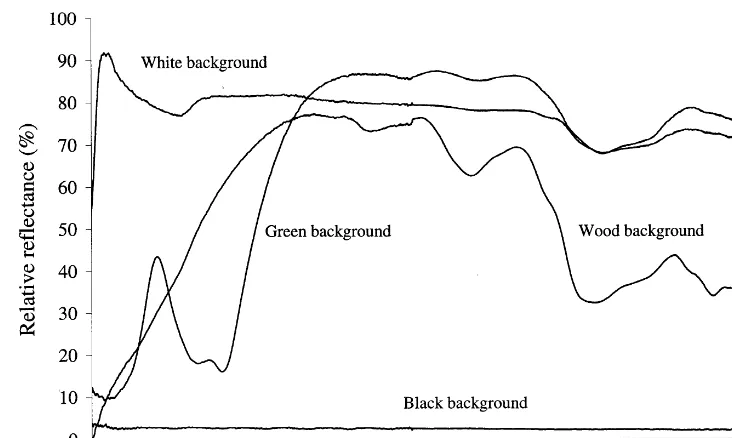
Fig. 3. Reflectance spectra of the different backgrounds.
calibration and validation set. However, models based on the second derivative of the spectra have, in general, low RMSEP and RMSEC values and a high correlation coefficient. The second point concerns the scree plot of the residual y -variance as a function of the model complexity. For the 0°/45° configuration, this plot is charac-terised by a sharp peak as the minimum, which makes it easy to choose the optimal number of latent variables. For the bifurcated fibre this plot has an exponential curvature. The choice of the number of variables is not so easy.
A calibration set of 60 apples is rather small, but since only 5 – 7 latent variables were used to construct the models, there are still ten times more samples than variables. This is in agreement with a statistical rule of thumb, which says that the ratio of the number of samples to the number of variables should be equal to or larger than 10. However, the purpose of this experiment was not to construct a general calibration model, but rather a comparison of two optical configurations. Despite the small number of calibration samples the results are comparable with those found in literature for the non-destructive measurement of the sugar content in apples. Bellon-Maurel (1992)
constructed a SSC-model with five latent variables and a correlation coefficient between predicted and measured SSC values of 0.84. Lammertyn et al. (1998) obtained correlation coefficients for SSC predictions between 0.8 and 0.9 depending on the data pre-treatment and the number of latent variables.
A comparison of the data in Table 1 reveals that the models based on measurements with the bifurcated cable are only marginally better than those based on measurements with the 0°/45° device.
3.2. Skin reflectance and transmission properties
These results were calculated based on the sim-plified equation for reflectance of a thin layer. Filling in the results obtained with the simplified equation in the extended equation, gives a mea-sure of the error made by simplifying the model. Depending on the wavelength and the back-ground, this simplification results in an error of 1 – 11%, which is acceptable.
com-pletely reflecting the incident radiation. The green background has a low reflection at 692 nm, which is the typical absorption wavelength for chloro-phyll. The white and the green background also shows water absorption bands at 1495 nm. The wood has in addition a high absorption at 1180 nm, another typical water absorption band.
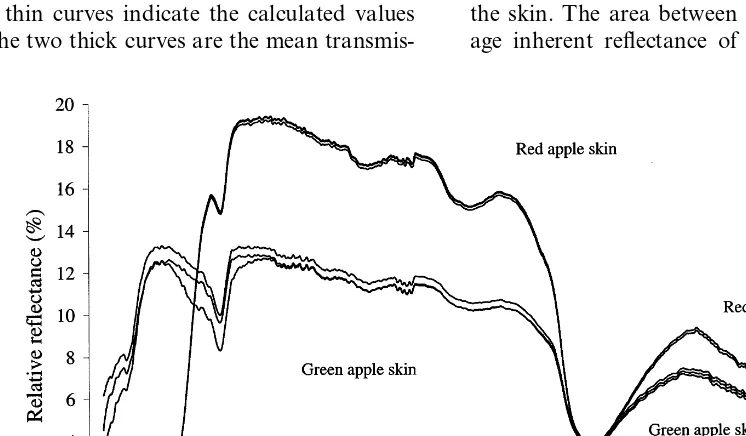
Fig. 4 shows the inherent skin reflectance,rskin, of a green and a red piece of apple skin as a function of the wavelength. For different combi-nations of two backgrounds (e.g. black and white, black and green, green and wood) the Eqs. (5) and (6) were solved to obtain the skin parameters, rskinandt. Therskinvalues obtained from different measurements fall close to each other for one colour of the skin. On average, the red skin gives higher inherent skin reflectance values than the green one in the NIR, but not in the visible spectrum. Also the chlorophyll absorption (692 nm) is higher for the green skin, since the red side of the apple has experienced more sunlight and has lower chlorophyll contents.
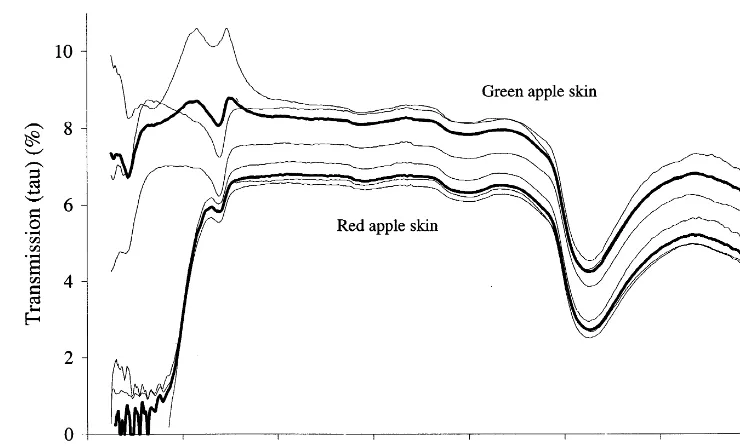
The transmission,t, is plotted as a function of the wavelength for green and red apple skin (Fig. 5). The thin curves indicate the calculated values fort. The two thick curves are the mean
transmis-sion curves. For the green apple skin, the mean transmission curve is strongly influenced in the colour range (400 – 700 nm). The mean t values for the two skin colours are almost equal. At first sight, the two means seem to be quite different, but taking only the NIR-range (800 – 2000 nm) into account,tfor the green skin is only a vertical translation compared to the red skin, which indi-cates that there is no large difference in transmis-sion properties of the red and the green skin. This additive effect is caused by light scattering (Williams and Norris, 1987) and can be corrected by MSC-correction techniques or by calculating a second derivative spectrum.
Fig. 6 shows the reflectance spectra for the red apple skin with white and black background. Since the reflectance of a black background is very small, the reflectance of the red apple skin has to be equal to the reflectance spectrum of the skin with the black background. This result also shows that background information can be found in a NIR-spectrum, since the spectrum is depen-dent of the background, and the fact thattdiffers from zero proves that light is penetrating through the skin. The area between the curve of the aver-age inherent reflectance of the red skin and the
Fig. 5. The transmission spectra (t2) of green and red apple skin.
Fig. 6. The influence of the background on the reflectance spectra of red apple skin.
reflectance spectrum of that skin with a certain background is an indicator of the amount of information coming from the background. Thus, it can be concluded that the amount of information
3.3.Penetration depth as function of the wa6elength
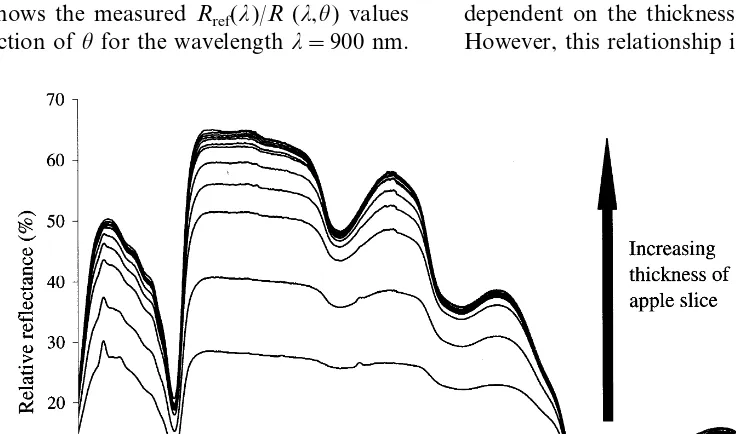
Fig. 7 shows the spectra of the apple slices with varying thickness. The spectra of the thinnest slices are situated at the bottom, indicating a low relative reflectance. Thin slices transmit more and thus reflect less radiation than thicker ones. The spectra on top represent the thicker slices. In the range from 500 to 1300 nm there is a clear difference between the spectra with different thickness. However, in the 1300 – 1900 nm range, the spectra are close. This will have its influence on the determination of the penetration depth in this region, as discussed later. On top of the spectra a converging tendency is noticed. The spectrum of the thickest slice is taken as a refer-ence spectrum (Rref(l)) to which the spectra of slices with thickness u, called R(l,u) are com-pared. ForRref,uequals 3.5 cm. This thickness is assumed not to transmit the incident light. This assumption is confirmed at the end of the experi-ment. For each wavelength l, the R
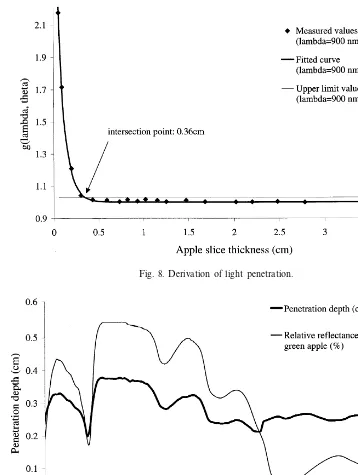
ref(l)/R(l,u) ratio is calculated as function of the thickness u. The ratio tends to 1 for increasing values of u. Fig. 8 shows the measuredRref(l)/R (l,u) values as a function ofufor the wavelengthl=900 nm.
In a next step, a non-linear model of the form
g(l,u)=1+a(l)·exp(−b(l),u) (9)
with a(l), b(l) parameters of the equation; g(l,u), the fitted value for the Rref(l)/R(l,u) ra-tio, andu, the thickness of the apple slice, is fitted to the measured points, using the least squares procedure in MATLAB, (The MathWorks Inc., Natick, MA). Theoretically, the intersection point of the fitted curve with the liney=1, corresponds to the penetration depth, of the wavelength under investigation, into the apple tissue. However, in practice, noise on the measurements should be taken into account. This is done by the construc-tion of an interval around 1. The variance of g(l,u)=Rref(l)/R(l,u) value is approximately equal to:
Var(g(l,u))
=(g¯(l,u))
2
(R( ref(l))2Var(Rref(l))+
(g¯(l,u))2
(R( (l,u))2Var(R(l,u)) (10)
The average values are based on ten replicate measurements. In practice the defined variance is dependent on the thickness, u, of the apple slice. However, this relationship is of minor importance
Fig. 8. Derivation of light penetration.
Fig. 9. NIR radiation penetration depth in ‘Jonagold apple’ (green side).
and hence neglected for reasons of simplicity. Since the probability density function ofg(l,u) is unknown it is not obvious how to construct confi-dence intervals. Therefore a value of 2.5 times the standard deviation was chosen to calculate the
is then defined as the value for which:
where n is number of slices with different thick-ness. Fig. 8 shows the upper limit for l=900 nm (thin full straight line).
The calculated penetration depths are pre-sented in Fig. 9. A maximum penetration depth of almost 4 mm was observed in the wavelength rangebetween 700 and 900 nm. A minimum of 2 mm was located around 692 nm. The chloro-phyll absorption peak is situated at this wave-length. Chlorophyll is a strong absorbing skin
component, explaining the low penetration
depth at this wavelength. For higher wave-lengths the penetration depth fluctuates between 2 and 3 mm.
As shown in Fig. 7, the relative reflectance values for wavelengths between 1400 and 1500 nm are low, since this is a very strong water absorption band in NIR-spectroscopy. Small in-evitable changes in water content (due to dry-ing) of the slices during the measurements can influence the g(l,u) value considerably in this wavelength region. This drying effect mainly ap-plies to relatively thin slices and not for thicker slices, since a thick slice dries less quickly. Dur-ing the experiments a small black box cover was used to prevent the slices from drying by air movement. Since all tests were performed over a short time period (20 min), the temperature was considered constant. But even then the signal-to-noise ratio in this region calculated as g(l,u)/
(var(g(l,u))) was up to 40 times smaller than in other regions. The ratio equalled 2.5 for the 1400 – 1500 nm wavelength ratio. This source of large error led us to discard the points in wave-length region between 1400 and 1500 nm for thin slices for the calculation of the penetration depth. These points influence the fit of the
model and thus the calculated penetration
depth. The calculated penetration depth as shown on Fig. 9 is in fact a conservative result, since a 99% pseudo-confidence interval was con-structed around 1 (Eq. (11)). A factor of 1.96 (95% pseudo-interval) would have given higher
penetration depths of NIR radiation into fruit tissue.
4. Conclusion
A comparison between the two optical
configurations suggested that the bifurcated opti-cal fibre gives only slightly better results for the prediction of sugar content than the 0°/45° configuration: for the same number of latent variables, the explained y-variance and the vali-dation correlation coefficient were higher for the bifurcated cable. However, the low cost, the possibility to measure without contact and the only slightly less satisfactory results compared to the bifurcated cable, make the 0°/45° configura-tion the best choice for commercial applicaconfigura-tions.
A NIR-spectrum, measured with a 0°/45° configuration, can provide information about the state of the fruit flesh. The background infl-uences the spectrum of the skin and the trans-mission coefficient differs from zero. The proportion of the skin reflectance to the trans-mission coefficient is an indicator for the amount of information coming from the back-ground compared to that coming from the skin.
Acknowledgements
The authors wish to thank the EU (FAIR project CT95-0302) and the Flemish Minister of Science and Technology for financial support. Bart Nicolaı¨ and Jeroen Lammertyn are Research Associate and Aspirant with the Flemish Fund of
Scientific Research (FWO Vlaanderen),
respectively.
References
Bellon-Maurel, V., 1992. Application de la spectroscopie proche infrarouge au controˆle en ligne de la qualite´ des fruits et le´gumes. The`se de doctorat, l’Institut National Polytechnique de Toulouse.
Chen, P., Nattuvetty, V.N., 1980. Light transmittance through a region of an intact fruit. Trans. Am. Soc. Ag. Eng. 23, 519 – 522.
Haaland, D.M., Thomas, E.V., 1988. Partial least squares methods for spectral analysis. 1. Relation to other quanti-tative calibration methods and the extraction of qualiquanti-tative information. Anal. Chem. 60, 1193 – 1202.
Hother, K., Herold, B., Geyer, M., 1995. Grenzen der Erken-nung von Qualita¨tsfehlern im Apfelgewebe bei Messung der spektralen Reflexion. Gartenbauwissenschaft 60, 162 – 166.
Kawano, S., Watanabe, H., Iwamoto, M., 1992. Determina-tion of sugar content in intact peaches by near infrared spectroscopy with fiber optics in interactance mode. J. Jap. Soc. Hortic. Sci. 61, 445 – 451.
Kortu¨m, G., 1969. Reflectance Spectroscopy. Springer-Verlag, New York.
Lammertyn, J., Nicolaı¨, B., Ooms, K., De Smedt, V., De Baerdemaeker, J., 1998. Non-destructive measurement of acidity, soluble solids, and firmness of Jonagold apples using NIR-spectroscopy. Trans. Am. Soc. Ag. Eng. 41, 1089 – 1094.
Lillesaeter, O., 1982. Spectral reflectance of partly transmitting leaves: laboratory measurements and mathematical model-ing. Remote Sensing Environ. 12, 247 – 254.
Martens, H., Naes, T., 1989. Multivariate Calibration. John Wiley and Sons, New York.
Moons, E., Dubois, A., Dardenne, P., Sindic, M., 1997. Non-destructive visible and NIR spectroscopy for the determi-nation of internal quality in apple. Proceedings from the Sensors for Non-destructive Testing International Confer-ence, Orlando, FL.
Pen, C.L., Bilanski, W.K., Fuzzen, D.R., 1985. Classification analysis of good and bruised peeled apple tissue using optical reflectance. Trans. Am. Soc. Ag. Eng. 28, 326 – 330. Savitzky, A., Golay, A.M.J., 1964. Smoothing and differentia-tion of data by simplified least squares procedures. Anal. Chem. 36, 1627 – 1639.
Slaughter, D., 1995. Non-destructive determination of internal quality in peaches and nectarines. Trans. Am. Soc. Ag. Eng. 38, 617 – 623.
Upchurch, B.L., Throop, J.A., Aneshansley, D.J., 1994. Influ-ence of time, bruise-type, and severity on near-infrared reflectance from apple surfaces for automatic bruise detec-tion. Trans. Am. Soc. Ag. Eng. 37, 1571 – 1575.
Williams, P.C., Norris, K.H., 1987. Qualitative applications of near-infrared reflectance spectroscopy. In: Williams, P.C., Norris, K.H. (Eds.), Near-Infrared Technology in the Agricultural and Food Industries. American Association of Cereal Chemists, Inc, St. Paul, MN.