www.elsevier.com / locate / livprodsci
The use of expeller copra meal in grower and finisher pig diets
*
J.V. O’Doherty , M.P. McKeon
Department of Animal Science and Production, Agriculture Building, University College Dublin, Belfield and Lyons Research Farm,
Newcastle, Co. Dublin, Ireland
Received 16 November 1998; received in revised form 3 September 1999; accepted 14 March 2000
Abstract
Two experiments were conducted to determine the nutritive value of copra meal for grower and finisher pigs (40–95 kg).
21
The apparent nutrient digestibility of copra meal, when included at 200 and 400 g kg in the diet of both the grower and finisher pig, was determined in experiment 1. In experiment 2, productive performance was determined in group fed pigs
21
(n5360) offered diets ad libitum containing a control diet (0 copra meal) (T1), 100 g copra meal kg (T2) and 200 g
21 21
copra meal kg (T3) formulated as a direct replacement for barley and 100 g copra meal kg (T4) and 200 g copra
21
meal kg (T5) formulated on a least cost basis. The control and least cost diets were formulated to have similar concentrations of digestible energy and ideal protein. There was a significant interaction in organic matter (OM), protein and energy digestibility between level of copra meal in the diet and age of pig (P,0.05). The pigs offered the 400 g copra
21
meal kg in the diet had a higher nutrient digestibility during the finisher stage than during the grower stage (P,0.001). However, age of pig had no effect on nutrient digestibility when the pigs were offered the control diet and the 200 g copra
21
meal kg diets. In experiment 2, there was a linear decrease (P,0.05) in feed intake as the level of copra meal in the diet increased. There was a significant interaction in growth rate between level of copra meal inclusion and method of formulation (P,0.01). As the level of copra meal increased in the least cost formulation, growth rate increased (P,0.05). As the level of copra meal increased in the barley substitution formulation, growth rate decreased (P,0.05). The inclusion
21 21
of 200 g copra meal kg in the diet decreased the kill out proportion compared to the control and 100 g copra meal kg
21
(P,0.01). In conclusion, 200 g copra meal kg can be used in the diet of grower–finisher pigs but its performance will depend on the method of formulation used. 2000 Elsevier Science B.V. All rights reserved.
Keywords: Pigs; Diet; Copra meal
1. Introduction the industry has few options available to it when these ingredients become expensive. To avoid this The Irish pig industry relies heavily on traditional problem, alternative cheaper ingredients such as feedstuffs such as wheat, barley and soya bean meal copra meal need to be researched. Copra meal is to formulate pig diets. Because of this dependence, produced by expeller extracting dried coconut ker-nels to remove the coconut oil (Butterworth and Fox, 1963). Copra meal is a variable commodity (Thorne
*Corresponding author. Tel.:1353-1-706-7128; fax:1
353-1-et al., 1990) and the variation in the nutrient content
706-1103.
E-mail address: [email protected] (J.V. O’Doherty). of copra meal is fundamentally a function of
21
ences in residual oil content. As a result of this, the copra), (T2) control diet (800 g kg ) plus 200 g
21 21
residual ingredient left is moderately high in oil copra meal kg and (T3) control diet (600 g kg )
21 21
(90–160 g kg ). plus 400 g copra meal kg . The copra meal used
Copra meal could make a significant contribution was a commercially produced expeller meal im-to the protein requirements of pigs with a crude ported from Indonesia and its chemical composition
21
protein content of around 200 g kg . However, is given in Table 1. Details of the digestibility diets Thorne et al. (1990) showed the amino acid balance are also shown in Table 1. The nutrient digestibility of copra meal protein to be far from ideal with lysine of the copra meal component was calculated by the being particularly deficient. Thorne et al. (1990) difference method using the control treatment (T1) stated that poor digestibility and an imbalance of as a basal diet and assuming that the remainder of essential amino acids in copra meal protein probably the diet was unchanged. When formulating the 200 g
21
result in copra meal contributing little more to the and 400 g copra meal kg diets, all ingredients pig’s protein requirement than do dietary cereals. present in the control diet were reduced by 20% and Thorne et al. (1988) found that there was a linear 40%, respectively in order to calculate the nutrient reduction in daily gain as the level of copra meal in digestibility of the copra meal component by the the diet increased. However, attention to the dietary difference method.
amino acid balance may improve performance. The pigs were randomly allocated to the three Thorne et al. (1992) maintained the ideal amino acid treatments and housed in metabolism cages fitted balance with the use of synthetic amino acids at with urine and faeces separators for the duration of different copra meal inclusion levels and found that two collection periods. The first collection period there was a linear reduction in daily gain as the level occurred during the grower stage (12–14 weeks of of copra meal in the diet increased from 0 to 200 age) while the second collection period occurred
21
g kg . However, it should be noted that this experi- during the finisher stage (16–18 weeks of age). The ment was conducted at 258C and this may have cages were located in an environmentally controlled affected feed intake especially when the pigs were room, maintained at a constant temperature of 248C fed high fibre diets. (61.58C). The trial consisted of an initial 10 days Copra meal is a potentially valuable source of acclimatisation period and a further 10 days during energy for grower and finisher pig diets. However, which feed intake and faeces output were recorded. with careful diet formulation copra meal may repre- Food was presented to each animal twice daily in the sent a cheap and valuable source of both dietary form of a pellet diet with water in the proportion 1:2 energy and protein for pigs. The current study was w / v and restricted to 0.90 of ad libitum intake in the designed to examine the effect of including copra acclimatisation period. Faeces were collected daily
21
meal in the diet at 100 and 200 g kg , formulated from each pig and were air-dried before being on either a least cost basis or as a direct substitute for weighed.
barley on the performance of pigs between 40 and 95
kg live weight housed at 188C. A further objective 2.2. Performance experiment was to estimate the nutrient digestibility of copra
meal when included in the diet of grower and The experiment was designed as a 2 (method of 21
finisher pigs at 200 and 400 g kg . formulation)32 (copra meal level) factorial plus the control diet. The pigs were offered diets containing either a control treatment (0 copra meal) (T1), 100 g
21 21
2. Materials and methods copra meal kg (T2) and 200 g copra meal kg (T3) formulated as a direct replacement for barley
21
2.1. Digestibility experiment and 100 g copra meal kg (T4) and 200 g copra
21
meal kg (T5) formulated on a least cost basis. Nine Landrace cross boars of 35 kg live weight Details of the experimental diets are shown in Table were used. The experiment was designed as a 3 2.
Table 1
Composition of the digestibility diets and analysed chemical composition of the copra meal and the digestibility diets
21
Copra meal Control Copra meal (g kg )
200 400
Neutral detergent fibre 493.0 158.1 239.7 336.7
Ether extract 93.0
21
Gross energy (MJ kg DM) 18.3 18.7 18.8 18.8
21
Lysine (g kg ) 4.8 – – –
ingredients (Ministry of Agriculture, Fisheries and The pigs were allowed 5 days to acclimatise Food, 1991) so as to contain similar concentrations before the experiment began. At the beginning of the of digestible energy (DE) (13.8 MJ DE) and ideal experiment each pig was individually weighed,
tag-21
protein (lysine 10 g kg ) (Close, 1994) with syn- ged and all pigs were balanced across treatments thetic amino acids added where necessary. In the according to live weight. All pens were weighed least cost formulation, wheat, molasses and soya oil after 28 days and again 33 days later. Pigs were were included equally. Copra meal replaced barley removed for slaughter when the average pen weight
21
directly at 100 and 200 g kg in the copra meal exceeded 95 kg. Growth measurements ended at first substituted barley diets. The diets were prepared in slaughtering but the pigs continued on their dietary 4.5 mm pellet form and delivered in individually treatment up to slaughter. Daily carcass gain was identified 25 kg paper bags. calculated by assuming a 65% kill out percentage for
The performance experiment was run over two the pigs at the start of the experiment as follows: periods. Two hundred and forty entire males
(progeny of Landrace3Large White sows) were (Carcass weight2(initial weight30.65)) /(num-used in the first phase (November–February) of the
ber of days) experiment while a replicate run (March–June) using
120 entire males of identical genotype were used in
the second phase. The pigs were penned in groups of Within 1 h of slaughter, the warm carcass was 2
twelve and were stocked at 0.84 m per pig. The weighed and subcutaneous back fat and eye muscle house was mechanically ventilated to provide an depth measurements were taken 6.5 cm from the ambient temperature of 188C. Each pen had a solid midline of the split back between the 3rd and 4th last floor lying area with access to slats at rear. In- ribs using a Hennessy grading probe. Lean meat dividual single space feeders with water nipples were proportion was estimated from the back fat and eye present in all pens providing an ad libitum supply of muscle depth measurements using the equation
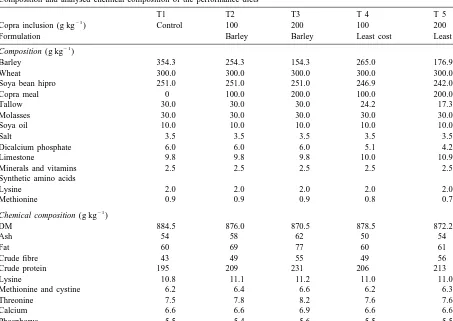
Table 2
Composition and analysed chemical composition of the performance diets
T1 T2 T3 T 4 T 5
21
Copra inclusion (g kg ) Control 100 200 100 200
Formulation Barley Barley Least cost Least cost
21
Composition (g kg )
Barley 354.3 254.3 154.3 265.0 176.9
Wheat 300.0 300.0 300.0 300.0 300.0
Soya bean hipro 251.0 251.0 251.0 246.9 242.0
Copra meal 0 100.0 200.0 100.0 200.0
Tallow 30.0 30.0 30.0 24.2 17.3
Molasses 30.0 30.0 30.0 30.0 30.0
Soya oil 10.0 10.0 10.0 10.0 10.0
Salt 3.5 3.5 3.5 3.5 3.5
Dicalcium phosphate 6.0 6.0 6.0 5.1 4.2
Limestone 9.8 9.8 9.8 10.0 10.9
Minerals and vitamins 2.5 2.5 2.5 2.5 2.5
Synthetic amino acids
Crude protein 195 209 231 206 213
Lysine 10.8 11.1 11.2 11.0 11.0
Methionine and cystine 6.2 6.4 6.6 6.2 6.3
Threonine 7.5 7.8 8.2 7.6 7.6
Calcium 6.6 6.6 6.9 6.6 6.6
Phosphorus 5.5 5.4 5.6 5.5 5.5
21 a
Digestible energy content (MJ kg ) 13.85 14.05 14.25 13.93 13.97
a
The DE content of the diets was calculated using the estimated DE content of the copra meal obtained from the digestibility experiment while the DE value for the remainder of the ingredients were obtained from official feeding tables (Ministry of Agriculture, Fisheries and Food, 1991).
21
Estimated lean meat proportion (g kg )5655.4 ash by burning in a furnace at 6008C for 4 h, crude protein by the macro-Kjeldahl method (Kjeldahl N3 213.4983probe fat (mm)10.177
6.25), neutral detergent fibre (NDF) content by the 2
3(probe fat, mm) 10.7193muscle depth (mm) method of Van Soest (1976), crude fibre by the Weende method (AOAC, 1980). Ether extract was
2.3. Chemical analysis determined using the 1043 Soxtec System HT6 as
derived from the Soxlet method. The amino acid The chemical analysis of dry matter, crude protein compositions of the diet were determined by the and ash were carried out according to the AOAC method of Iwaki et al. (1987).
(1980). The dry matter contents of the feeds and
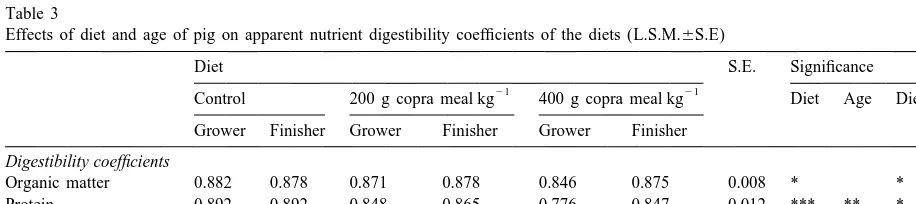
faeces were determined by oven drying at 558C for 2.4. Statistical analysis 72 h with forced air circulation. The dried
System [SAS, 1985] version 5.16). In the digestibili- Table 3. There was a significant interaction in ty experiment, the data was analysed as a 3 (diets)3 organic matter (OM), protein and energy digestibility 2 (age) factorial design. The model was partitioned between level of copra meal in the diet and age of into the main effects of diet, age of pig, pig effect pig (P,0.05). The pigs offered the 400 g copra
21
and the interaction of diet and age of pig. The meal kg in the diet had a significantly higher OM, individual pig served as the experimental unit. In the protein and energy digestibility (P,0.05) in the performance experiment, the overall effect of level finisher stage than in the grower stage. However, age of copra meal and method of formulation on pig of pig had no effect on nutrient digestibility when the 21 performance and carcass characteristics were ana- pigs were fed the control and 200 g copra meal kg lysed as a 232 factorial. In addition orthogonal diets. Pigs offered the control diet had a significantly contrasts were made between the control and the four lower fibre digestibility than pigs offered the 200 and
21
copra meal diets (T2, T3, T4 and T5), between the 400 g copra meal kg diets (P,0.05). 21
control and the 100 g copra meal kg diets (T2 and The nutrient digestibility coefficients and the DE T4) and between the control and the 200 g copra content of the copra meal component of the diet are
21
meal kg diets (T3 and T5). The kill-out, back fat presented in Table 4. There was a tendency for the and lean meat were adjusted for slaughter weight by digestibility of the OM, protein and energy and the covariance analysis. The individual pen served as the DE content of the copra meal to decrease as the level
experimental unit. of copra meal in the test diet increased.
3.2. Performance experiment
3. Results
Mean initial live weight was 39.9 kg (S.D.50.31) 3.1. Digestibility experiment with no difference between treatments. During the experiment, two pigs were removed from their The effects of diet and age of pig on apparent treatments (death and tail biting). The effect of nutrient digestibility coefficients are presented in dietary treatment on feed intake and DE intake is
Table 3
Effects of diet and age of pig on apparent nutrient digestibility coefficients of the diets (L.S.M.6S.E)
Diet S.E. Significance
21 21
Control 200 g copra meal kg 400 g copra meal kg Diet Age Diet3Age Grower Finisher Grower Finisher Grower Finisher
Digestibility coefficients
Organic matter 0.882 0.878 0.871 0.878 0.846 0.875 0.008 * *
Protein 0.892 0.892 0.848 0.865 0.776 0.847 0.012 *** ** *
Neutral detergent fibre 0.592 0.563 0.717 0.708 0.754 0.800 0.022 ***
Energy 0.878 0.874 0.868 0.876 0.843 0.870 0.006 * *
a
* P,0.05; ** P,0.01; *** P,0.001.
Table 4
21
Mean digestibility coefficients for organic matter, protein, energy and digestibile energy (DE) content (MJ kg DM) of copra meal
21
Copra meal (g kg ) Organic matter Protein Energy DE content
200 87.9 84.6 85.5 16.4
Table 5
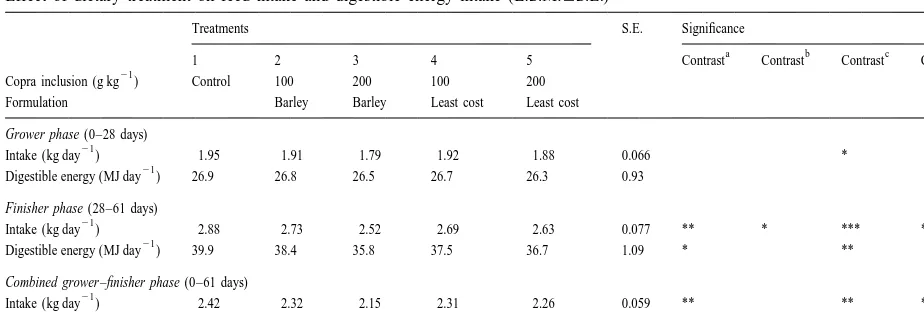
Effect of dietary treatment on feed intake and digestible energy intake (L.S.M.6S.E.)
Treatments S.E. Significance
a b c d
1 2 3 4 5 Contrast Contrast Contrast Contrast
21
Copra inclusion (g kg ) Control 100 200 100 200 Formulation Barley Barley Least cost Least cost
Grower phase (0–28 days)
21
Intake (kg day ) 1.95 1.91 1.79 1.92 1.88 0.066 *
21
Digestible energy (MJ day ) 26.9 26.8 26.5 26.7 26.3 0.93
Finisher phase (28–61 days)
21
Intake (kg day ) 2.88 2.73 2.52 2.69 2.63 0.077 ** * *** *
21
Digestible energy (MJ day ) 39.9 38.4 35.8 37.5 36.7 1.09 * **
Combined grower–finisher phase (0–61 days)
21
Intake (kg day ) 2.42 2.32 2.15 2.31 2.26 0.059 ** ** *
21
Digestible energy (MJ day ) 33.5 32.6 30.7 32.4 31.5 0.84 * *
a
Contrast between the control and the four diets (control vs. T2, T3, T4 and T5).
b 21
Contrast between the control and the 100 g copra meal kg diets (control vs. T2 and T4).
c 21
Contrast between the control and the 200 g copra meal kg diets (control vs. T3 and T5).
d 21 21
Contrast between the 100 g kg and the 200 g copra meal kg diets (T2 and T4 vs. T3 and T5). * P,0.05; ** P,0.01; *** P,0.001.
presented in Table 5 while the effect of treatment on had a higher DE intake than the pigs offered the 200 21
growth rate, feed and DE conversion ratios and live g copra meal kg in the diet during both the finisher weight is presented in Table 6. The DE content of period (P,0.01) and combined grower and finisher the diets was calculated using the estimated DE period (P,0.05).
content of the copra meal obtained from the di- There was a significant interaction (P,0.01) in gestibility experiment while the DE values for the growth rate between level of copra meal inclusion remainder of the ingredients were obtained from and method of formulation during the finisher and official feeding tables (Ministry of Agriculture, combined grower and finisher period. As the level of Fisheries and Food, 1991). copra meal in the diet increased in the least cost Experimental period had no effect on any variable formulation, growth rate increased (P,0.05). How-measured. The inclusion of copra meal in the diet ever, as the level of copra meal in the diet increased decreased feed intake during both the finisher period in the barley substitution formulation, growth rate (P,0.01) and the grower–finisher period (P,0.01) decreased (P,0.05). Pigs offered the control had a compared to the control diet. Pigs offered the control higher live weight gain (P,0.05) than the pigs
21
diet had a significantly higher feed intake than the offered the 200 g copra meal kg during the grower pigs offered the 100 g (P,0.05) and 200 g copra period. The pig live weights at the end of the grower
21 21
meal kg (P,0.001) in the diet during the finisher period were lighter for the pigs fed the 200 g kg 21
period. Pigs offered the 100 g copra meal kg had a copra meal in the diet (P,0.05) and this reflected higher intake than the pigs offered the 200 g copra the trends in growth rate.
21
meal kg in the diet (P,0.05) during both the The inclusion of copra meal in the diet improved finisher period and grower–finisher period. The food conversion ratio (FCR) during the finisher and inclusion of copra meal in the diet decreased DE combined grower–finisher periods (P,0.05) com-intake during the finisher period (P,0.05) and pared to the control diet. Pigs offered the 200 g
21
during the grower–finisher period (P,0.05) com- copra meal kg had a significantly better FCR than 21
Table 6
Effect of dietary treatment on pig performance (L.S.M.6S.E.)
Treatments S.E. Contrast
a b c d e
1 2 3 4 5 1 2 3 4 5
21
Copra inclusion (g kg ) Control 10 20 10 20
Formulation Barley Barley Least cost Least cost
Initial weight (kg) 40.0 40.1 39.5 39.6 40.2 0.85
Grower phase (0–28 days) 21
Live weight gain (kg day ) 0.824 0.833 0.781 0.799 0.809 0.025 *
21
Food conversion ratio (g g ) 2.47 2.39 2.43 2.50 2.49 0.081
21 f
DE conversion ratio (MJ kg ) 33.1 32.4 33.5 33.8 33.6 1.12
Live weight at 28 days 63.4 63.7 61.3 62.0 63.1 1.43 *
Finisher phase (28–61 days) 21
Live weight gain (kg day ) 0.940 0.929 0.899 0.916 0.980 0.026 **
21
Food conversion ratio (g g ) 2.77 2.75 2.55 2.67 2.47 0.071 * ** *
21 f
DE conversion ratio (MJ kg ) 42.4 42.3 40.1 41.0 38.4 1.08 * *
Live weight at 61 days 94.2 94.0 90.7 92.0 95.1 1.61
Combined grower –finisher phase (0–61 days) 21
Live weight gain (kg day ) 0.886 0.884 0.843 0.862 0.897 0.020 **
21
Food conversion ratio (g g ) 2.63 2.57 2.50 2.59 2.48 0.054 * *
21 f
DE conversion ratio (MJ kg ) 37.9 37.4 36.9 37.5 36.1 0.79 a
Contrast between the control and the four diets (control vs. T2, T3, T4 and T5).
b 21
Contrast between the control and the 100 g copra meal kg diets (control vs. T2 and T4).
c 21
Contrast between the control and the 200 g copra meal kg diets (control vs. T3 and T5).
d 21
Contrast between the 100 g and the 200 g copra meal kg diets (T2 and T4 vs. T3 and T5). e
Interaction between method of formulation and copra meal level.
f 21
DE conversion ratio: digestible energy conversion ratio (MJ kg live weight). * P,0.05; ** P,0.01; *** P,0.001.
(P,0.05) during the finisher period. Pigs fed the 200 depth. Pigs offered the control diet had a signifi-21
g copra meal kg also had a significantly better DE cantly better carcass average daily gain (P,0.05) conversion ratio than the control and 100 g copra than the pigs offered the copra meal diets. Carcass
21
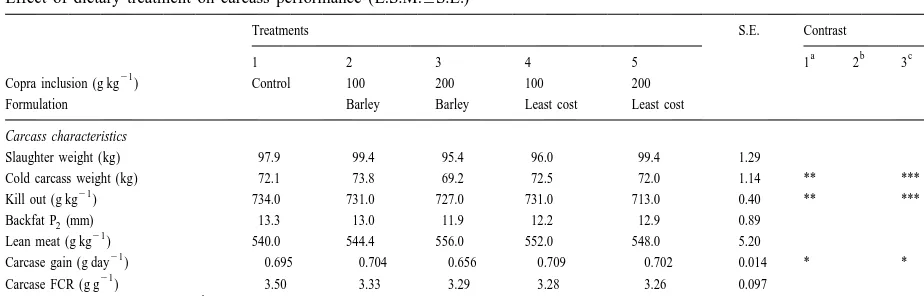
meal kg during the finisher period (P,0.05). FCR and carcass DE conversion ratio were unaffect-The effect of diet on carcass characteristics is ed by dietary treatment.
presented in Table 7. The inclusion of copra meal in the diet decreased carcass weight (P,0.01) and kill
out proportion (P,0.01). Pigs offered the control 4. Discussion
21
diet and the 100 g copra meal kg had significantly
higher carcass weight (P,0.01) and kill out propor- The OM, protein and energy digestibility coeffi-tion (P,0.001) than the pigs offered the 200 g copra cients decreased as the level of copra meal in the diet
21
Table 7
Effect of dietary treatment on carcass performance (L.S.M.6S.E.)
Treatments S.E. Contrast
a b c d
1 2 3 4 5 1 2 3 4
21
Copra inclusion (g kg ) Control 100 200 100 200
Formulation Barley Barley Least cost Least cost
Carcass characteristics
Slaughter weight (kg) 97.9 99.4 95.4 96.0 99.4 1.29
Cold carcass weight (kg) 72.1 73.8 69.2 72.5 72.0 1.14 ** *** **
21
Kill out (g kg ) 734.0 731.0 727.0 731.0 713.0 0.40 ** *** **
Backfat P (mm)2 13.3 13.0 11.9 12.2 12.9 0.89
21
Lean meat (g kg ) 540.0 544.4 556.0 552.0 548.0 5.20
21
Carcase gain (g day ) 0.695 0.704 0.656 0.709 0.702 0.014 * *
21
Carcase FCR (g g ) 3.50 3.33 3.29 3.28 3.26 0.097
21 e
Carcase DE conversion ratio (MJ kg ) 51.6 51.3 51.2 51.4 50.1 1.08
a
Contrast between the control and the four diets (control vs. T2, T3, T4 and T5).
b 21
Contrast between the control and the 100 g copra meal kg diets (control vs. T2 and T4).
c 21
Contrast between the control and the 200 g copra meal kg diets (control vs. T3 and T5).
d 21
Contrast between the 100 g and the 200 g copra meal kg diets (T2 and T4 vs. T3 and T5).
e 21
Carcass DE conversion ratio: Digestible energy per kg carcass (MJ kg carcass weight). * P,0.05; ** P,0.01; *** P,0.001.
enzymes to the cell contents (Bach-Knudsen et al., Thorne (1986) and Dore (1999) which had a residual 21
1993). Fibre has been observed to increase the oil content of 91 g kg similar to the oil content of 21
digesta rate of passage (Low, 1993) and this may the copra meal (93 g kg ) used in the current reduce the time available to the digestive enzymes to experiment.
act on the other substrates.
The current experiment shows that the nutrient 4.1. Performance experiment digestibility of the diets can vary with age and
bodyweight of the animals. However, this variation During the grower–finisher period, pigs offered in digestibility is ingredient related. The 400 g copra increasing levels of copra meal in the diet had lower
21
meal kg diet was digested better by the finisher pig intakes than the control fed pigs. This reduction in than the grower pig, probably due to a better intake may be due to the increasing level of energy developed hind gut fermentation. The depressive and fibre in the diet, both of which increase as the effect of fibre is more pronounced in growing pigs level of copra meal in the diet increases. Reductions than finishing pigs, particularly at high NDF content. in voluntary feed intake are often responses to Similar results were reported by Noblet et al. (1994) changes in dietary nutrient balance such as increased who stated that fibrous feeds were better digested by energy level (Cole et al., 1972; Cole and Chadd, older animals such as sows due to their better 1989) or imbalances in the dietary amino acid supply developed hind gut fermentation and lower feeding (Harper et al., 1970). Thorne et al. (1992) observed level relative to maintenance. Due to these factors, that increasing dietary copra meal decreased feed Noblet and Bourdon (1997) showed that the DE intake also. These authors attributed this to increased content of diets for sows was 4 MJ higher for high fibre in the diet hence reducing intake through its fibre by-products and 0.2–0.5 MJ for cereals than effect on gut fill. The reduced feed intake with copra when compared to younger pigs. meal inclusion could also be due to a high arginine The DE content of copra meal when estimated content (Thorne, 1986). There may also be a
21
using 200 g kg copra meal in the test diet was very palatability problem with high inclusion levels of 21
The pigs offered the control diet had a higher live and finisher periods. The digestibility experiment weight gain than the pigs offered the 200 g copra showed that as the level of copra meal in the diet
21
meal kg during the grower period. However, there increased, protein digestibility decreased. The de-was no difference in growth rate during the finisher crease in protein digestibility would have a greater period and live weight at the end of the experiment effect at lower feed intake, thereby decreasing pro-was similar for the control, 100 and 200 g copra tein availability and ultimately amino acid intake and
21
meal kg diets. This was surprising since Thorne et availability. If protein is below requirements, nitro-al. (1988) found that there was a linear reduction in gen deposition rate will be reduced (Rao and daily gain as the level of copra meal in the diet McCracken, 1991).
increased. However, in the current experiment, care- The increased fat content of this diet may also ful attention was given to the amino acid balance and hinder fibre digestibility. Kavanagh (1998) reported all least cost diets were formulated to an ideal lower digestibility of fibre in diets supplemented
protein (Close, 1994). with high levels of fat. There is evidence from
However, the daily live weight gain of the pigs ruminants that supplementary fat in the diet results in offered copra meal may have been over estimated. an inhibition of rumen microflora (Brooks et al., On a carcass basis the pigs fed the control diet had a 1954). It is possible that this may also apply to the better carcass daily gain than the pigs fed the 200 g large intestine of the pig. Bakker (1996) found that
21
copra meal kg . These pigs also had a higher adding animal fat to fibrous diets had a negative carcass weight and kill out proportion than the pigs effect on fermentation in the dietary tract of the pig. offered the copra meal diets. The lower kill out Fibre is one of the primary substrates fermented in
21
proportion of the 200 g copra meal kg fed pigs the large intestine (Varel, 1987) and Dierick et al. was due to the negative effect of the dietary fibre. (1989) suggest that volatile fatty acids make a small The low kill out proportion subsequently reduced but important contribution to the energy supply of
21
cold carcass weight in the 200 g copra meal kg fed the pig.
pigs. Fibre extends the gut thereby reducing the kill The control fed pigs had the worst FCR while 200 21
out proportion. This agrees with Jorgensen et al. g copra meal kg in the diet had the best FCR. The (1996) who stated that a high fibre diet would poorer FCR of the control fed pigs, especially during increase the length and weight of the intestinal tract. the finisher period is probably due to these pigs There was also a depression in growth rate in the having too high an ad libitum feed intake. Campbell
21
pigs offered the 200 g copra meal kg as a direct et al. (1985) found that the FCR improved with each replacement for barley. This decrease in growth rate increase in energy intake up to 33 MJ DE per day in may be due to a number of reasons These are similar live weight pigs. In the present experiment, decreased feed intake and excess fat and protein. there was a marked change in the effects of feeding 21 This depression in growth rate may be due to the rate on FCR when DE intake exceeded 35 MJ day .
21
lower feed intake with the 200 g copra meal kg The numerical tendency for an increase in backfat substituted barley diet. A number of studies have thickness observed with this diet is consistent with found that the pig will regulate voluntary intake the DE intake.
according to the energy density of the diet (Cole et The FCR may also be underestimated in the pigs 21
al., 1972; Cole and Chadd, 1989). In the 200 g copra fed the 200 g copra meal kg in the diet, as a result 21
meal kg substituted barley diet, feed intake de- of the increased gut fill which will influence live creased as the energy concentration of the diet weight gain. However, when efficiency was mea-increased. However, in terms of total daily energy sured in terms of the amount of the DE required per intake, compensation was not complete. The numeri- kg carcass, there was no difference in efficiency 21 cal tendency for a decline in backfat thickness between the control, 100 and 200 g copra meal kg observed with this diet is consistent with a reduction diets.
in DE intake. It can be concluded from the in vivo digestibility
diets. In: Cole, D.J.A. (Ed.), Pig Production. Butterworths,
meal is an excellent source of energy for pigs and the
London, pp. 243–257.
DE values obtained in this study are similar to other
Dierick, N.A., Vervaeke, I.J., Demeyer, D.I., Decuypere, J.A.,
previously quoted values. Careful consideration must 1989. Approach to the energetic importance of fibre digestion be given to inclusion of copra meal in pig diets. in pigs. I. Importance of fermentation in the overall energy Formulating diets on the basis of least cost favours supply. Anim. Feed Sci. Techol. 23, 141–167.
Department of Agriculture and Food, 1994. Pig carcass dressing
the inclusion of copra meal. The inclusion of copra
21 specification. DAF, Dublin, SI 216.
meal at 200 g kg as a replacement for barley
Dore, M.G., 1999. Studies related to in vivo and in vitro
lowers pig performance and should be avoided. The
digestibilities of pig feed ingredients. M.Agric.Sci. thesis,
21
inclusion of 200 g kg copra meal on the basis of National University of Ireland.
least cost does not affect performance but careful Harper, A.E., Benevenga, N.J., Wohlheuter, R.M., 1970. Effects of consideration must be given to intake and killing out ingestion of disproportionate amounts of amino acid levels.
Physiol. Rev. 50, 428–558.
proportion. High levels of copra meal should be
Iwaki, K., Nimura, N., Hiraga, Y., Kinoshita, T., Takeda, K.,
favourable for heavy pigs and sows.
Ogura, H., 1987. Amino acid analysis by reversed-phase high-performance liquid chromatography. J. Chromatogr. 407, 273– 279.
Acknowledgements Jorgensen, H., Zhao, X.Q., Eggum, B.O., 1996. The influence of dietary fibre and environmental temperature on the develop-ment of the gastrointestinal tract, digestibility, degree of
We are grateful to James Callan and Bernie Flynn
fermentation in the hind-gut and energy metabolism in pigs.
for assistance with laboratory analysis and to HKM Br. J. Nutr. 75, 365–378.
Milling Ltd. for financial assistance. Kavanagh, S., 1998. Studies on the nutritive value of feedstuffs for pigs. PhD thesis, National University of Ireland. Low, A.G., 1993. Role of dietary fibre in pig diets. In: Cole,
D.J.A., Haresign, W., Garnsworthy, P.C. (Eds.). Recent De-References velopments in Pig Nutrition, Vol. 2. Nottingham Press, London,
pp. 137–161.
AOAC, 1980. Official Methods of Analysis, 13th Edition. As- Ministry of Agriculture, Fisheries and Food, Fisheries and Food, sociation of Official Analytical Chemists, Washington, DC. 1991. The feeding-stuffs regulations 1991. Statutory instrument Bach-Knudsen, K.E., Jensen, B.B., Hansen, I., 1993. Digestion of no. 2840, 9.76. Her Majesty’s Stationary Office, London.
polysaccharides and other major components in the small and Noblet, J., Perez, J.M., 1993. Prediction of digestibility of large intestine of pigs fed on diets consisting of oat fractions nutrients and energy values of pig diets from chemical. J. rich in beta-D-glucan. Br. J. Nutr. 119, 879–886. Anim. Sci. 71, 3389–3398.
Bakker, G.C.M., 1996. Interaction between carbohydrates and fat Noblet, J., Bourdon, D., 1997. Valeur energetique comparee de in pigs. PhD thesis, Institute of Animal Science and Health onze matieres premieres chez le porc en croissance et la truie (ID-DLO), Department of Nutrition for Pigs and Poultry, P.O. adulte. J. Rech. Porc France 29, 221–226.
Box 65, 800 AB Lelystad, The Netherlands. Noblet, J., Shi, X.S., Dubois, S., 1994. Effect of body weight on Brooks, C.C., Garner, G.B., Gehrke, C.W., Muhrer, M.E., Pfander, net energy values of feeds for growing pigs. J. Anim. Sci. 72,
W.H., 1954. The effect of added fat on the digestion of 648–657.
cellulose and protein by ovine rumen organisms. J. Anim. Sci. Rao, D.S., McCracken, K.J., 1991. Effects of energy intake on 13, 758–764. protein and energy metabolism of boars of high genetic Butterworth, M.H., Fox, H.C., 1963. The effects of heat treatment potential for lean growth. Anim. Prod. 52, 499–507.
on the nutritive value of coconut meal, and the prediction of SAS, 1985. Statistical analysis systems. SAS Institute Inc., Cary, nutritive value by chemical methods. Br. J. Nutr. 17, 445–451. NC.
Campbell, R.G., Taverner, M.R., Curic, D.M., 1985. Effects of sex Thorne, P.J., 1986. The use of copra meal in pig diets. PhD thesis, and energy intake between 48 and 90 kg live weight on protein University of Nottingham.
deposition in growing pigs. Anim. Prod. 40, 497–503. Thorne, P.J., Wiseman, J., Cole, D.J.A., Machin, D.H., 1988. Use Close, W.H., 1994. Feeding new genotypes: establishing amino of diets containing copra meal for growing / finishing pigs and acid / energy requirements. In: Cole, D.J.A., Wiseman, J., their supplementation to improve animal performance. Trop. Varley, M.A. (Eds.), Principles of Pig Science. Nottingham Agric. Trinidad 65, 197–201.
Thorne, P.J., Wiseman, J., Cole, D.J.A., Machin, D.H., 1992. Van Soest, P.J., 1976. In: Swan, H., Lewis, D. (Eds.), Feed and Effects of level of inclusion of copra meal in balanced diets Energy Sources for Livestock. Butterworth, London. supplemented with synthetic amino acids on growth and fat Varel, V.H., 1987. Activity of fibre degrading microorganisms in deposition and composition in growing pigs fed ad libitum at a the pig large intestine. J. Anim. Sci. 65, 488–496.