www.elsevier.com / locate / livprodsci
The effects of microbial phytase, organic acids and their
interaction in diets for growing pigs
*
A.W. Jongbloed , Z. Mroz, R. van der Weij-Jongbloed, P.A. Kemme
IDTNO Animal Nutrition, P.O. Box 65, 8200 AB Lelystad, The Netherlands
Received 4 February 1999; received in revised form 1 October 1999; accepted 14 February 2000
Abstract
One hundred and ninety-two crossbred pigs from 22 to 45 kg BW were used to investigate the effects of Aspergillus niger phytase, organic acids, and their interaction, on animal performance, nutrient digestibility and urine composition. Pigs were housed in pens of six animals each, and had ad libitum access to the pelleted feed and water. A basal diet was either or not
21 21
supplemented with 410 phytase units kg , and with lactic acid (0, 16.0 and 32.0 g kg ) or formic acid (0, 8.0 and 16.0 g
21
kg ). The respective levels of lactic acid and formic acid were of the same acid equivalency. There were four replicates for the basal diet either or not supplemented with microbial phytase, and three replicates for the other treatments. The Ca and
21
digestible P contents of the basal diet were 6.0 and 1.0 g kg , respectively. The apparent total tract digestibilities of DM, OM, ash, Ca, Mg and P were calculated using Cr O as an indigestible marker. Osmolarity, pH, Ca, Mg, and P content were2 3
analysed in freshly voided urine. Microbial phytase very positively affected animal performance. Also, their daily gain and feed conversion ratio were significantly enhanced by the organic acids, but there was no synergistic effect. The apparent total tract digestibility of DM, ash, Ca and P were significantly enhanced by microbial phytase. Also, the apparent total tract digestibility of DM, OM, ash, Ca and P were significantly enhanced by the organic acids. A synergistic effect of organic acids and microbial phytase was found for ash, P and Mg digestibility. Formic acid and phytase increased digestible P
21
content by 0.20 g digestible P kg of diet. No differences in the effect due to the doses of supplemented organic acids were observed on animal performance, digestibilities and urine characteristics. Microbial phytase affected Ca and P content in urine, but had no effect on pH, osmolarity and Mg content. The acids had no effect on urine parameters. 2000 Elsevier Science B.V. All rights reserved.
Keywords: Pigs; Microbial phytase; Phosphorus; Organic acids; Digestibility
1. Introduction which is unavailable to the pig (Jongbloed, 1987).
During the last decade, numerous experiments have A total of 60 to 70% of P in plant ingredients, shown that microbial phytase can partly render commonly used in pig diets, is present as phytate P phytate P available to pigs (Cromwell et al., 1995;
¨
Dungelhoef and Rodehutscord, 1995; Jongbloed et al., 1996). Supplementation of phytase to pig diets
*Corresponding author. Tel.: 131-320-237-312; fax:131-320- 21
(.500 FTU kg ; activity of phytase is expressed
237-320.
E-mail address: [email protected] (A.W. Jongbloed). as FTU) usually results in the enhancement of the
digestibility of phytate-bound P up to 40% synergistic interactive effect with phytase. On the (Jongbloed et al., 1996). This implies that 60% of the other hand, Radcliffe et al. (1998) showed an phytate phosphorus is still unavailable. Jongbloed improved P digestibility by using 1.5 or 3.0% of (1987) reviewed that lowered intestinal pH increases citric acid, but no significant interaction was ob-the solubility of P and phytate and improves P served between microbial phytase and citric acid. absorption in the small intestine. In addition to their This lack of consistency in the conclusions implies a effect on intestinal pH, supplementary organic acids need for further research.
can also bind various cations along the intestine and Therefore, the objective of this study was to may act as chelating agents (Ravindran and Kor- investigate the effects of microbial phytase, organic negay, 1993), resulting in increased intestinal ab- acids at two doses, and their possible interactions on sorption of minerals (Table 1). However, there is a the apparent total tract digestibility of some nutrients scarcity of experimental data on synergistic effects of and performance of grower pigs.
microbial phytase in the presence of various acids. The efficacy of microbial phytase is found to be pH-dependent (Simons et al., 1990). The highest
activity was observed at two pH optima, i.e. 5.0 to 2. Materials and methods 5.5 and 2.5. Gastrointestinal acidity in pigs is not
always favorable for efficient hydrolysis of phytates 2.1. Animals and housing by phytases. Most pig diets have a pH between 6.0
and 7.0, which can be lowered by supplementation of The experiment was carried out, using 192 grow-organic acids, and may thus increase the efficacy of ing pigs ([Finnish Landrace3Dutch Landrace]3 microbial phytase. For example, Kemme et al. Cofok) of about 22 kg initial BW. Each pen with six (1999) showed that supplementation of a grower- pigs (three barrows1three gilts) was the experimen-finisher diet with 3% lactic acid not only had a tal unit. The pigs were housed for 5 weeks in positive effect on the absorbability of P, but also a farrowing pens of 1.631.8 m at an average ambient
Table 1
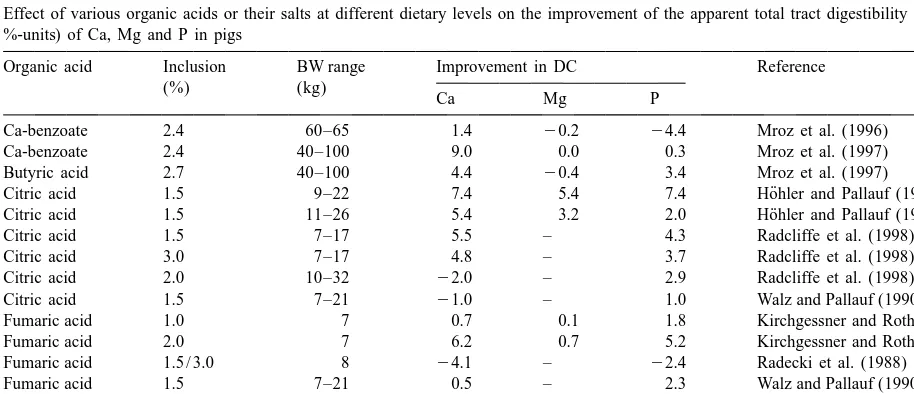
Effect of various organic acids or their salts at different dietary levels on the improvement of the apparent total tract digestibility (DC; in %-units) of Ca, Mg and P in pigs
Organic acid Inclusion BW range Improvement in DC Reference
(%) (kg)
Ca Mg P
Ca-benzoate 2.4 60–65 1.4 20.2 24.4 Mroz et al. (1996)
Ca-benzoate 2.4 40–100 9.0 0.0 0.3 Mroz et al. (1997)
Butyric acid 2.7 40–100 4.4 20.4 3.4 Mroz et al. (1997)
¨
Citric acid 1.5 9–22 7.4 5.4 7.4 Hohler and Pallauf (1993)
¨
Citric acid 1.5 11–26 5.4 3.2 2.0 Hohler and Pallauf (1994)
Citric acid 1.5 7–17 5.5 – 4.3 Radcliffe et al. (1998)
Citric acid 3.0 7–17 4.8 – 3.7 Radcliffe et al. (1998)
Citric acid 2.0 10–32 22.0 – 2.9 Radcliffe et al. (1998)
Citric acid 1.5 7–21 21.0 – 1.0 Walz and Pallauf (1990, 1991)
Fumaric acid 1.0 7 0.7 0.1 1.8 Kirchgessner and Roth (1980)
Fumaric acid 2.0 7 6.2 0.7 5.2 Kirchgessner and Roth (1980)
Fumaric acid 1.5 / 3.0 8 24.1 – 22.4 Radecki et al. (1988)
Fumaric acid 1.5 7–21 0.5 – 2.3 Walz and Pallauf (1990, 1991)
Fumaric acid 1.8 40–100 6.1 20.3 3.9 Mroz et al. (1997)
Lactic acid 3.0 37–95 7.9 1.6 2.7 Kemme et al. (1999)
21
temperature of 208C, providing no bedding. The pens formic acid and 16 g kg of lactic acid are usually were equipped with troughs and nipples for drinking applied in practice.
water. The animals were fed ad libitum, having free
access to water. 2.3. Formulation of the diets and feeding
The basal diet consisted of barley (30.0%), ex-2.2. Treatments and experimental design
tracted soybean meal (20.0%), maize (17.25%),
tapioca meal (10.0%), extracted sunflower seed meal The dietary factors microbial phytase (Natuphos ,
(5.38%), and extracted rapeseed meal (4.92%) as its Gist-brocades, Delft, The Netherlands) and organic
major components (Table 2). Chromic oxide (0.25 acids (lactic and formic acid, BASF, Ludwigshafen,
g / kg) was added as a marker according to the Germany) were investigated according to a
com-procedure described by Beers and Jongbloed pletely randomised block design. The animals in
(1992b). each of five blocks and pen had similar body weight
Concentrations of crude protein (CP; N36.25), and sex ratios. The pens within the blocks were
Ca and total P were aimed at |180, 6.0 and 4.2 g
allocated to the treatments at random and pen was
21
kg diet, respectively, on the basis of analysed the experimental unit. The experiment comprised 10
contents in the major ingredients. Phytate-P ac-treatments and there were four replicates per
treat-counted for about 75% of total P. Microbial phytase ment for the negative positive controls, and three
preparation (Natuphos ) was added at 550 FTU replicates for each of the other treatments (Table 2).
21
kg . Some characteristics of the basal diet not Lactic acid or formic acid were used (in doses of 0,
21
indicated in Table 2 were as follows: starch, 375 g 32 and 16, and 0, 16 and 8 g kg diet, respectively)
21 21
kg ; lysine, 10.3 g kg ; methionine1cystine, 6.5 in diets with or without microbial phytase (0 or 550
21 21
21
g kg and NE , 9.5 MJ kg (CVB, 1996). FTU kg diet). The respective levels of 32 and 16 g f
21
The organic acids were exchanged for equal kg lactic acid are of the same acid equivalency as
21
amounts of maize starch. Lactic and formic acid 16 and 8 g kg formic acid (equal to 284 and 142
21 21
were supplied in a liquid form at the concentration of meq kg , respectively). The doses of 8 g kg
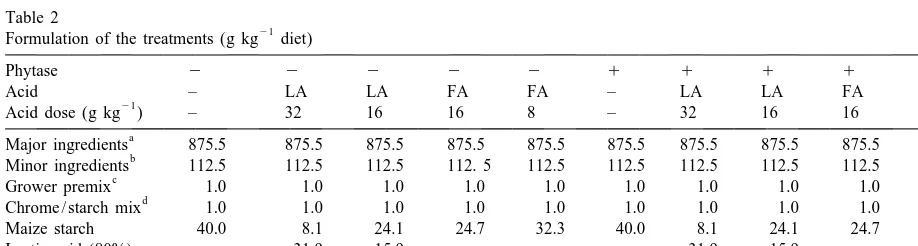
Table 2
21
Formulation of the treatments (g kg diet)
Phytase 2 2 2 2 2 1 1 1 1 1
Acid – LA LA FA FA – LA LA FA FA
21
Acid dose (g kg ) – 32 16 16 8 – 32 16 16 8
a
Major ingredients 875.5 875.5 875.5 875.5 875.5 875.5 875.5 875.5 875.5 875.5
b
Minor ingredients 112.5 112.5 112.5 112. 5 112.5 112.5 112.5 112.5 112.5 112.5
c
Grower premix 1.0 1.0 1.0 1.0 1.0 1.0 1.0 1.0 1.0 1.0
d
Chrome / starch mix 1.0 1.0 1.0 1.0 1.0 1.0 1.0 1.0 1.0 1.0
Maize starch 40.0 8.1 24.1 24.7 32.3 40.0 8.1 24.1 24.7 32.3
Lactic acid (80%) – 31.9 15.9 – – – 31.9 15.9 – –
Formic acid (85%) – – – 15.3 7.7 – – – 15.3 7.7
21
Natuphos (mg kg ) – – – – – 88 88 88 88 88
a
Barley (300), extracted soybean meal (200), maize (172.5), tapioca meal (100), extracted sunflower seed meal (53.8), extracted rapeseed meal (49.2).
b
Cane molasses (40.0), animal fat (26.7), limestone (10.7), salt (2.5), L-lysine.HCl (1.7),L-threonine (0.4),DL-methionine (0.2) and choline premix (0.3).
c 21
The grower premix provided (mg kg diet): vitamin A: 8000 IU, vitamin D3: 2000 IU, vitamin E: 15 IU, vitamin K3: 1.5, vitamin B1: 1.0, vitamin B2: 4.0,D-pantothenic acid: 12, niacin: 20, vitamin B12: 0.020, folic acid: 0.2, vitamin B6: 1.0, Fe: 100, Cu: 25, Zn: 50, Mn: 30, Co: 0.15, I: 0.75, Se: 0.3.
d
80% and 85%, respectively. The basal diet was made (Williams et al., 1962) in simple, whereas samples of first without mineral premix, acids and microbial urine were analysed for pH, osmolarity, Ca, Mg and phytase premix as one whole batch. Subsequently, all P. Organic acids were analysed by gas chromatog-experimental treatments were prepared with the raphy. Phytic-P content was analysed according to respective additives. All diets were cold pelleted Bos et al. (1993) and Cl, Cu, Zn, Na, K, in the (without steam; temperature not exceeding 508C) to control diets only. Crude fat (EG L 14 / 29-30 minimise possible inactivation of phytase and vol- Method B) and crude fibre (ISO / DP 6865 / NEN atilisation of the acids. Subsequently, the feeds were 5415) were analysed only in the control diets and the stored at 48C until use. diets with low acid dosage.
2.4. Collection procedure and measurements 2.6. Calculations and statistical analysis
Initial BW and final BW of each animal was Tabulated averages of phytase activity derive from recorded and feed intake was registered per pen. assays in the samples taken directly after pelleting Health status of the pigs was monitored permanently. and in the composite samples taken throughout the Directly after pelleting the diets, a composite trial. Acid dose was taken as the amount of mmol of sample of each treatment was taken and analysed for acid added to the diets. Performance was calculated the content of N, Ca, P, and phytase activity to check as the average per pen over the total period of 5 whether the assumed values from linear program- weeks.
ming were realised. Experimental data were subjected to (linear) multi-In the 4th and 5th week of the experiment ple regression analysis (Genstat 5 release 3.1; Payne composite samples of the diets were taken in dupli- et al., 1993). First, a best fit test was performed to cate and analyzed on phytase activity and organic find out if the data regressed linearly and to check if acids. In parallel, subsamples were air-dried. the different acids had the same blank (the controls). Besides, grab samples of faeces were collected for 2 This test showed that the lower and the higher dose consecutive days of the weeks 4 and 5 from each pen of these acids gave the same response. Results of the according to Beers and Jongbloed (1992b) and two doses within an acid were therefore pooled. frozen at 2208C. After the final collection period, Firstly, we tested significance of differences between the faeces from each collection week were thawed, digestibilities in weeks 4 and 5. Because there were homogenised, and subsamples were air-dried at 708C no meaningful differences, we calculated the average before analysis. Samples of fresh urine were ob- digestibility over weeks 4 and 5 per pen, and used tained from voluntarily urinating animals firstly into this for the regression model.
a glass beaker, measuring pH and osmolarity, and The following model was used: then transferred directly into a cumulative bottle with
Y 5m 1block 1phytase 1acid 1phytase 9% HCl to maintain pH below 3 until analysis. ijk i j k
3acidjk1e ,ijk (1)
2.5. Chemical analyses
where Yijk is an independent variable; m is the Barley and all experimental diets were analysed overall mean; block is the block effect (ii 51.5); for phytase activity before the trial started (Engelen phytase is the phytase effect ( jj 50, 1); acid is thek
et al., 1994). At that stage, the diets were also acid effect (k50, 1, 2); phytase3acidjk is the analysed for DM, ash, Ca, Mg, P, and organic acids interaction effect; eijk is the error distribution with
2
3. Results 3.2. Performance
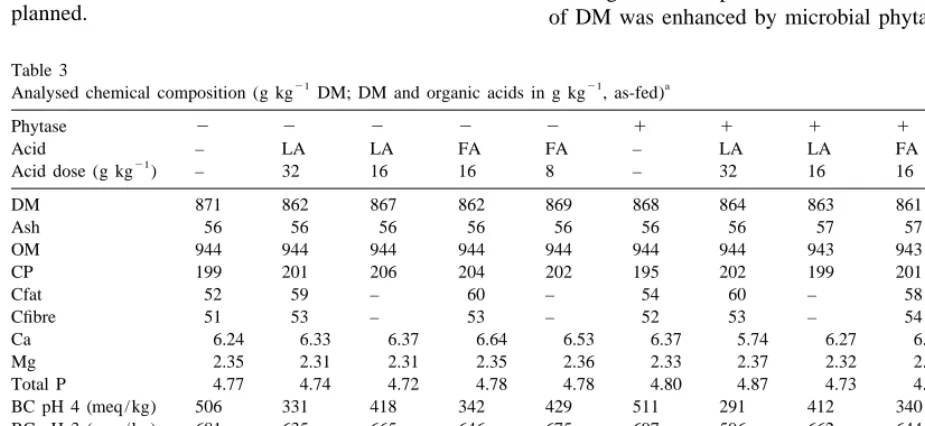
3.1. Chemical composition Throughout the trial no treatment-related health problems in pigs were observed. As the animals Contents of proximate nutrients and minerals were consumed far more feed than anticipated, we reduced very similar among the diets (Table 3), except for the number of pigs per pen in the last block from 6
21
the Ca content in the diet with 32 g kg lactic to 5. In Table 4 is presented the performance of pigs acid1microbial phytase, which was slightly lower over 5 weeks of this experiment. Average initial and than in the other diets. The average Na, K, Cu and final BW of the animals were 22 and 47 kg,
21
Zn contents were 1.3, 11.6 g kg and 36 and 88 mg respectively. Animal performance was very good,
21
kg DM, respectively. The barley had a phytase being affected by the treatments. Feed intake of pigs
21
activity of 330 FTU kg , resulting in low phytase receiving microbial phytase in their diets was higher activities in the diets without supplementary than of those without supplementary phytase (P5
21
Natuphos ranging between 138 and 181 FTU kg 0.04). Growth rate on the feeds with acids was
DM. In the Natuphos supplemented diets phytase higher, and especially when microbial phytase was
21
activity ranged from 549 to 648 FTU kg DM, added and also a very favourable feed conversion
21
being about 100 FTU kg lower than assumed. ratio (2.15) was obtained. Both microbial phytase Phytase activity in the phytase-supplemented diets and the acids had a positive effect on growth rate and with the highest dose of acid is slightly lower than at feed conversion ratio (P50.039). However, there the lower dose of the organic acid, being on average was no significant interaction of phytase and acids on
21
40 FTU kg . This is more or less within the these characteristics. accuracy of determination of phytase activity, being
21
50 FTU kg . Acidity of the diets ranged from 5.8 3.3. Apparent total tract digestibility pH-units in the basal diets to 4.7 pH-units in the diet
21
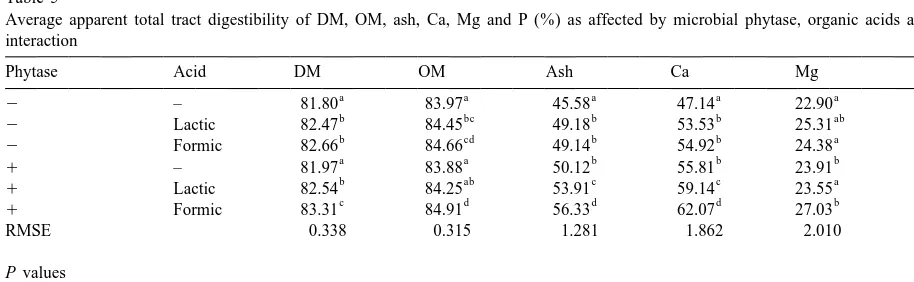
with supplementary lactic acid (32 g kg ). The Apparent total tract digestibility of DM, OM, ash, analysed amounts of lactic and formic acids were as Ca, Mg and P are presented in Table 5. Digestibility planned. of DM was enhanced by microbial phytase and acid
Table 3
21 21 a
Analysed chemical composition (g kg DM; DM and organic acids in g kg , as-fed)
Phytase 2 2 2 2 2 1 1 1 1 1
Acid – LA LA FA FA – LA LA FA FA
21
Acid dose (g kg ) – 32 16 16 8 – 32 16 16 8
DM 871 862 867 862 869 868 864 863 861 867
Ash 56 56 56 56 56 56 56 57 57 56
OM 944 944 944 944 944 944 944 943 943 944
CP 199 201 206 204 202 195 202 199 201 198
Cfat 52 59 – 60 – 54 60 – 58 –
Cfibre 51 53 – 53 – 52 53 – 54 –
Ca 6.24 6.33 6.37 6.64 6.53 6.37 5.74 6.27 6.27 6.61
Mg 2.35 2.31 2.31 2.35 2.36 2.33 2.37 2.32 2.29 2.38
Total P 4.77 4.74 4.72 4.78 4.78 4.80 4.87 4.73 4.73 4.79
BC pH 4 (meq / kg) 506 331 418 342 429 511 291 412 340 420
BC pH 3 (meq / kg) 681 635 665 646 675 697 596 662 644 667
IP-P 2.95 – – – – 3.02 – – – –
Phytase act. (FTU) 181 145 181 138 142 642 549 584 552 594
Lactic acid (100%) – 23.0 11.6 – – – 22.7 12.3 – –
Formic acid (100%) – – – 11.4 5.3 – – – 11.3 5.2
mmol acid – 256 129 247 115 – 252 137 246 112
pH 5.8 4.8 5.2 4.9 5.3 5.8 4.7 5.2 4.9 5.3
a
Table 4
21 21 21 21 21
Feed intake (kg animal day ), gain (g animal day ) and average feed conversion ratio (kg feed kg daily gain) as affected by microbial phytase, organic acids and their interaction
Phytase Acid Intake Gain Feed conversion ratio
a a a
2 – l.690 691 2.46
ab b ab
2 Lactic 1.769 758 2.34
a b bc
2 Formic 1.736 758 2.29
ab b bcd
1 – 1.743 772 2.28
ab c cd
1 Lactic 1.792 836 2.15
b c d
1 Formic 1.861 874 2.14
RMSE 0.130 32.9 0.118
P values
Phytase 0.040 ,0.001 ,0.001
Acids 0.171 ,0.001 0.039
Phytase3acid 0.376 0.332 0.941
abcd
Within a column, values with different superscripts are significantly different at P,0.05; RMSE, root mean square error;
]
Œ
S.E.M.5RMSE / n, where n58 for no acid means and n56 for acid means.
(P50.015 and ,0.001, respectively), although the expected, microbial phytase exerted a large effect on effect of microbial phytase was limited. Also, ash the apparent digestibility of total P (P,0.001), digestibility was enhanced by microbial phytase and which was equal to 16%-units or 0.69 g of digestible
21
the acids (P,0.001) and both factors interacted P kg of feed. These acids also had a positive effect meaningfully (P50.046). Digestibility of Ca was on digestibility of P (4.9%-units). Moreover, there affected by both microbial phytase and acids (P, was a significant interaction between phytase and 0.001). No main effect of microbial phytase on Mg acids (P50.01). The formic acid in combination digestibility could be found, whereas the organic with microbial phytase showed a further positive acids tended to enhance its digestibility. Further- effect equal to almost 5%-units. For all digestibilities more, there was a significant interaction between that were measured, formic acid in combination with phytase and acids on Mg digestibility (P50.042). As microbial phytase resulted in the highest values.
Table 5
Average apparent total tract digestibility of DM, OM, ash, Ca, Mg and P (%) as affected by microbial phytase, organic acids and their interaction
Phytase Acid DM OM Ash Ca Mg P
a a a a a a
2 – 81.80 83.97 45.58 47.14 22.90 25.00
b bc b b ab b
2 Lactic 82.47 84.45 49.18 53.53 25.31 29.87
b cd b b a b
2 Formic 82.66 84.66 49.14 54.92 24.38 29.87
a a b b b c
1 – 81.97 83.88 50.12 55.81 23.91 41.48
b ab c c a d
1 Lactic 82.54 84.25 53.91 59.14 23.55 45.71
c d d d b e
1 Formic 83.31 84.91 56.33 62.07 27.03 51.27
RMSE 0.338 0.315 1.281 1.862 2.010 2.171
P values
Phytase 0.015 0.988 ,0.001 ,0.001 0.419 ,0.001
Acid ,0.001 ,0.001 ,0.001 ,0.001 0.068 ,0.001
Phytase3acid 0.113 0.211 0.046 0.217 0.042 0.010
abcd
Within a column, values with different superscripts are significantly different at P,0.05. RMSE, root mean square error;
]
Œ
Table 6
21 21
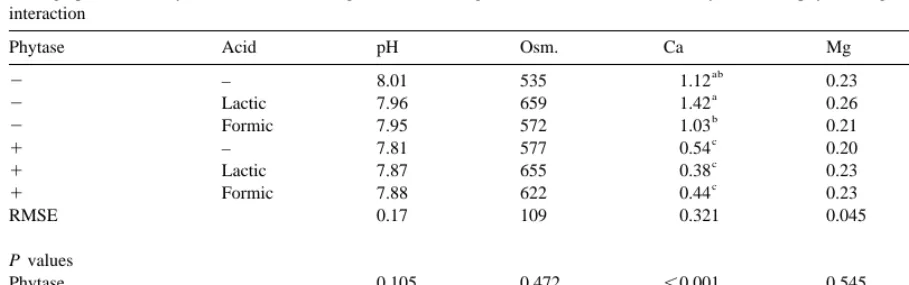
Average pH, osmolarity (mosmol l ), Ca, Mg and P content (g l ) in the urine as affected by microbial phytase, organic acids and their interaction
Phytase Acid pH Osm. Ca Mg P
ab ab
2 – 8.01 535 1.12 0.23 0.0073
a ab
2 Lactic 7.96 659 1.42 0.26 0.0069
b a
2 Formic 7.95 572 1.03 0.21 0.0058
c b
1 – 7.81 577 0.54 0.20 0.0166
c ab
1 Lactic 7.87 655 0.38 0.23 0.0142
c ab
1 Formic 7.88 622 0.44 0.23 0.0109
RMSE 0.17 109 0.321 0.045 0.0100
P values
Phytase 0.105 0.472 ,0.001 0.545 0.018
Acids 0.999 0.152 0.452 0.452 0.654
Phytase3acids 0.755 0.810 0.173 0.173 0.851
abcd
Within a column, values with different superscripts are significantly different at P,0.05. RMSE, root mean square error;
]
Œ
S.E.M.5RMSE / n, where n58 for no acid means and n56 for acid means.
formance of the pigs is therefore predominantly due 3.4. Characteristics of urine
to the higher feed intake, although also positive effects have been noted by microbial phytase even The urinary pH, osmolarity and Mg content were
when the pigs are fed above their P requirement similar, irrespective of supplementary acid or
(Jongbloed et al., 1996). phytase doses (Table 6). No effect of these organic
Also, the supplementary organic acids had a acids on urinary pH was expected because these
positive effect on performance of the pigs in the diets acids are known to be metabolised in the liver for
with and without microbial phytase. This enhanced various metabolic processes. The concentration of Ca
response is reported in numerous publications as in the urine was reduced by microbial phytase (P,
reviewed by Partanen and Mroz (1999), although the 0.001) because the deficit of digestible P in the
effect in our experiment is confounded with a higher metabolic pool was much lower (Jongbloed, 1987;
supply of digestible P (on average 0.2 g / kg). Also, Mroz et al., 1993). Microbial phytase increased
Radcliffe et al. (1998) reported a better performance significantly the P concentration in the urine.
How-of pigs fed diets with 1.5 to 3.0% citric acid at ever, concentrations are very low, which means that
digestible P levels below requirement. It is generally the animals on all treatments were still fed below
assumed that the response of pigs to organic acids their P requirement.
declines with increasing age of the animal and development of gastric secretion (Kirchgessner and Roth, 1980, 1982; Easter, 1988), but for the category 4. Discussion
of pigs we used, the positive effect of organic acids on performance is still quantitatively important. 4.1. Effect on performance
4.2. Apparent total tract digestibility of DM and The addition of microbial phytase in this
experi-OM ment resulted in an increase from 1.0 to 1.7 g of
21
digestible P kg diet, and had a substantial positive
Digestibility of DM was significantly enhanced by effect on feed intake, daily gain and feed conversion
microbial phytase (10.30%-units) and acid ratio. This has been documented for all experiments
(10.86%-units), but no interactions could be demon-with supplementary microbial phytase to diets demon-with a
strated. Jongbloed et al. (1996) surveyed data from supply of digestible P below the requirement of the
per-station and found that microbial phytase enhanced generated digestible Ca to generated digestible P in the digestibility of DM by 0.5460.81%-units. This diets with constant Ca content, Jongbloed et al. was significantly different from zero. The positive (1996) concluded from 12 experiments performed at effect on DM digestibility is to a large extent their own experimental station that this ratio was attributed to phytase’s positive effect on ash di- 0.5560.19. In the current experiment this ratio was gestibility, because no effect of microbial phytase on 0.39 / 0.6950.56, which is equal to a mean value OM digestibility could be demonstrated. This is in found from those experiments. However, the mean line with the literature data compiled by Jongbloed et ratio from data compiled by Jongbloed et al. (1996) al. (1996) from outside of his experimental station, outside of their own experimental station was higher, where the effect of microbial phytase in nine experi- i.e. 0.8460.38. Maybe, the higher Ca concentrations ments was 0.3360.72%-units, which is not signifi- in these diets can explain the higher ratio (Mroz et cantly different from zero. In this study the organic al., 1993).
21
acids significantly enhanced the total tract digestibili- As expected, microbial phytase (410 FTU kg ) ty of DM (10.86%-units) and OM (10.64%-units) increased the apparent digestibility of P
(16.5%-21
significantly. Since maize starch (estimated DM units) which is equal to 0.69 g of digestible P kg digestibility equals 100%) was exchanged by these of diet. This value fits fairly well with the dose– acids in the diets, the positive effect of the acids is response curve developed by Beers and Jongbloed
21
even slightly underestimated. Gabert and Sauer (1992a), where 500 FTU kg generated 0.80 g (1994) reviewed that supplementing diets for weanl- digestible P. In the diets without microbial phytase, ing pigs with organic acids increased nutrient and both organic acids had a positive effect on the energy digestibilities up to 4%-units. For growing digestibility of P, which was 4.9%-units and equal to
21
pigs (20 to 40 kg), Partanen and Mroz (1999) 0.2 g digestible P kg . However, there was a reported improvements of digestibility of nutrients, significant interaction between phytase and acids, in particular on protein and energy, which seems to which showed to be synergistic. The formic acid, but depend on the type and level of acid applied. The not lactic acid, in combination with microbial improvement in digestibility they observed in grow- phytase showed a further positive effect equal to ing pigs by the addition of organic acids was 4.9%-units. Also, Kemme et al. (1999) reported that 1.0161.07 and 0.9460.54%-units, respectively (n5 in pigs fed a maize–soybean meal diet a synergistic 8). The improved performance and digestibility as effect of lactic acid and microbial phytase was affected by organic acids may be due to (1) lowered found, being equal to 8.1%-units or 0.24 g digestible
21
pH resulting in a higher dissociation of the mineral P kg . Although Radcliffe et al. (1998) could not compounds, (2) reduced rate of gastric emptying, (3) show a significant interaction between microbial formation of chelated mineral complexes, that are phytase and citric acid, a numerical increase in the easily absorbed, and (4) improved gut health of the digestibility of P was found in the diets with animals because some are effective antimicrobials microbial phytase and citric acid. The difference in (Kirchgessner and Roth, 1982; Ravindran and Kor- effects of lactic acid and formic acid in combination negay, 1993; Partanen and Mroz, 1999). with microbial phytase between this experiment and of Kemme et al. (1999) needs to be further clarified.
21
4.3. Apparent total tract digestibility of Ca and P The dose of 32 g kg lactic acid, however, had the same acid equivalency as the 30 g / kg lactic acid in In this experiment, no interaction was observed the experiment of Kemme et al. (1999) due to water between microbial phytase and organic acid on the inclusion in the current preparation. So far, we digestibility of Ca. Microbial phytase and the organic cannot exclude that this difference may derive from acids enhanced the digestibility of Ca by 7.2 and the fact that lactic acid in the current experiment was 5.9%-units, respectively. This increase is equal to inD-lactic acid, whereasL-lactic acid was applied in
21
Bos, K.D., Jetten, J., Schreuder, H.A.W., Venekamp, J.C., 1993.
literature about the impact of stereoisomerism of
Enzymatische bepaling van inositolfosfaat in
veevoedergrond-lactic acid on digestion and performance on pigs.
stoffen. In: Rapport TNO-Voeding nr. B 93.105.
The experiments showed that the positive effect of Cromwell, G.L., Coffey, R.D., Parker, G.R., Monegue, H.J., the organic acids on the digestibility of Ca and P was Randolph, J.H., 1995. Efficacy of a recombinant-derived phytase in improving the bioavailability of phosphorus in
similar at both supplementation levels. An open
corn–soybean meal diets for pigs. J. Anim. Sci. 73, 2000–
question still remains at what level of
supple-2008.
21
mentation of organic acids below 8.0 g kg , as used CVB, 1996. Verkorte tabel. Voedemormen landbouwhuisdieren en in this study, equally enhanced response to digestion voederwaarde veevoeders. In: CVB-reeks nr. 20. Centraal
Veevoederbureau, Lelystad, The Netherlands.
and growth will be maintained.
¨
Dungelhoef, M., Rodehutscord, M., 1995. Effects of phytase on
¨ ¨
the digestibility of phosphorus in pigs. Ubers. Tierernahrg. 23, 133–157.
Easter, R., 1988. Acidification of diets for pigs. In: Haresign, W.,
5. Conclusions
Cole, D.J.A. (Eds.), Recent Advances in Animal Nutrition, pp. 61–71.
At supply of digestible P below the requirement of Engelen, A.J., v.d. Heeft, F., Ransdorp, H.G., Smit, E.L.C., 1994.
the pig, microbial phytase added to diets of grower Simple and rapid determination of phytase activity. J. AOAC Intern. 77, 760–764.
pigs exerted a very positive effect on animal
per-Gabert, V.M., Sauer, W.C., 1994. The effects of supplementing
formance and on the apparent total tract digestibility
diets for weanling pigs with organic acids. A review. J. Anim.
of ash, Ca and P. Also, the addition of lactic acid and Feed Sci. 3, 73–87.
formic acid at a practical and a higher dose enhanced Hohler, D., Pallauf, J., 1993. Untersuchungen zum Einfluss von¨
pig performance and the apparent total tract di- Citronensaure auf die Mineralstoffverwertung beim Ferkel¨
¨ ¨
anhand einer Mais-Soja-Diat mit und ohne Zn-Erganzung. J.
gestibility of DM, OM, ash, Ca and P. No differences
Anim. Physiol. Anim. Nutr. 69, 133–142.
in effect of the higher and lower doses of
sup-¨
Hohler, D., Pallauf, J., 1994. Effekt einer abgestuften Zn-Zufuhr
plemented organic acids were observed on any of the und Zulagen von Citronensaure zu einer Mais-Soja-Diat auf¨ ¨ response parameters. A synergistic effect between Leistungsparameter und Mineralstoffverwertung beim Ferkel.
formic acid and microbial phytase resulted in an J. Anim. Physiol. Anim. Nutr. 71, 189–199.
21 Jongbloed, A.W., 1987. In: Phosphorus in the Feeding of Pigs.
enhancement of 0.20 g digestible P kg of feed.
Agricultural University of Wageningen, p. 343, Ph.D. Thesis. Jongbloed, A.W., Kemme, P.A., Mroz, Z., van Diepen, J.Th.M.,
1996. Phytase in swine rations: impact on nutrition and environment. A review. In: BASF Technical Symposium, Des
Acknowledgements
Moines, IA, pp. 44–56.
Jongbloed, A.W., Kemme, P.A., Everts, H., 1994. Digestible P
Drs C. Geerse and A.K. Kies of DSM Food requirements for pigs. In: CVB documentation report nr. 10. Specialities at Delft, The Netherlands are acknowl- Centraal Veevoederbureau, Lelystad, The Netherlands, p. 38.
Kemme, P.A., Jongbloed, A.W., Mroz, Z., Kogut, J., Beynen, A.C.,
edged for their advice and financing this research and
1999. Digestibility of nutrients in growing-finishing pigs is for the provision of Natuphos and BASF for the
affected by Aspergillus niger phytase, phytate and lactic acid.
supply of the lactic and formic acids. 2. Apparent total tract digestibility of phosphorus, calcium and
magnesium and ileal degradation of phytic acid. Livest. Prod. Sci. 58, 119–127.
Kirchgessner, M., Roth, F.X., 1980. Verdaulichkeit und Bilanz von
References Protein, Energie und einigen Mineralstoffen bei
Fumar-¨ ¨
saurezulagen an Ferkel. Z. Tierphysiol. Tierenahrg. Futtermit-telkde. 44, 239–246.
AOAC, 1984. In: 14th Edition. Official Methods of Analysis.
Kirchgessner, M., Roth, F.X., 1982. Fumaric acid as a feed Association of Official Analytical Chemists, Arlington, VA.
additive in pig nutrition. Pig News Info. 3, 259–264. Beers, S., Jongbloed, A.W., 1992a. Apparent overall (total tract)
Mroz, Z., Jongbloed, A.W., Kemme, P.A., Geerse, C., 1993. digestibility of P in relation to doses of Aspergillus niger
Digestibility and urinary losses of calcium and phosphorus in phytase in diets for pigs. J. Anim. Sci. 70 (Suppl. 1), 242.
pigs fed a diet with suboptimal levels of both elements and Beers, S., Jongbloed, A.W., 1992b. Effect of supplementary
graded doses of microbial phytase (Natuphos ). In: Wenk, C.,
Aspergillus niger phytase in diets for piglets on their
per-Boessinger, M. (Eds.), Enzymes in Animal Nutrition. Proceed-formance and apparent digestibility of phosphorus. Anim. Prod.
Mroz, Z., Jongbloed, A.W., Vreman, K., Canh, T.T., van Diepen, Radecki, S.V., Juhl, M.R., Miller, E.R., 1988. Fumaric acid and J.Th.M., Kemme, P.A., Kogut, J., Aarnink, A.J.A., 1996. The citric acid as feed additives in starter pig diets: effect on effect of different cation–anion supplies on excreta composi- performance and nutrient balance. J. Anim. Sci. 66, 2598– tion and nutrient balance in growing pigs. In: Report ID-DLO 2603.
Lelystad no. 96.028, p. 57. Ravindran, V., Kornegay, E.T., 1993. Acidification of weaner pig Mroz, Z., Jongbloed, A.W., Partanen, K., Vreman, K., van Diepen, diet: a review. J. Sci. Food Agric. 62, 313–322.
J.Th.M., Kemme, P.A., Kogut, J., 1997. The effect of dietary Simons, P.C.M., Versteegh, H.A.J., Jongbloed, A.W., Kemme, P.A., buffering capacity and organic acid supplementation (formic, Slump, P., Bos, K.D., Wolters, M.G.E., Beudeker, R., Ver-fumaric or n-butyric acid) on digestibility of nutrients (protein, schoor, G.J., 1990. Improvement of phosphorus availability by amino acids, energy and minerals), water intake and excreta microbial phytase in broilers and pigs. Br. J. Nutr. 64, 525– production in growing pigs. In: Report JD-DLO 97.014, p. 65. 540.
Partanen, K., Mroz, Z., 1999. Organic acids as an alternative for Walz, O., Pallauf, J., 1990. Untersuchungen zum Vergleich des prophylactic medication of pig diets. Nutr. Res. Rev. 12, Bilanzverfahrens und der Korperanalyse zur Messung des¨ 117–145. Protein-, Energie- und Mineralstoffansatzes von Aufzuchtfer-Payne, R.W., Lane, P.W., Digby, P.G.N., Harding, S.A., Leech, keln. 2. Mitteilung: Scheinbare Verdaulichkeit und Retention
P.K., Morgan, G.W., Todd, A.D., Thompson, R., Tunnicliffe von Calcium. J. Anim. Physiol. Anim. Nutr. 64, 103–112. Wilson, G., Welham, S.J., White, R.P., 1993. Genstat 5. Walz, O., Pallauf, J., 1991. Untersuchungen zum Vergleich des Reference Manual. Clarendon, Oxford, UK. Bilanzverfahrens und der Korperanalyse zur Messung des¨ Prohaszka, L., Baron, L., 1980. The predisposing role of high Protein-, Energie- und Mineralstoffansatzes von Aufzuchtfer-dietary protein supplies in enteropathogenic E. coli infections keln. 3. Mitteilung: Retention von Phosphor und Verhaltnis¨ of weaned pigs. Zbl. Vet. Med. B. 27, 222–232. Calcium zu Phosphor. J. Anim. Physiol. Anim. Nutr. 65, Radcliffe, J.S., Zhang, Z., Kornegay, E.T., 1998. The effects of 53–63.
microbial phytase, citric acid, and their interaction in a corn– Williams, C.H., David, D.J., Iismaa, O., 1962. The determination soybean meal based-diet for weanling pigs. J. Anim. Sci. 76, of chromic oxide in faeces samples by atomic absorption