Welfare Reform and Health
Marianne P. Bitler
Jonah B. Gelbach
Hilary W. Hoynes
A B S T R A C T
We investigate the impact of welfare reform on health insurance coverage and healthcare utilization of single women aged 20–45, using nationally representative data from the Behavioral Risk Factor Surveillance System. We present estimates from both difference-in-difference models and difference-in-difference-in-difference models (using married women as a comparison group). We find that welfare reform is associated with reduc-tions in health insurance coverage and specific measures of healthcare utilization, as well as an increase in the likelihood of needing care but finding it unaffordable. Overall, effects are somewhat larger for Hispanics com-pared with blacks and low-educated women.
Marianne P. Bitler is a research fellow at the Public Policy Institute and adjunct at the RAND Corporation. Jonah B. Gelbach is an assistant professor of economics at the University of Maryland. Hilary W. Hoynes is an associate professor of economics at the University of California at Davis and a research associate with the National Bureau of Economic Research (NBER). The authors thank Amy Cox, Janet Currie, Jon Gruber, Steven Haider, Jacob Klerman, Darius Lakdawalla, Peter Mariolis, Doug Miller, Bob Mills, Shino Oba, Sondra Reese, Jeanne Ringel, Lara Shore Sheppard, Steve Stillman, and members of the NBER Summer Institute, the RAND Brown Bag, and attendees at the 2003 annual conference of the RWJ Scholars in Health Policy Program for their helpful comments and/or for information about health insurance data. They also thank Aaron Yelowitz for providing data on Medicaid expansions and Kitt Carpenter for help with the BRFSS. Excellent research assistance was provided by Jared Rodecker and Peter Huckfeldt. Bitler gratefully acknowledges the financial support of the National Institute for Child Health and Human Development and the National Institute on Aging, and the RAND Corporation. The views and conclusions are those of the authors and do not necessarily represent those of the RAND Corporation, NIA, or NICHD. Gelbach gratefully acknowledges financial support from the Robert Woods Johnson Foundation’s Scholars in Health Policy Program. Correspondence to Hoynes at hwhoynes@ucdavis.edu; Gelbach at gelbach@glue.umd.edu; or Bitler at Bitler@ppic.org. The data used in this article can be obtained beginning October 2005 through September 2008 from Hilary Hoynes, Department of Economics, UC Davis, hwhoynes@ucdavis.edu.
[Submitted July 2003; accepted June 2004]
ISSN 022-166X E-ISSN 1548-8004 © 2005 by the Board of Regents of the University of Wisconsin System
I. Introduction
Evaluating the impacts of state and federal welfare reform is the sub-ject of a large and growing literature. The recent welfare reform period in the United States started with state waivers from the former Aid to Families with Dependent Children (AFDC) program in the early 1990s. This period of active state experimen-tation culminated in the passage of the 1996 Personal Responsibility and Work Opportunity Act (PRWORA), which eliminated AFDC and replaced it with Temporary Assistance for Needy Families (TANF). This federal reform dramatically changed the economic incentives facing low-income individuals with children or con-sidering having children. In particular, these reforms imposed lifetime time limits, strengthened work requirements, and limited the eligible population.
A number of recent studies have shown that state waivers and TANF implementa-tion have played a role in the dramatic declines in welfare caseloads and increases in the employment of less skilled women.1Now that this first wave of research has estab-lished these important results, there is increasing interest in broadening our evaluation of welfare reform by examining the impacts on family well-being. Our paper makes an important contribution by examining the impact of welfare reform on the health-care utilization of adult women.
Little is known about the effects of welfare reform on healthcare utilization and overall health status. Several recent studies do, however, examine the impact of wel-fare reform on health insurance coverage using data from the Current Population Survey (CPS). Kaestner and Kaushal (2003) find that welfare reform led to a decrease in Medicaid coverage. The overall (negative) effects of reform on health insurance coverage were attenuated, they find, due to increases in private health insurance cov-erage. In a closely related literature, several papers examine state expansions in Medicaid eligibility for immigrants and parents that occurred around the time of PRWORA. Borjas (2003) and Royer (2003) find that more restrictive Medicaid poli-cies did not lead to substantially reduced health insurance coverage among immi-grants, because the loss in public coverage was offset by substantial increases in private insurance coverage. Busch and Duchovny (2003) and Aizer and Grogger (2003) find that parental Medicaid expansions led to increases in overall coverage, with small changes in private coverage. The results in these studies inform our analy-sis in two ways. First, while the focus of our analyanaly-sis is the largely unexplored area of healthcare utilization, we begin by analyzing the impacts of reform on health insur-ance coverage. Second, our models include controls for these and other changes to state Medicaid and non-Medicaid public health insurance programs.
There are likely many pathways through which welfare reform can affect health. First, as illustrated above, welfare reform may lead to a decline in Medicaid coverage. This is consistent with the observation that families leaving the welfare rolls also appear to stop receiving Medicaid and Food Stamps even when they remain eligible for these programs.2 The Journal of Human Resources
310
1. The welfare reform literature that has developed in the last several years is enormous. For comprehensive summary of this research, see the excellent reviews by Blank (2002); Grogger, Karoly and Klerman (2002); and Moffitt (2002).
This loss in public coverage may be offset by increased private coverage either due to increases in mother’s employment or coverage from another family member. These changes in insurance may subsequently impact healthcare utilization and health outcomes. Second, welfare reform may impact families’ economic resources. While the evi-dence is more mixed on this point, a number of researchers have found that welfare reform has led to an increase in the average incomes of low-skill families.3These changes in families’ economic circumstances could then affect healthcare utilization and health status directly. Third, reform-induced increases in employment will change parents’ time endowment, which may affect choices about healthcare utilization, diet, and health (Haider, Jacknowitz, and Schoeni 2003). Fourth, welfare reform could lead to increases (or decreases) in stress, which is associated with health outcomes.
To examine this issue, we use data from the Behavioral Risk Factor Surveillance System (BRFSS), a monthly individual survey conducted by states in partnership with the Centers for Disease Control and Prevention (CDC). The BRFSS is designed to pro-duce uniform, state-representative data on preventive health practices and risky behaviors and covers all civilian, noninstitutionalized persons age 18 and older. It is thus important to note that the BRFSS is limited to the adult population; as a consequence we cannot use it to examine the impact of reform on child health. We use the BRFSS data to ana-lyze the impacts of reform on single women aged 20–45 over the period 1990–2000. This time period allows for examination of both state AFDC waivers and state implementa-tion of federal welfare reform (PRWORA). We are able to analyze a wide range of health utilization measures (checkups, breast exams, and Pap smears), and reports of having needed care but not having been able to afford it. We also examine, but we do not report results on, measures of physical and mental health status (self-rated overall health status, days limited from usual activities, and days mental health is not good).4
We estimate pooled cross-section models where the impacts of welfare reform are captured by dummy variables for state implementation of welfare waivers and TANF. To focus our analysis on the group likely to be impacted, our main estimates are for sin-gle women. We further refine these groups by presenting results separately for blacks, Hispanics, and low-education (high school education or less) single women. All empir-ical models include controls for state, year, and month fixed effects; state labor market variables; and state programs affecting healthcare coverage (Medicaid, SCHIP, other state-funded programs). The impacts of welfare reform in this standard difference-in-differences (DD) framework are identified through variation in the timing and incidence of reform across states. To control for the possible correlation of state welfare policies with unmeasured state trends in health, we use married women as a comparison group and estimate difference-in-differences-in-differences (DDD) models.5
3. See the reviews cited above. As noted below, in Bitler, Gelbach, and Hoynes (2003b) we find consider-able heterogeneity in the effects of Connecticut’s Jobs First waiver on earnings, transfer payments, and income.
4. BRFSS data have been used recently in studies of disability and employment (Carpenter 2003); drinking (Dee 2001, Ruhm 2000; Ruhm and Black 2002); smoking (Evans, Ringel and Stech 1999; Gruber and Zinman 2001); risky behaviors (Dee and Evans 2001); and healthcare utilization and health status (Busch and Duchovny 2003).
5. A more targeted estimation sample would be single women with children. The BRFSS, however, has incomplete data on the presence of children in the family. In our earlier working paper (Bitler, Gelbach, and Hoynes 2004) we present estimates for both single women and single women with children. These data limitations will be explained more fully below.
Our results generally show that welfare reform is associated with decreases in health insurance coverage and healthcare utilization, as well as an increase in the like-lihood of needing care but finding it unaffordable. In addition, we find no statistically significant association between welfare reform and self reported health status. Im-portantly, these effects are robust to the source of identification (DD or DDD). The findings suggest that TANF had larger effects than waivers, and that impacts for Hispanics were somewhat larger than impacts for blacks and low-education women. Efforts to relate these larger effects among Hispanics to immigration policy reforms are suggestive but not conclusive.
The remainder of the paper proceeds as follows. Section II describes the changes in welfare programs and their expected effects on health insurance and health out-comes. In Section III, we discuss previous literature on welfare reform and health. In Section IV and Section V, we describe our data and discuss our empirical model. We report results in Section VI and then conclude in Section VII.
II. Welfare Reform in the 1990s and Implications
for Health
Beginning in the early 1990s, many states were granted waivers to make changes to their AFDC programs. As shown in the top panel of Table 1, about half of the states implemented some sort of welfare waiver between 1993 and 1995. On the heels of this state experimentation, PRWORA was enacted in 1996, replacing AFDC with TANF. While waiver and TANF policies varied considerably across states, overall the reforms are viewed as welfare tightening and pro-work. More specifically, the welfare-tightening elements of reform include work requirements, financial sanctions, time limits, family caps, and residency requirements.6The loos-ening aspects of reform include liberalized earnings disregards (which promote work by lowering the tax rate on earned income while on welfare), increased asset limits, and expanded eligibility for two-parent families.
During this same period, public health insurance for low-income families was expanding. Historically, eligibility for Medicaid for the nonelderly and nondisabled was tied directly to receipt of cash public assistance. In particular, the AFDC income eligibility limits adopted by a state would also be used for Medicaid, and AFDC con-ferred automatic eligibility for Medicaid. Thus, a family that received AFDC benefits also would be eligible for health insurance through Medicaid. Conversely, if a family left AFDC, its members generally would lose Medicaid coverage.7However, in a series of federal legislative acts beginning in 1984, states were required to expand Medicaid coverage for infants, children, and pregnant women beyond the AFDC income limits, leading to large increases in eligibility (Gruber 1997).
6. Family cap policies prevent welfare benefits from increasing when a woman gives birth while receiving aid. Residency-requirement policies mandate that unmarried teen parents who receive aid must live in the household of a parent or other guardian.
7. States could and did set up Medically Needy programs that allowed states to provide Medicaid benefits to families above the AFDC income cutoff if they had high medical expenses. States also were required to provide transitional Medicaid coverage for families leaving AFDC due to an increase in earnings. The Journal of Human Resources
Bitler, Gelbach, and Hoynes 313
PRWORA further weakened the link between AFDC and Medicaid by requiring states to cover any family that meets the pre-PRWORA AFDC income, resource, and family composition eligibility guidelines (Haskins 2001). This so-called 1931 pro-gram (named after the relevant section of the Social Security Act, as amended by PRWORA) also allowed states to expand eligibility for parents beyond the 1996 AFDC/Medicaid limits. Aizer and Grogger (2003) report that by 2001 about half the states had taken advantage of this program and expanded Medicaid access for parents above the welfare income cutoffs. PRWORA also contained language restricting immigrant access to means-tested transfer programs (including Medicaid). As dis-cussed in Borjas (2003), many states responded by providing immigrant access to Medicaid using newly created, state-funded “fill-in” programs. In 1997, Congress established the State Children’s Health Insurance program (SCHIP), which allows states to provide public health insurance to children up to 200 percent of the poverty level (and subsequently to higher levels). Our empirical model includes controls for these expansions.
In the context of these dramatic changes in the U.S. social safety net, we start by discussing the expected effects of these reforms on our target population—women potentially eligible for welfare. There are many pathways through which welfare reform may affect health outcomes.
First, welfare reform reduces welfare caseloads, leading to a decline in Medicaid coverage. The AFDC caseload has declined more than 60 percent since its peak in 1994 (U.S. Department of Health and Human Services 2002). During this time period, the number of nondisabled adults and children on Medicaid also fell. Between 1995 and 1997, the number of nondisabled adults on Medicaid fell by 10.6 percent, with larger reductions among cash welfare recipients (Ku and Bruen 1999). The noncash Medicaid caseload (especially children), on the other hand, grew, reflecting the sepa-ration of AFDC eligibility from Medicaid eligibility described above.
This expected loss in public coverage may be offset by increased private coverage due to increases in mother’s employment or coverage from another family member. However, these low-skill workers are likely to be employed in industry-occupation cells with traditionally low rates of employer-provided health insurance (Currie and Yelowitz 2000). In sum, the first prediction is that welfare reform should be associ-ated with a decrease in Medicaid coverage, an increase in private insurance, and likely a decrease in overall insurance.
This pathway of decreased insurance coverage can lead to changes in health. A decline in insurance can then lead to less health service utilization—for example, less preventive care and prenatal care (Nathan and Thompson 1999). This decline in healthcare utilization may subsequently impact health outcomes.
Second, welfare reform may impact families’ economic resources. While the evi-dence is less clear on this topic, research suggests that welfare reform has led to an overall increase in the incomes of low-skill families.8However, Bitler, Gelbach, and Hoynes (2003b) use experimental data and show that reform has heterogeneous impacts across the income distribution, with some evidence of reductions at the
The Journal of Human Resources
314
Table 1
State Implementation of AFDC Waivers and TANF Programs, by March 1
Ever Had a Waiver
1993 1994 1995 1996 1997 Never Had a Waiver
First year for California Georgia Arkansas Arizona Hawaii Alabama
which major Michigan Illinois South Dakota Connecticut Florida
waiver was New Jersey Iowa Vermont Delaware Kansas
implemented Oregon Indiana Kentucky
by March 1 Utah Massachusetts Louisiana
Mississippi Maine
Missouri Nevada
Montana New Hampshire
Virginia Oklahoma
Washington South Carolina
West Virginia Wyoming
Wisconsin Alaska
Bitler
, Gelbach, and Ho
ynes
315
First Year for Alabama Alaska
which TANF Florida Colorado
was implemented Kansas DC
by March 1 Kentucky Idaho
Louisiana Minnesota
Maine New Mexico
Nevada New York
New Hampshire North Dakota Oklahoma Pennsylvania South Carolina Rhode Island
Wyoming Arkansas
Arizona California
Connecticut Delaware
Georgia Hawaii
Indiana Illinois
Iowa Mississippi
Maryland New Jersey Massachusetts Wisconsin Michigan
Missouri Montana Nebraska North Carolina Ohio Oregon South Dakota Tennessee Texas Utah Vermont Virginia Washington West Virginia
lowest income levels. These changes in a family’s economic well-being could then have direct impacts on healthcare utilization and health status.
Third, increases in employment lead to changes in a parent’s time endowment which in turn can affect choices about healthcare utilization, diet, and health. Fourth, welfare reform could lead to increases (or decreases) in stress, which in turn can affect health.
Discussion of these pathways illustrates that the impacts of welfare reform on health insurance coverage and healthcare utilization are more direct than the impacts on health status. This interpretation is consistent with the health production model in Grossman (2001). In particular, health is a durable capital stock that will change slowly with investment (time, nutrition, exercise, health services). Health services, on the other hand, are goods consumed each period and therefore would be expected to change more quickly in response to changes in prices, income, and time constraints. Consequently, we focus here on health insurance coverage and healthcare utilization, with less attention to health status. Identifying the impacts of welfare reform on health status will likely require data from a longer follow-up period.
III. Literature Review
As noted above, the welfare reform literature is very large and is well reviewed elsewhere (Blank 2002; Grogger, Karoly, and Klerman 2002; Moffitt 2002). Here, we focus on the much smaller literature on welfare reform and health. Most studies in this area examine the impacts on health insurance while little is known about impacts on health utilization and health status. The literature comes from three sources: randomized experimental analyses of state AFDC waivers, welfare leaver studies, and nonexperimental analyses of administrative and household survey data.
The first source is experimental analyses of changes to state AFDC programs (waivers). The results in these studies compare outcomes for families randomized into the existing AFDC program to families randomized into a waiver program. Findings from these studies vary, and they also have limitations related to the inability to obtain nationally representative estimates and to account for effects of changes in entry behavior that result from welfare reform.
The second source of information on welfare reform and health is leaver studies— national-level or state-level studies that examine the characteristics of families leav-ing welfare. The studies uniformly show that welfare leavers experience a decline in insurance coverage. While private insurance coverage increases, public health insur-ance (such as Medicaid) declines more, leading to an increase in the percent unin-sured.9These leaver studies provide an excellent snapshot of the experiences of those families that have left welfare. However, as discussed in Blank (2002), such studies cannot identify causal impacts of welfare reform.
The last source of information uses nonexperimental methods to examine the impact of reform on health insurance using administrative or household survey data. Ku and Garrett (2000) examine the impact of pre-PRWORA welfare waivers on The Journal of Human Resources
316
Medicaid caseloads and find that waivers led to (statistically insignificant) declines in the adult and child Medicaid caseload.10
Several recent studies use the Current Population Survey (CPS) to examine the impact of welfare reform, and other changes to Medicaid, on health insurance coverage. Kaestner and Kaushal (2003) find that declines in the AFDC caseload are associated with reductions in Medicaid, increases in employer-provided health insurance, and overall increases in uninsurance. DeLeire, Levine, and Levy (2003) examine low-edu-cation women and find that waivers from the AFDC program and TANF implementa-tion in states that formerly had waivers are associated with increases in health insurance. Borjas (2003) and Royer (2003) find that more restrictive Medicaid policies did not reduce health insurance coverage among immigrants, because the loss in public cov-erage was offset by increases in private insurance covcov-erage. Royer also examines the impact on pregnant immigrants and finds a temporary reduction in prenatal care, but no effect on birth outcomes.
Aizer and Grogger (2003) and Busch and Duchovny (2003) use the CPS to exam-ine parental Medicaid expansions through the 1931 program. Aizer and Grogger (2003) find that these Medicaid expansions led to increases in health coverage of women (with some crowdout of private insurance coverage). They also find that expanding parental coverage leads to increases in the health insurance coverage of children—possibly arising from an increase in benefits relative to costs associated with taking up coverage. Busch and Duchovny (2003), in one of the only other papers to use the BRFSS, find that these parental Medicaid expansions led to increases in healthcare utilization, with no significant effects on health status.11
Overall, while the evidence is somewhat mixed, it generally suggests that health insurance coverage declines with reform. Below, we replicate this finding and then extend the literature to examine the impacts on several measures of health utilization.
IV. Data
A. BRFSS
We analyze the impact of welfare reform on the health of adult women using data from the Behavioral Risk Factor Surveillance System (BRFSS). The BRFSS is a nationally representative telephone survey of the civilian, noninstitutionalized adult population conducted by the CDC in partnership with the states, Washington, D.C., and some ter-ritories. The BRFSS provides detailed information on healthcare utilization and health status as well as limited data on health insurance coverage. The BRFSS also provides demographic variables, including age, race and ethnicity, marital status, and education. Few household or individual survey data sets cover health utilization and health sta-tus. For example, the CPS, which is often used in nonexperimental analyses, provides
Bitler, Gelbach, and Hoynes 317
10. Currie and Grogger (2002) and Kaestner and Lee (2003) use natality data and find that declines in welfare caseloads are associated with declines in prenatal care and small increases in the incidence of low birthweight for low-education women.
detailed economic and demographic data, but beyond health insurance coverage, it has little health information that spans the period of recent welfare reforms.12The National Health Insurance Survey (NHIS) has much more information on health, but the public-use data files do not include the state identifiers that are necessary to cre-ate stcre-ate welfare reform variables, and the survey was redesigned as of 1997, right when reform was implemented in many states.
The BRFSS was first fielded in 1984 in 20 states but now covers all states and is designed to yield uniform, state-representative data on risky behavior and preventive health practices by all persons 18 and older.13The BRFSS is administered monthly, and people are equally likely to be surveyed in each calendar month. For this reason, we do not drop states for which there are no observations in a subset of months within a given year. States must follow CDC-approved methods for sampling, and partici-pating states are required to ask core questions every year. States are also permitted to select questions from modules that are not asked every year, as well as to propose their own questions. The BRFSS is a telephone survey, so households with no phones are excluded.14
The BRFSS differs from most other large household or individual surveys along several dimensions. First, no proxy answers are permitted, and only one adult (aged 18 or older) is interviewed per household. These factors may lead to lower response rates than for other surveys. Further, the BRFSS does not produce fully imputed data; that is, there is no attempt to allocate responses for persons who cannot or refuse to answer specific questions. This item nonresponse is fairly minor for most of our out-comes of interest, so we simply ignore observations with missing items.
We base our analysis on the BRFSS survey years 1990–2000.15For each outcome vari-able, we restrict the sample to the set of states that asked each question in every year. Since some questions were asked only starting in 1991, 1992, or 1993, and since some states do not include all questions in all years, this selection rule means the set of states in our sample differs slightly across outcomes. While we would prefer a constant sample of states, ceteris paribus, the countervailing advantage of this approach is that we have a balanced panel of states for each outcome. Our estimates therefore may be interpreted as representing average treatment effects for the states in the sample (assuming the usual conditions for this result hold; see Heckman and Robb 1985 for a discussion).16 The Journal of Human Resources
318
12. Self-reported health status questions were not added to the CPS until the middle of the period we examine.
13. There is a “youth” risk behavioral survey, in which children in grades 9–12 are asked about risky behav-iors. Unfortunately, this survey does not ask about health insurance or healthcare utilization, and the health-related questions change from year to year.
14. While 95 percent of households in the United States have phones, coverage is lower for persons living in the south, for some racial groups, and for those in lower socioeconomic groups (U.S. Bureau of the Census 1994).
15. We choose 1990 primarily because the number of participating states increased substantially in that year. As shown in Table 1, our analysis period contains all years when major state welfare reforms were taking place.
To identify a population at higher risk of being impacted by welfare reform, our empirical analysis is based on the sample of single women aged 20–45. We present separate results for subsamples of black, Hispanic, and low-education single women.17Our low-education sample includes those with a high school education or less. An analysis of single women aged 20–45 using the March CPS in the prewelfare reform period (1988–92), shows that about 24 percent of black single women, 18 per-cent of Hispanic single women, and 19 perper-cent of low-education single women had some AFDC income in the previous year.
Given welfare eligibility rules, the treatment group used in most welfare reform studies is single women with children. While we have reestimated our models on the sample of single women with children (Bitler, Gelbach, and Hoynes 2004), we con-centrate here on all single women because of data limitations in the BRFSS. Specifically, the BRFSS provides marital-status data for all states in all years but its information on presence of children is incomplete. The only variable available for the full 1990–2000 period measures the presence of a child aged 5–13 in the household. However, given the apparent large effects of welfare reform on the employment of women with young children (Meyer and Rosenbaum 2000), dropping women who coreside with children younger than five is undesirable.18The number of all children younger than 18 is available, but only for years 1993–2000. Further, California must be dropped from any sample of single women with children because of missing data in 1995. This is especially problematic for interpreting the results for the Hispanic subsample.19
We construct three sets of outcome variables concerning health insurance coverage, health utilization, and health status. Respondents are asked about their insurance at the time of the interview. We use this to create an indicator variable for whether the respondent is insured now. We use this any-coverage variable because the BRFSS has no specific questions concerning source of insurance coverage (such as Medicaid or employer-provided health insurance).20,21
Bitler, Gelbach, and Hoynes 319
17. The black sample includes all non-Hispanic blacks (Hispanics may be of any race). The low-education sample includes members of all racial and ethnic groups and therefore includes some of the women in the black and Hispanic samples.
18. Tabulations of the prereform (1989–92) period using the March CPS show that about one quarter of sin-gle women with no child aged 5–13 do have a child younger than 18, and 14 percent of sinsin-gle women with no child aged 5–13 have a child younger than five. Among the group with a child younger than 18 but no child 5–13, about 20 percent have some AFDC income, compared with 27 percent among single women with a child aged 5–13. Among the group with a child younger than five and no child 5–13, 30 percent have some AFDC income.
19. A second BRFSS shortcoming is that the child variables concern the presence or number of children in the entire household, rather than by parent, so they do not allow for the identification of single women living with children.
20. In our earlier working paper (Bitler, Gelbach, and Hoynes 2004) we created a proxy for public and private insurance by using current employment status to construct two additional variables: insured and working and insured and not working.
The Journal of Human Resources
320
The healthcare utilization outcomes we analyze include three separate variables indicating whether a woman has had a checkup, breast exam, or Pap smear in the last year. These are important measures of preventive care for adult women. Further, because checkups and breast exams are conducted in the clinician’s office and Pap smears require lab work, these measures might respond differentially to changes in insurance status. Another healthcare utilization measure we examine is whether a woman reports having needed care but not having been able to afford it. As indicated above, we focus on healthcare utilization because there may not have been adequate time after reform to identify impacts on health status. Nonetheless, the health status outcomes we analyze include whether self-reported health status is fair or poor, the number of days in the last month the respondent reported that her mental or physical heath limited her from her usual activities, and the number of days in the last month her mental health was not good.
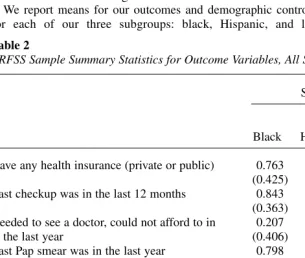
We report means for our outcomes and demographic controls in Tables 2 and 3 for each of our three subgroups: black, Hispanic, and low-education single
Table 2
BRFSS Sample Summary Statistics for Outcome Variables, All Single Women 20–45
Subsample
Low Black Hispanic Education
Have any health insurance (private or public) 0.763 0.633 0.673 (0.425) (0.482) (0.469) Last checkup was in the last 12 months 0.843 0.699 0.718
(0.363) (0.459) (0.450) Needed to see a doctor, could not afford to in 0.207 0.261 0.265
the last year (0.406) (0.439) (0.441)
Last Pap smear was in the last year 0.798 0.654 0.691 (0.402) (0.476) (0.462) Last professional breast exam was in the last year 0.722 0.566 0.631
(0.448) (0.496) (0.482)
General health is fair or poor 0.143 0.195 0.172
(0.350) (0.396) (0.378) Days in last month poor health kept respondent 1.983 1.922 2.299
from usual activities (5.605) (5.505) (6.139)
Days in last month poor mental health 4.575 4.800 5.532 (8.470) (8.321) (9.192)
Maximum available sample size 26,527 12,680 60,872
Note: Tabulations from the BRFSS 1990–2000 with standard errors in parentheses. Weighting is based on
Bitler, Gelbach, and Hoynes 321
Table 3
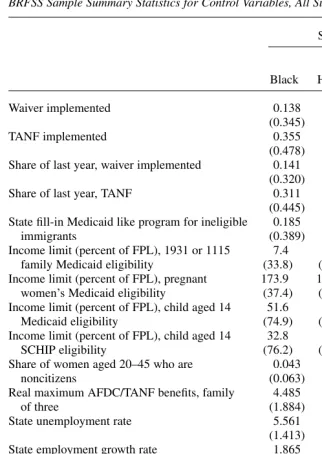
BRFSS Sample Summary Statistics for Control Variables, All Single Women 20–45
Subsample
Low Black Hispanic Education
Waiver implemented 0.138 0.224 0.154
(0.345) (0.417) (0.361)
TANF implemented 0.355 0.380 0.344
(0.478) (0.486) (0.475) Share of last year, waiver implemented 0.141 0.228 0.151
(0.320) (0.390) (0.330)
Share of last year, TANF 0.311 0.334 0.302
(0.445) (0.453) (0.442) State fill-in Medicaid like program for ineligible 0.185 0.225 0.189
immigrants (0.389) (0.417) (0.391)
Income limit (percent of FPL), 1931 or 1115 7.4 9.6 10.4 family Medicaid eligibility (33.8) (35.8) (39.1) Income limit (percent of FPL), pregnant 173.9 189.4 176.4
women’s Medicaid eligibility (37.4) (41.4) (39.0) Income limit (percent of FPL), child aged 14 51.6 49.9 51.2
Medicaid eligibility (74.9) (60.1) (72.9)
Income limit (percent of FPL), child aged 14 32.8 50.2 34.8
SCHIP eligibility (76.2) (92.5) (79.2)
Share of women aged 20–45 who are 0.043 0.409 0.107
noncitizens (0.063) (0.145) (0.174)
Real maximum AFDC/TANF benefits, family 4.485 5.780 5.083
of three (1.884) (2.261) (2.050)
State unemployment rate 5.561 6.050 5.674
(1.413) (1.591) (1.550)
State employment growth rate 1.865 2.029 1.886
(1.443) (1.644) (1.564)
Age 31.2 29.9 31.0
(7.5) (7.5) (7.6)
High school dropout, no GED 0.121 0.276 0.263
(0.326) (0.447) (0.440)
High school diploma or GED only 0.373 0.299 0.737
(0.484) (0.458) (0.440) Some college/technical school, no four-year 0.334 0.283 0.000
degree (0.472) (0.451) (0.000)
Maximum available sample size 26,527 12,680 60,872
Note: Tabulations from the BRFSS 1990–2000 with standard errors in parentheses. Weighting is based on
The Journal of Human Resources
322
women.22The descriptive data show that the health variables vary considerably across our subgroups. Black women are more likely to be covered by health insurance, have higher utilization rates, and are in better health than Hispanic and low-education women. For example, 76 percent of blacks have health insurance, compared with 67 percent of low-education women. A large share of single women said they needed to see a doctor in the previous year and could not afford it (21 percent of black women and about 26 percent of Hispanic and low-education women).
B. Welfare Reform Variables and Other State-Level Controls
We include two kinds of state-level control variables in our models. Our key variables of interest are indicators of whether states have implemented welfare reform. We also include a series of state-level variables in all of our regressions to control for eco-nomic opportunities in the state, state welfare benefit generosity, and state generosity in the provision of public health insurance.
Our welfare reform variables can be classified into two categories: those related to state waivers in the pre-PRWORA era and those related to post-PRWORA TANF pro-grams. Our main focus is on simple dummy variables indicating whether or not the given reform—waiver or TANF—is in place (implemented) in a state. Following the convention in the literature, we code a waiver as being in place only if it was “major,” in the sense of involving a significant deviation from the state’s AFDC program, and if it was in effect statewide. Our primary data source for the dating of state reforms is a set of tables available on the website of the Assistant Secretary for Planning and Evaluation (ASPE) for the Department of Health and Human Services.23For TANF, we construct a dummy variable indicating whether the state TANF plan has been implemented. In general, we code states as having implemented a policy in a given month if the policy was implemented by the first day of the previous month.
Some of our outcomes (insurance status and health status) refer to women’s condi-tions contemporaneously. For these variables, our welfare reform variables refer to the policy in place at the beginning of the previous month. By contrast, the healthcare uti-lization outcomes measure whether women obtained (or did not obtain) care during the previous year. For these retrospective questions, we construct the state welfare reform variables using the 12-month period ending in the month prior to the interview month. If a reform (either waiver or TANF) is implemented at some time during the 12-month recall period, the reform variable is the fraction of the 12-month period that the reform is in place; otherwise the variable is coded as 0.
To account for variation in economic opportunities, we control for a vector of state-level labor market variables; these variables include current and one-year lags of unemployment and aggregate employment growth rates. We also include the real
22. Recall that the number of nonmissing observations varies across the outcome variables. The means in Tables 2 and 3 are for the superset of observations that are defined for any of the health outcomes of inter-est and also have data for all the right-hand side control variables. The number of observations for each health outcome used is reported in the tables of regression results.
maximum welfare benefit level for a family of three to control for the state’s public assistance program generosity (holding constant welfare reform activity). The time periods used to construct these state-level control variables match the reporting period for each health outcome variable. For example, current health insurance status regres-sions include this year’s benefit level, and this and last year’s unemployment rate. The health utilization variables (which refer to last year) include last year’s welfare bene-fit, and one- and two-year lags of the unemployment rate.
We construct four state-level variables to control for expansions in public health insurance coverage during this period: (1) the percent of the federal poverty level at which a pregnant woman loses eligibility for Medicaid coverage; (2) the percent of the federal poverty level at which a 14-year-old child loses Medicaid eligibility; (3) the percent of the federal poverty level at which a parent loses eligibility under post-PRWORA 1931 expansions; and (4) the percent of the poverty level at which a child of 14 loses eligibility for SCHIP coverage through a separate or combination state plan (states with Medicaid SCHIP plans are captured with our control for Medicaid eligibility for a child of 14).24We control for child health insurance expan-sions as they may impact women because they reduce the cost of family (or parent-only) coverage.25
The means of the state-level and demographic variables are provided for our three samples in Table 3.
V.
Empirical Model
A standard approach in the nonexperimental welfare reform literature is to use pooled cross-sections and run regressions of outcome measures on demo-graphic covariates, state-level controls, policy variables, and state and year fixed effects. We follow this basic approach.
We estimate linear regression models in which yistindicates an outcome for indi-vidual iin state sin year tand has the following form:26
( )1 yist=Xistd+Lsta+Rstb+cs+ot+fist.
Bitler, Gelbach, and Hoynes 323
24. The first two variables control for the Medicaid expansions of the late 1980s through the early 1990s and are based on National Governor’s Association Maternal and Child Health Updates and information gener-ously provided by Aaron Yelowitz. The 1931 expansion variable is based on data from Aizer and Grogger (2003), Busch and Duchovny (2003), the National Governor’s Association, and the State Policy Documentation Project. The SCHIP variable is based on data from the websites of the Centers for Medicare and Medicaid Services and the National Governor’s Association. State Medicaid 1931 plans that did not expand eligibility above the former AFDC program-eligibility cutoffs are captured by our control for state-level maximum AFDC/TANF benefits. Benefit state-levels are quite collinear with the AFDC income-eligibility thresholds for 1996 and the statutory 1931 minimum eligibility threshold, (states’ 1988 AFDC income-eligibility cutoffs).
25. For outcome variables that are measured at the time of the survey, we use the expansion variables mea-sured as of the policy last month. For the health-utilization variables, which refer to last year, we use the average of the policy variables over the last year.
Here, Xist is a vector of demographic characteristics, including controls for the woman’s age and its square, race and ethnicity, and dummy variables for her com-pleted education level. Lstis a vector of the state-level labor market variables described above that control for economic opportunities in the state. Lstalso includes the real maximum welfare benefit level for a family of three and the four measures of the gen-erosity of state’s public health insurance described above. The γsterms represent state fixed effects and the νtterms represent year and calendar month fixed effects. The state (time) fixed effects control for unobserved factors that differ across states and not over time (over time and not across states). Unobservable determinants are captured by εist. All regressions are weighted by the BRFSS final weight, finalwt.
Our main focus is on the coefficients of Rst, the welfare reform implementation dummies for the waiver and TANF programs. For waiver states, when TANF is imple-mented the waiver dummy is turned back to 0. Therefore, the reform coefficients rep-resent the treatment effect of reform relative to the counterfactual, no-reform state of the world.
Some observers object that the simple dummy-variable approach taken here assumes that reform effects occur instantaneously at the time of implementation. However, this objection is on target only if one assumes that reform’s effects are con-stant (over time and across states). In our view, this assumption would be unreason-able even if instantaneous effects could be presumed. Detailed aspects of state reforms and economic conditions are difficult to observe. Moreover, there is no reason to think that different demographic groups will respond to the same reforms in the same way. Given all this, we strongly believe that the coefficients on Rstshould be interpreted as averages of heterogeneous treatment effects over the post-reform period.
The model in Equation 1 applied to the sample of single women is essentially a difference-in-difference (DD) model specification where the impacts of welfare reform are identified using differences across states in the timing and presence of reform. The top panel of Table 1 reports the first year for which we coded observations in each state as subject to a waiver (the table uses March 1 as the cutoff date for each year). The table also lists the states that never implemented major statewide waivers accord-ing to ASPE. It is clear from the table, as well as previous literature, that there is sub-stantial variation in the implementation of state waivers across states and time. Unfortunately for empirical researchers, variation in TANF implementation was much less extensive—all states implemented their TANF programs within a 16-month period. The bottom panel of Table 1 shows that for all states, the first March of TANF implementation occurred in either 1997 or 1998.
This limited variation is a potentially important complication, as discussed in Bitler, Gelbach, and Hoynes (2003a). TANF effects estimated using the above methodology can be regarded as the average treatment effect over the 16-month period during which there is variation in TANF implementation status. However, all states implemented by January 1998, so after that date there is no comparison group, and thus no identifying variation, after this month. This is unimportant if TANF treatment effects are constant over time, in which case the identified estimate for the 16-month period is appropriate for all years. But if one believes TANF impacts vary over time, effect levels or bounds on effects for later years are identified only by mak-ing assumptions about secular time effects after all states have implemented. To address this problem, we estimated models with more detailed measures of reform, The Journal of Human Resources
rather than simply using implementation dummies, as regressors. We discuss this lat-ter approach below, noting for now only that it turns out to be largely unilluminating. In general, we feel that the TANF estimates are best regarded as suggestive, rather than conclusive.
One potential concern that arises in DD-type studies is that even in the absence of policy changes, underlying trends in the outcome variables of interest could lead to spurious estimates of policy effects. To address this concern, we follow the conven-tional strategy of introducing a comparison group who should not have been affected by welfare reform, leading to a difference-in-difference-in-difference (DDD) estima-tor. The advantage of this approach is that it provides within-state variation in reform. Thus if the comparison groups are valid, then they net out any within-state trends in health outcomes common to the treatment and comparison groups in a state. Our main DDD results compare single women to married women. We estimate these DDD models in a general way, allowing all parameters in Equation 1 to vary across the treatment and comparison groups. The DDD estimate is the difference in the esti-mated βs between the treatment and comparison groups.27
Lastly, we note that our standard error estimates allow arbitrary correlation within state-year cells. Hence, our precision is not spuriously driven by the fact that we use microdata while the policy variation occurs at the state-year or state-month level.
VI. Results
We first present our main findings for the impact of waivers and TANF on the health insurance and healthcare utilization of single women. In Section IVB we briefly discuss the coefficients on variables other than the reform dummies.
A. Results for Single Women
Our main results are presented in three tables. All models are estimated for single women aged 20–45. The tables present these estimates for blacks (Table 4), Hispanics (Table 5) and those with a high school education or less (Table 6). Each table has the same structure. Coefficients in Rows 1 and 4 are the DD estimates of the waiver (Row 1) and TANF (Row 4) dummies in the regressions for single women. Each of the five columns provides estimates for a different outcome variable. Coefficients in Rows 2 and 5 are similarly defined estimates using the comparison group of married women. Rows 3 and 6 provide the DDD estimates. All reported estimates are coefficients from linear probability models, and we provide the prereform means for the treatment and comparison groups (Rows 9 and 10) to help interpret the magnitude of the estimated treatment effects. The model also includes controls for the age of the woman and its square, race/ethnicity (if applicable), educational attainment (if applicable), state labor market conditions, state public assistance programs (other than reform variables), state fixed effects, year fixed effects, and calendar-month fixed effects.
Bitler, Gelbach, and Hoynes 325
The Journal of Human Resources
326
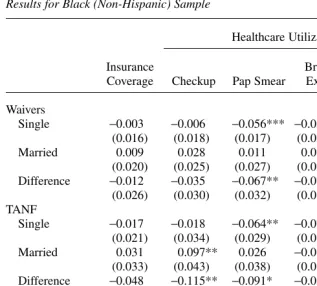
Table 4
Results for Black (Non-Hispanic) Sample
Healthcare Utilization
Insurance Breast Needed Care,
Coverage Checkup Pap Smear Exam Unaffordable
Waivers
Single −0.003 −0.006 −0.056*** −0.054*** 0.033*
(0.016) (0.018) (0.017) (0.021) (0.019)
Married 0.009 0.028 0.011 0.023 0.002
(0.020) (0.025) (0.027) (0.029) (0.022) Difference −0.012 −0.035 −0.067** −0.077** 0.031
(0.026) (0.030) (0.032) (0.035) (0.029) TANF
Single −0.017 −0.018 −0.064** −0.071** 0.015
(0.021) (0.034) (0.029) (0.036) (0.032)
Married 0.031 0.097** 0.026 −0.019 −0.013
(0.033) (0.043) (0.038) (0.037) (0.037)
Difference −0.048 −0.115** −0.091* −0.052 0.028
(0.040) (0.055) (0.048) (0.051) (0.049) Number of observations
Single 24,091 24,956 23,687 24,381 24,087
Married 10,475 10,937 10,333 10,737 10,474
Prereform mean
Single 0.753 0.849 0.809 0.737 0.211
Married 0.850 0.857 0.839 0.799 0.167
Note: ***, **, and * indicate statistical significance at the 1, 5, and 10 percent levels, respectively. All fig-ures are weighted OLS coefficients (using BRFSS finalwtvariable), with robust variance estimates to account for state-by-year clustering. Each column presents estimates from a separate regression. Sample includes all black non-Hispanic single women ages 20–45 from the 1990–2000 BRFSS. Regressions also include controls for demographic variables, state labor market variables, other state policy variables, and state, year, and calendar month fixed effects. See text for details.
First consider the DD estimates for the sample of black single women (Rows 1 and 4 of Table 4). The results in the first column shows that among black single women, welfare reform leads to a small negative, statistically insignificant reduction in over-all health insurance coverage. The point estimates imply a larger negative (but still statistically insignificant) effect for TANF.
Bitler, Gelbach, and Hoynes 327
and a professional breast exam. A negative coefficient for these measures represents a decrease in healthcare utilization associated with reform. The final utilization meas-ure is a dummy equal to one if the woman reports she needed to see a doctor in the past 12 months but that it was unaffordable. Here a positive coefficient suggests an adverse impact of reform. Looking across the columns, the results consistently show that welfare reform is associated with reductions in healthcare utilization. For exam-ple, the incidence of breast exams and Pap smears falls by about 7–10 percent in the reform period relative to baseline. In addition, the propensity to have needed a Table 5
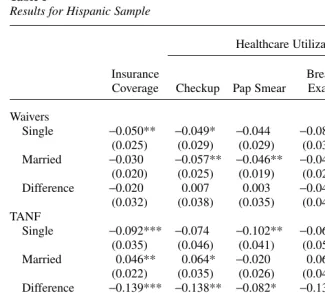
Results for Hispanic Sample
Healthcare Utilization
Insurance Breast Needed Care,
Coverage Checkup Pap Smear Exam Unaffordable
Waivers
Single −0.050** −0.049* −0.044 −0.081** 0.078**
(0.025) (0.029) (0.029) (0.035) (0.036)
Married −0.030 −0.057** −0.046** −0.041 0.038*
(0.020) (0.025) (0.019) (0.027) (0.019)
Difference −0.020 0.007 0.003 −0.040 0.040
(0.032) (0.038) (0.035) (0.044) (0.041) TANF
Single −0.092*** −0.074 −0.102** −0.069 0.050
(0.035) (0.046) (0.041) (0.050) (0.052)
Married 0.046** 0.064* −0.020 0.065 0.047
(0.022) (0.035) (0.026) (0.042) (0.043) Difference −0.139*** −0.138** −0.082* −0.135** 0.003
(0.041) (0.058) (0.048) (0.065) (0.068) Number of observations
Single 11,726 11,697 11,563 11,409 11,719
Married 13,258 13,328 13,105 13,012 13,257
Prereform mean
Single 0.661 0.749 0.668 0.596 0.255
Married 0.691 0.759 0.729 0.665 0.253
The Journal of Human Resources
328
doctor’s care but to have found it unaffordable increases 7–16 percent relative to baseline.28
A well-known disadvantage of the dummy-variable approach to measuring welfare reform is that it does not allow one to discern which aspects of welfare programs are
28. In results not reported here, we analyze self reported health and days limited and find no significant effects of welfare reform on health status. About half the point estimates suggest deterioration in health with reform while the other half suggests improvements in health with reform. These insignificant results (which are reported in Bitler, Gelbach, and Hoynes 2004) are found for all subgroups and for DD and DDD mod-els. As described in Section II, this is not surprising given that health status is a stock variable and as such, may take more time to respond to changes in prices and income. In fact, other recent studies on health and public programs have similar findings (Royer 2003; Kaestner and Tarlov 2003).
Table 6
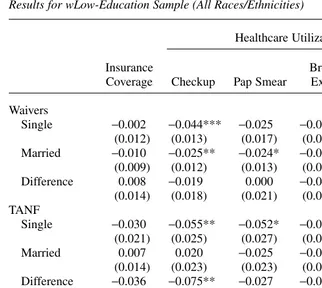
Results for wLow-Education Sample (All Races/Ethnicities)
Healthcare Utilization
Insurance Breast Needed Care,
Coverage Checkup Pap Smear Exam Unaffordable
Waivers
Single −0.002 −0.044*** −0.025 −0.056*** 0.014
(0.012) (0.013) (0.017) (0.019) (0.017)
Married −0.010 −0.025** −0.024* −0.008 0.022**
(0.009) (0.012) (0.013) (0.013) (0.011)
Difference 0.008 −0.019 0.000 −0.048** −0.007
(0.014) (0.018) (0.021) (0.023) (0.020) TANF
Single −0.030 −0.055** −0.052* −0.069** 0.037
(0.021) (0.025) (0.027) (0.031) (0.029)
Married 0.007 0.020 −0.025 −0.010 0.018
(0.014) (0.023) (0.023) (0.022) (0.024)
Difference −0.036 −0.075** −0.027 −0.059 0.019
(0.025) (0.034) (0.035) (0.039) (0.037) Number of observations
Single 54,787 56,165 53,902 54,045 54,743
Married 73,050 76,049 72,106 73,120 73,009
Prereform Mean
Single 0.692 0.725 0.703 0.648 0.255
Married 0.818 0.722 0.711 0.696 0.186
driving the results. For example, it is possible that increases in earnings disregards lead to increases in employment and income, which in turn leads to some improve-ment in self-rated health. Simultaneously, other, more punitive aspects of welfare reform may drive people off welfare and lead to losses in income and thus self-rated health. We explored models with separate TANF estimates for states with weak, mixed, and strong work incentives, as coded by Blank and Schmidt (2001) and used recently in Schoeni and Blank (2003).29 Those results, not shown here, are largely insignificant and provide no consistent pattern to help identify specific policy effects. It is possible that some other index of TANF severity/generosity would provide esti-mates more in line with expectations. However, in comparing four sets of analysts’ approaches to characterizing state sanction policies, Grogger, Karoly and Klerman (2002) find considerable disagreement: the four ratings agree for only 25 states; as an extreme example, Pennsylvania is characterized as lenient by two, moderate by one, and strict by the fourth. Except when there is a very strong theoretical reason to believe that a particular policy will affect a given outcome in a known direction, we are pessimistic that detailed characteristics of reforms can be profitably used in this fashion (Haider, Jacknowitz, and Schoeni 2003).
It is possible that the impacts of reform are, to some extent, capturing state trends in health that are correlated with state waiver and TANF implementation. To address this concern, we estimate DDD models with married women as a comparison group.30 The results for married women as well as the DDD estimates are provided in Table 4. The DDD results (provided in Row 3 for waivers and Row 6 for TANF) tell much the same story as that for black single women in isolation. While there are some differ-ences in statistical significance (in both directions), the general pattern of the results is a decline in health insurance coverage and health utilization.
Table 5 presents the results for single Hispanic women. Overall, the results for Hispanics show similar patterns to the results for blacks, with estimated effects being somewhat larger in magnitude. Using the DD model, waivers are associated with a (statistically significant) five percentage-point reduction in insurance coverage for sin-gle Hispanic women, and a (statistically insignificant) 2 percentage-point reduction in the DDD estimates. TANF is associated with a 9 (14) percentage point decline in insurance in the DD (DDD) estimates. Columns 2–4 in Table 5 show that waivers and TANF also lead to reductions in utilization for Hispanics, although the waiver effects are less consistent and are significant in the DDD models. For example, the DDD results suggest that waivers led to a 1 percentage point increase in checkups while TANF led to a 14 percentage point reduction, while waivers (TANF) led to a 4 (14) percentage point reduction in breast exams. The larger effects on utilization for TANF are consistent with the larger insurance effects of TANF for this group. More gener-ally, the relative magnitudes of the utilization effects compared with the insurance effects seem reasonable.
The estimates in Table 5 show that several of the estimates for the comparison group are significant. Some operate in the same direction as the expected effects of
Bitler, Gelbach, and Hoynes 329
29. Blank and Schmidt (2001) code strength of work incentives according to state-benefit generosity as well as state policies on sanctions, time limits, and work requirements.
reform (for example, negative impacts of waivers on utilization) and others operate in the opposite direction of reform (for example, an increase in any-coverage following TANF). The fact that there are significant estimates for the comparison group suggests that there are unmeasured state trends that are correlated with welfare reform. Of course, the DDD estimates are appropriate only if married women are a valid com-parison group.
Comparing the black and Hispanic results, the negative impacts of TANF are some-what larger for Hispanics (the DD waiver results are more similar). This is consistent with the descriptive evidence cited above on the sharp declines in public insurance coverage among immigrants. It is possible that this occurs because of changes in wel-fare and Medicaid policies for recent immigrants. We explore this possibility in two ways. We cannot use citizenship status (as in Borjas 2003) because we do not observe citizenship or immigrant status in the BRFSS. Instead, we reestimated the models in Table 5 adding interactions of the reform variables with the share of Hispanic women aged 20–45 in the state-year cell who are noncitizens (tables not shown here). These noncitizen shares were calculated from the 1990 Census and 1994-2000 CPS and may be regarded as rough estimates of the probability that a given Hispanic woman in the BRFSS sample is a recent immigrant.31While the interactions are rarely significant, their sign suggests that larger effects are present in states with a large share of non-citizen Hispanics. For example, the DD model in Table 5 shows that TANF is asso-ciated with a 9.2 percentage point reduction in any insurance coverage. In the interaction model, the estimated TANF reform effect for a hypothetical state with a noncitizen share of zero is −0.058. Every increase of one percentage point in the noncitizen share increases the magnitude of this negative effect by 0.00087. Thus a hypothetical state with a noncitizen share of one would have an estimated effect of
−0.145. We also experimented with adding a control for the state immigrant Medicaid “fill-in” programs that were examined by Borjas (2003) and Royer (2003).32Adding this variable, however, did not significantly affect the main coefficients of interest. The bottom line is that there is some limited evidence that the findings for Hispanics are explained by the noncitizen share across states. However, because of the lack of data in the BRFSS on citizenship or immigrant status, this finding is at most suggestive.
The final set of estimates for single women is presented in Table 6, where the sam-ple is all single women with a high school education or less. These results are quali-tatively similar to the results for black single women. The DD results show insignificant negative impacts on insurance and significant negative impacts on uti-The Journal of Human Resources
330
31. The share of women who are not citizens is constructed from the March CPS for 1994–2000, from the 1990 Census for 1990, and is a linear interpolation of the 1990 and 1994 values for intervening years. The March CPS does not provide data on citizenship status before 1994.
lization. The DDD results are very similar, although there is some loss in precision in some cases.33
C. Other State-Level Controls
Here we summarize, but do not report, the results on the other control variables in the insurance regression. For black single women, expanding Medicaid eligibility beyond AFDC-eligibility levels via 1931 plans is associated with an increase in any-coverage. The coefficient has the same sign for low-education single women but is insignificant and opposite-signed for Hispanic single women. Higher Medicaid poverty thresholds are associated with an (insignificant) increase in the probability of being insured for black single women. The effects are more mixed for the other groups but again are generally insignificant. The other economic and reform variables have no consistent association with insurance status and the demographic patterns are generally consis-tent with what one would expect. For details, see Bitler, Gelbach, and Hoynes (2004).
VII. Conclusion
This paper presents estimates of the impact of welfare reform on health insurance coverage and healthcare utilization during a time of fundamental change in welfare programs, falling AFDC/ TANF caseloads, and declines in Medi-caid participation. Despite policymakers’ evident interest in the insurance status and health of low-income families, to date we know little about how health-related vari-ables have been affected by recent state and federal welfare reforms.
We use BRFSS data covering the 1990–2000 period to examine these questions for single women ages 20–45. We estimate models separately for black, Hispanic, and low-education (high school education or less) subgroups. We examine the impact of state waivers and TANF implementation on health insurance, preventive healthcare utilization (such as checkups, breast exams, and Pap smears), and reports of having needed care but not having been able to afford it.
We present two empirical models for identifying the impacts of reform. We present DD estimates in which the effects of reform are identified through variation in the tim-ing and incidence of reform across states. To account for possible unobserved state trends in health that might be correlated with reform, we introduce a comparison group (married women) and also estimate DDD models.
The results are generally consistent across the different treatment groups and mod-els. We find that welfare reform is associated with a reduction in insurance coverage. Reform is also associated with a reduction in healthcare utilization, and an increase in the likelihood of needing care but finding it unaffordable. We find no statistically
Bitler, Gelbach, and Hoynes 331
significant effects of reform on health status. Overall, effects are somewhat larger in magnitude for TANF compared with state waivers, and somewhat larger in magnitude for Hispanics compared with blacks and low-education women.
References
Aizer, Anna, and Jeffrey Grogger. 2003. “Parental Medicaid Expansions and Health Insurance Coverage.” NBER Working Paper 9907.
Bennefield, Robert L. 1996. “A Comparative Analysis of Health Insurance Coverage Esti-mates: Data from the CPS and SIPP.” U.S. Bureau of the Census. Unpublished. Bitler, Marianne P., Jonah B. Gelbach, and Hilary Williamson Hoynes. 2003a. “Some
Evi-dence on Race, Welfare Reform and Household Income.” American Economic Review Papers and Proceedings93(2):293–98.
———. 2003b. “What Mean Impacts Miss: Distributional Effects of Welfare Reform Experiments.” NBER Working Paper 10121.
———. 2004. “Welfare Reform and Health.” NBER Working Paper 10549.
Blank, Rebecca M. 2002. “Evaluating Welfare Reform in the United States.” Journal of Economic Literature40(4):1105–66.
Blank, Rebecca M., and Lucie Schmidt. 2001. “Work, Wages, and Welfare.” In The New World of Welfare, ed. Rebecca M. Blank and Ron Haskins, 70–96. Washington D.C.: Brookings Institution.
Borjas, George. 2003. “Welfare Reform, Labor Supply, and Health Insurance in the Immigrant Population.” Journal of Health Economics22(6):933–58.
Busch, Susan H., and Noelia Duchovny. 2003. “Family Coverage Expansions: Impact on Insurance Coverage and Healthcare Utilization of Parents.” Unpublished.
Carpenter, Christopher. 2003. “The Impact of Employment Protection for Obese People.” Unpublished.
Crouse, Gilbert. 1999. “State Implementation of Major Changes to Welfare Policies 1992–1998.” http://aspe.hhs.gov/hsp/Waiver-Policies99/policy CEA.htm.
Currie, Janet, and Jeffrey Grogger. 2002. “Medicaid Expansions and Welfare Contractions: Offsetting Effects on Maternal Behavior and Infant Health.” Journal of Health Economics
21(2):313–35.
Currie, Janet, and Aaron Yelowitz. 2000. “Health Insurance and Less Skilled Workers.” In
Finding Jobs: Work and Welfare Reform, ed. David Card and Rebecca M. Blank, 233–61. New York: Russell Sage Foundation.
Danziger, Sandra K., Mary E. Corcoran, Sheldon Danziger, and Colleen M. Heflin. 2000. “Work, Income, and Material Hardship After Welfare Reform.” Journal of Consumer Affairs34(1):6–30.
Dee, Thomas S. 2001. “Alcohol Abuse and Economic Conditions: Evidence from Repeated Cross-Sections of Individual-Level Data.” Health Economics10(3):257–70.
Dee, Thomas S., and William N. Evans. 2001. “Teens and Traffic Safety.” In Risky Behavior Among Youths: An Economic Analysis, ed. Jonathan Gruber, 121–65. Chicago: The University of Chicago Press.
DeLeire, Thomas, Judith A. Levine, and Helen Levy. 2003. “Welfare Reform and the Un-insured.” University of Chicago. Unpublished.
Dion, M. Robin, and LaDonna Pavetti. 2000. “Access to and Participation in Medicaid and the Food Stamp Program: A Review of the Recent Literature.” Final Report to Administration for Children and Families, Department of Health and Human Services. Mathematica Policy Research.
The Journal of Human Resources
Ellwood, Marilyn R., and Kimball Lewis. 1999. “On and Off Medicaid: Enrollment Patterns for California and Florida in 1995.” Urban Institute Occasional Paper No. 27.
Evans, William N., Jeanne S. Ringel, and Diana Stech. 1999. “Tobacco Taxes and Public Policy to Discourage Smoking.” In Tax Policy and the Economy, Volume 13, ed. James Poterba, 1–55. Cambridge: MIT Press.
Fraker, Thomas, Christine Ross, Rita Stapulonis, Robert Olsen, Martha Kovac, M. Robin Dion, and Anu Rangarajan. 2002. “The Evaluation of Welfare Reform in Iowa: Final Impact Report.” Final report 8217–125 and 530. Mathematica Policy Research.
Garrett, Bowen, and John Holahan. 2000. “Health Insurance Coverage after Welfare.” Health Affairs19(1):175–84.
Greenberg, Mark. 1998. “Participation in Welfare and Medicaid Enrollment.” Kaiser Commission on Medicaid and the Uninsured. Unpublished.
Grogger, Jeffrey, Steven Haider, and Jacob A. Klerman. 2003. “Why Did the Welfare Rolls Fall During the 1990s? The Importance of Entry.” American Economic Review Papers and Proceedings93(2):288–92.
Grogger, Jeffrey, Lynn Karoly, and Jacob Klerman. 2002. “Consequences of Welfare Reform: A Research Synthesis.” RAND Working Paper DRU-2676-DHHS.
Grossman, Michael. 2001. “The Human Capital Model of the Demand for Health.” In
Handbook of Health Economics Volume 1A, ed. Joseph Newhouse and Anthony Culyer, 347–408. Amsterdam: Elsevier Science.
Gruber, Jonathan. 1997. “Health Insurance for Poor Women and Children in the U.S.: Lessons from the Past Decade.” In Tax Policy and Economy, Volume 11, ed. James Poterba, 169–211. Cambridge: MIT Press.
Gruber, Jonathan, and Jonathan Zinman. 2001. “Youth Smoking in the U.S.: Evidence and Implications.” In Risky Behavior Among Youths: An Economic Analysis, ed. Jonathan Gruber, 69–120. Chicago: The University of Chicago Press.
Haider, Steven, Alison Jacknowitz, and Robert F. Schoeni. 2003. “Welfare Work Require-ments and Child Well-being: Evidence from the Effects on Breast-feeding.” Demography
40(3):479–97.
Haskins, Ron. 2001. “Effects of Welfare Reform at Four Years.” In For Better and For Worse: Welfare Reform and the Well-Being of Children and Families, ed. Greg Duncan and P. Lindsay Chase-Lansdale, 264–89. New York: Russell Sage Foundation.
Heckman, James, and Richard Robb. 1985. “Alternative Methods for Evaluating the Impact of Interventions.” In Longitudinal Analysis of Labor Market Data,ed. James Heckman and Burton Singer, 156–245. New York: Cambridge University Press.
Kaestner, Robert, and Neeraj Kaushal. 2003. “Welfare Reform and Health Insurance Coverage of Low Income Families.” Journal of Health Economics22(6):959–81.
Kaestner, Robert, and Won Chan Lee. 2003. “The Effect of Welfare Reform on Prenatal Care and Birth Weight.” NBER Working Paper 9769.
Kaestner, Robert, and Elizabeth Tarlov. 2003. “Changes in the Welfare Caseload and the Health of Low-Educated Mothers.” NBER Working Paper 10034.
Klein, Rachel, and Cheryl Fish-Parcham. 1999. “Losing Health Insurance: The Unintended Consequences of Welfare Reform.” Washington D.C.: Families USA Foundation. Ku, Leighton, and Brian Bruen. 1999. “The Continuing Decline in Medicaid Coverage.”
Urban Institute Working Paper A–37.
Ku, Leighton, and Bowen Garrett. 2000. “How Welfare Reform and Economic Factors Affected Medicaid Participation: 1984–1996.” Urban Institute Working Paper 00-01. Loprest, Pamela. 1999. “Families Who Left Welfare: Who Are They and How Are They
Doing?” Urban Institute Working Paper 99-02.
Meyer, Bruce D., and Dan T. Rosenbaum. 2000. “Making Single Mothers Work: Recent Tax and Welfare Policy and Its Effects.” National Tax Journal546(4.2):1027–61.
Moffitt, Robert. 2002. “Welfare Programs and Labor Supply.” NBER Working Paper 9168. Morris, Pamela, Aletha Huston, Greg Duncan, Danielle Crosby, and Johannes Bos. 2001.
How Welfare and Work Policies Affect Children: A Synthesis of the Literature. New York: Manpower Demonstration Research Corporation.
Nathan, Richard, and Frank Thompson. 1999. “The Relationship Between Welfare Reform and Medicaid: A Preliminary View.” Unpublished.
Royer, Heather. 2003. “Do Rates of Health Insurance Coverage and Healthcare Utilization Respond to Changes in Medicaid Eligibility Requirements? Evidence from Pregnant Immigrant Mothers.” Unpublished.
Ruhm, Christopher. 2000. “Are Recessions Good for Your Health?” Quarterly Journal of Economics115(2):617–50.
Ruhm, Christopher, and William Black. 2002. “Does Drinking Really Decrease in Bad Times?” Journal of Health Economics21(4):659–78.
Schoeni, Robert, and Rebecca Blank. 2003. “Changes in the Distribution of Child Well-Being over the 1990s.” American Economic Review Papers and Proceedings93(2):304–308. Swartz, Katherine. 1986. “Interpreting the Estimates from Four National Surveys of the
Number of People without Health Insurance.” Journal of Economic and Social Measurement14(3):233–43.
———. 1997. “Changes in the 1995 CPS and Estimates of Health Insurance Coverage.”
Inquiry34(1):70–79.
Tumlin, Karen C., Wendy Zimmerman, and Jason Ost. 1999. “State Snapshots of Public Benefits for Immigrants: A Supplemental Report to ‘Patchwork Policies’.” Urban Institute Occasional Paper 24, Supplemental Report.
Tweedie, Jack. 2001. “Sanctions and Exits: What States Know about Families that Leave Welfare Because of Sanctions and Time Limits.” In For Better and For Worse: Welfare Reform and the Well-Being of Children and Families, ed. Greg Duncan and P. Lindsay Chase-Lansdale, 81–100. New York: Russell Sage Foundation.
U.S. Bureau of the Census. 1994. Phoneless in America. Statistical Brief 94–16.
U.S. Department of Health and Human Services. 2002. U.S. Welfare Caseloads Information. http://www.acf.dhhs.gov/news/stats/newstat2.html.
The Journal of Human Resources