Employment
Analysis and
Research Unit
Economic and
Labour Market
Analysis
Department
Employment Sector
Employment Working Paper No.
151
2013
Miguel Jaramillo
Employment growth
and segmentation in Peru,
2001–2011
Employment Sector
Employment Working Paper No. 151
2013
Employment growth and
segmentation in Peru, 2001-2011
Country case study on labour market
segmentation
Miguel Jaramillo
Employment Analysis and Research Unit
ii
Copyright © International Labour Organization 2013 First published 2013
Publications of the International Labour Office enjoy copyright under Protocol 2 of the Universal Copyright Convention. Nevertheless, short excerpts from them may be reproduced without authorization, on condition that the source is indicated. For rights of reproduction or translation, application should be made to ILO Publications (Rights and Permissions), International Labour Office, CH-1211 Geneva 22, Switzerland, or by email: [email protected]. The International Labour Office welcomes such applications.
Libraries, institutions and other users registered with reproduction rights organizations may make copies in accordance with the licences issued to them for this purpose. Visit http://www.ifrro.org to find the reproduction rights organization in your country.
ILO Cataloguing in Publication Data
Jaramillo, Miguel
Employment growth and segmentation in Peru, 2001-2011: country case study on labour market segmentation / Miguel Jaramillo; International Labour Office, Employment Sector, Employment Analysis and Research Unit, Economic and Labour Market Analysis Department. - Geneva: ILO, 2013
Employment working paper ; No.151; ISSN 1999-2939; 1999-2947 (web pdf)
International Labour Office; Employment Sector
employment / employment security / labour market segmentation / Peru
13.01.3
The designations employed in ILO publications, which are in conformity with United Nations practice, and the presentation of material therein do not imply the expression of any opinion whatsoever on the part of the International Labour Office concerning the legal status of any country, area or territory or of its authorities, or concerning the delimitation of its frontiers. The responsibility for opinions expressed in signed articles, studies and other contributions rests solely with their authors, and publication does not constitute an endorsement by the International Labour Office of the opinions expressed in them. Reference to names of firms and commercial products and processes does not imply their endorsement by the International Labour Office, and any failure to mention a particular firm, commercial product or process is not a sign of disapproval. ILO publications and electronic products can be obtained through major booksellers or ILO local offices in many countries, or direct from ILO Publications, International Labour Office, CH-1211 Geneva 22, Switzerland. Catalogues or lists of new publications are available free of charge from the above address, or by email: [email protected]
Visit our website: http://www.ilo.org/publns
iii
Preface
The primary goal of the ILO is to contribute, with member States, to achieve full and productive employment and decent work for all, including women and young people, a goal embedded in the ILO Declaration on Social Justice for a Fair Globalization (2008),1 and which has now been widely adopted by the international community. The integrated approach to do this was further reaffirmed by the 2010 Resolution concerning employment policies for social justice and a fair globalization.2
In order to support member States and the social partners to reach this goal, the ILO pursues a Decent Work Agenda which comprises four interrelated areas: Respect for fundamental worker’s rights and international labour standards, employment promotion, social protection and social dialogue. Explanations and elaborations of this integrated approach and related challenges are contained in a number of key documents: in those explaining the concept of decent work,3 in the Employment Policy Convention, 1964 (No. 122), in the Global Employment Agenda and, as applied to crisis response, in the Global Jobs Pact adopted by the 2009 International Labour Conference in the aftermath of the 2008 global economic crisis.
The Employment Sector is fully engaged in supporting countries placing employment at the centre of their economic and social policies, using these complementary frameworks, and is doing so through a large range of technical support and capacity building activities, policy advisory services and policy research. As part of its research and publications programme, the Employment Sector promotes knowledge-generation around key policy issues and topics conforming to the core elements of the Global Employment Agenda and the Decent Work Agenda. The Sector’s publications consist of books, monographs, working papers, employment reports and policy briefs.
The Employment Working Papers series is designed to disseminate the main findings of research initiatives undertaken by the various departments and programmes of the Sector. The working papers are intended to encourage exchange of ideas and to stimulate debate. The views expressed are the responsibility of the author(s) and do not necessarily represent those of the ILO.
José Manuel Salazar-Xirinachs Executive Director
Employment Sector
1 See http://www.ilo.org/public/english/bureau/dgo/download/dg_announce_en.pdf.
2 See http://www.ilo.org/public/libdoc/ilo/2010/110B09_108_engl.pdf.
3 See the successive Reports of the Director-General to the International Labour Conference:
v
Foreword
One of the key features of the labour market developments observed during the past decades throughout the world relates to a phenomenon of labour market segmentation, e.g. the division of the labour market into separate submarkets or segments, distinguished by different characteristics and behavioural rules. To a large extent, these attributes depend on the specific environment in which workers operate. Segmentation may arise from particularities of labour market institutions, such as contractual arrangements (permanent versus temporary employment), their enforcement (and the resulting informality), as well as types of workers concerned (such as migrant, domestic, or dispatch workers).
While the phenomenon is not new, the job crisis has brought an increasing attention to the segmentation/duality issue, especially in Europe. The implications and costs of segmentation are multiple, in both economic and social terms: they include wage gaps between segments, differences in access to training and social security, as well as in working conditions or tenure. Moreover, segmentation implies limited transitions to better jobs. The consequences of segmentation also have macroeconomic implications, such as lower productivity and higher employment volatility.
In this context, and as part of its objective of promoting decent work, the ILO launched, in 2012, a research programme to better understand how labour market institutions affect employment outcomes in both quantitative and qualitative terms. One of the main motivations of the research project is to put job quality at the forefront of the policy debates, informing the main stakeholders in the world of work of the extent of labour market segmentation and its implications for job quality in selected countries. Fourteen country studies on labour market segmentation and job quality were provided by external country experts, as well as thematic papers on job quality in segmented labour markets and the role of labour law, collective bargaining, and improved enforcement. These studies were discussed in a scientific Workshop held at the ILO in December 2012 and used as thematic inputs in a policy-oriented Workshop held at the ILO in April 2013.
The current paper is one in the series of such country studies. It makes an important contribution to the discussion on segmentation of labour markets, providing an overview of the institutional setup as well as empirical evidence on the extent of segmentation and its implications for various aspects of job quality. The paper also offers a policy perspective on the ways to alleviate the negative consequences of segmentation.
Sandrine Cazes, Corinne Vargha,
Chief of Industrial and Employment
Employment Analysis and Research Unit Relations Department Economic and Labour Market Analysis
vii
Contents
Page
Preface ... iii
Foreword ... v
1. Introduction ... 1
2. Main characteristics of the Peruvian labour market ... 3
2.1 Labour supply: Demographic trends and the labour market ... 3
2.2. Labour demand ... 6
2.3. The structure of the Peruvian labour market ... 10
2.4. Informality ... 12
3. Employment security and quality... 18
4. The institutional setting of the Peruvian labour market ... 28
4.1. Employment protection legislation ... 28
4.2. Employment contracts: The evolution of fixed-term contracts ... 31
4.3. Nonwage costs ... 32
4.4. Special regimes: Micro and small enterprises ... 34
4.5. On the link between the institutional setting and market outcomes ... 34
5. Conclusions ... 38
References ... 39
List of figures Figure 1 Infant mortality and fertility (trends and projections, 1950-2050)... 3
Figure 2 Age structure of the population and dependency ratio (trends and projections, 1950-2050) ... 4
Figure 3 Age structure of the population and working age population (2001-2010) ... 4
Figure 4 Dependency ratio and average household size (2001-2010) ... 5
Figure 5 Working age population, participation rate and employment rate, by area (2001-2010) ... 5
Figure 6 Labour force and participation rate (2001-2010) ... 6
Figure 7 Participation rate (2001-2010) ... 7
Figure 8 Occupied labour force (2001-2010) ... 7
Figure 9 GDP and employment growth (2001-2010) ... 8
Figure 10 Employment rate (2001-2010) ... 9
viii
Figure 12 Underemployment and adequate employment (2001-2010) ... 10
Figure 13 Structure of employment, by occupational categories (2001-2010) ... 11
Figure 14 Structure of the dependent labour force, by size of firm (2001-2010) ... 11
Figure 15 Occupied labour force by formality (2001-2010) ... 14
Figure 16 Structure of employment by formality (2001-2010) ... 14
Figure 17 Share of informal workers by gender (2001-2010) ... 14
Figure 18 Composition of the informal labour force, by age group (2001-2010) ... 15
Figure 19 Composition of the informal labour force, by level of education (2001-2010) ... 16
Figure 20 Composition of the urban labour market by type of contract (2001-2010)... 18
Figure 21 Share of informal workers by type of contract (2001-2010) ... 19
Figure 22 Pension affiliation (2001-2010) ... 21
Figure 23 Pension affiliation, by formality (2001-2010) ... 22
Figure 24 Distribution of employment duration (2004 and 2010) ... 22
Figure 25 Average employment duration in years (2004-2010) ... 23
Figure 26 Employment duration by age (2004 and 2010) ... 24
Figure 27 Incomplete unemployment duration (2001-2010)... 24
Figure 28 Incomplete unemployment duration (2001-2010)... 25
Figure 29 Labour earnings (2001-2009, urban)... 25
Figure 30 Labour earnings (2001-2009) ... 26
Figure 31 Labour earnings by income quintile (2001-2009) ... 26
Figure 32 Evolution of nonwage costs (1987-2001) ... 32
List of tables Table 1 Definitions of informality………. 13
Table 2 Determinants of being informal, probit marginal effects……… 16
Table 3 Mobility matrices, 2002-2003 and 2008-2009 ……… 17
Table 4 Determinants of having a fixed-term contract, probit marginal effects ……… 20
Table 5 Job quality gaps according to formal/informal and open ended/temporary contract segments ……… 21
Table 6 Evolution of severance payment legislation rules……… 29
Table 7 Protection system at the event of a dismissal………... 30
Table 8 Evolution of the CTS (Compensation for Time of Service)……… 30
Table 9 Types of fixed term contracts……… 31
Table 10 Nonwage costs in Peru……….. 33
Table 11 Micro and small enterprises……….. 34
1
1. Introduction
4Labour market segmentation is the division of labour markets into separated submarkets, distinguished by different characteristics and behavioural rules. In the case of Peru, labour market segmentation presents itself clearly in the shape of formal and informal labour arrangements. After several decades of debate, informality is still a central policy issue in Latin American countries. Informality imposes costs on society in the form of a small tax revenue base and unfair competition, which tend to translate into lower economic growth. In labour markets, informality is a major concern as workers from the informal sector suffer from lack of employment protection and access to social security. In addition to this form of segmentation, within formal contractual arrangements, there is the divide between those with open-ended contracts, which the law assumes as the general labour contract, and those with fixed-term contracts, which is in fact the contractual type that has increased the most in the last decade.
During the last decade Peru’s labour market has seen fast growth in both employment and earnings. Employment has grown at an average rate of 2.8per cent annually. Labour earnings have increased at an annual rate of 5.3 per cent. Both wage labour and independent workers have seen their earnings increase. This good performance raises a number of questions regarding the traditional duality observed in Peru’s labour market. Has this positive cycle impacted on labour formality? How did the duality formal/informal evolve in this context? What are their implications on job quality? What role has labour market regulation had in this context?
This study aims to identify how the performance of the labour market, and labour market institutions and policies have affected labour market segmentation in the last decade. It also provides evidence on what labour market duality means in terms of job quality indicators. To do so, we use household survey data for the period 2001-2010 to analyse labour market trends as well as employment quantity and quality indicators. This information is disaggregated by demographic characteristics with the purpose of identifying which groups are more affected by different policies, trends or programmes. Job security is approached through a series of indicators, such as type of contract and length of the employment period. Finally, the effects of regulations on these indicators are considered.
Results show that, within a challenging demographic context, Peru’s labour market has responded quite positively as employment has outpaced the growth in the labour force, resulting in a reduction in both unemployment and underemployment rates, as well as improvements in a number of job quality indicators. This positive performance has allowed for a reduction in the size of the informal sector. Further, mobility from informal to formal employment is more frequent than a decade ago. However, segmentation continues to be a salient feature of the labour market, as employment in microfirms has continued to grow, though not as much as in larger firms, and access to social security is still far from ideal. Further, growth in fixed-term contracts puts the spotlight in another form of segmentation.
4
2
3
2. Main characteristics of the Peruvian labour market
52.1 Labour supply: Demographic trends and the labour market
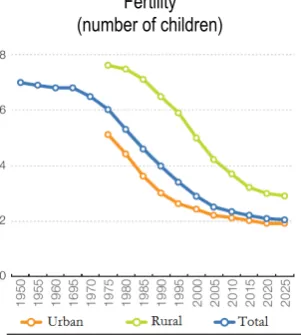
Presently Peru is well into its demographic transition, having gone from high to low mortality rates and, subsequently, from high to low fertility rates. Figure 1 presents the infant mortality and fertility trends and projections for periods 2050 and 1950-2025, respectively. We can observe that infant mortality has declined sharply since the fifties. Fertility, on the other hand, has decreased noticeably since mid-seventies until present. Thus, Peru has followed the classic pattern of the demographic transition, the fertility decline coming after the mortality decline.
Figure 1 Infant mortality and fertility (trends and projections, 1950-2050)
Infant mortality (per 1,000 live births)
Fertility (number of children)
These significant changes have transformed the age structure of the population. Figure 2 illustrates such changes and its projections for the next forty years. One pattern emerges quite clearly: the share of those aged between 15 and 64 – the working age population – has been increasing since the seventies and projections tell us that this trend will continue for the following forty years. Also, as a result of both natural aging and longer life expectancy, the elderly group is increasing its share in the total population, while the share of the population under 15 years old has decreased. As a consequence of these demographic changes, the dependency ratio, defined as the ratio of the number of individuals aged below 15 or above 64 and the number of working age individuals, shows a declining trend. This situation presents Peru with a temporary window of opportunity for enhancing economic growth, as both tendencies should expand labour supply. On the other hand, this scenario challenges the capacity of the labour market to generate enough jobs to absorb the increasing labour force.
5
4
Figure 2 Age structure of the population and dependency ratio (trends and projections, 1950-2050)
Age structure of the population Dependency ratio
Such long-run trends are perceptible in the most recent decade. Figure 3 presents the age structure of the population and the working age population for the period 2001-2010. On the left hand side, we can observe that the share of those aged 25-65 increased during the whole period, while the share of those below 15 years old decreased. On the other hand, the share of individuals aged 15-24 years old slightly declined (1 percentage point) and that of individuals aged over 65 marginally increased throughout the period. Consequently, the working age population shows an upward trend, increasing its size in more than 4 million people and its share in total population in 5.7 percentage points in the last decade. This situation poses a tremendous challenge to the labour market, which must either allocate this contingent to productive activities or present society with rising unemployment.
Figure 3 Age structure of the population and working age population (2001-2010)
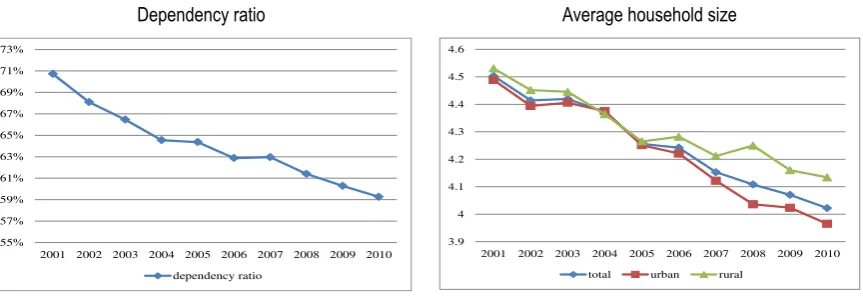
Additional consequences of these demographic changes, in line with our longer-term results, are a declining trend in the demographic dependency ratio, going from 0.71 in 2001 to 0.59 in 2010 (see Figure 4), and an also declining average household size. These changes present a unique opportunity for households to increase their savings, invest in human capital, and secure better conditions for their old age and higher standards of living for their children. Thus the two faces of the demographic transition: a window of opportunity for households and greater pressure on the labour market.
Age structure of the population Working age population
Source: ENAHOs 2001-2010. Elaboration: own.
65% 66% 67% 68% 69% 70% 71% 72% 73% 74% 75%
17000 18000 19000 20000 21000 22000 23000
5
Figure 4 Dependency ratio and average household size (2001-2010)
Dependency ratio Average household size
55% 57% 59% 61% 63% 65% 67% 69% 71% 73%
2001 2002 2003 2004 2005 2006 2007 2008 2009 2010 dependency ratio
Source: ENAHOs 2001-2010. Elaboration: own.
3.9 4 4.1 4.2 4.3 4.4 4.5 4.6
2001 2002 2003 2004 2005 2006 2007 2008 2009 2010 total urban rural
Source: ENAHOs 2001-2010. Elaboration: own.
Figure 5 presents the evolution of the working age population, the participation rate and the employment rate by geographical area. It is clear that the urban and rural markets are quite different. Working age population in rural areas is proportionately smaller than in urban areas, which implies that the dependency ratio is higher. The participation and employment rates in rural areas are also considerably higher than in urban areas, as unemployment is virtually non-existent (0.8 per cent in 2010). This is so because employment in rural areas has a quite different dynamic than in urban areas. In rural areas, for example, many household members with no working contract may consider themselves as employed as they work in the family land or help during sowing or harvest periods. Also, labour regulations are rarely enforced and informality is widespread in rural areas.
Figure 5 Working age population, participation rate and employment rate, by area (2001-2010)
Working age population Participation rate
45% 50% 55% 60% 65% 70% 75% 80%
2001 2002 2003 2004 2005 2006 2007 2008 2009 2010 Total Urban Rural
Source: ENAHOs 2001-2010. Elaboration: own.
45% 50% 55% 60% 65% 70% 75% 80% 85%
2001 2002 2003 2004 2005 2006 2007 2008 2009 2010 Total Urban Rural
Source: ENAHOs 2001-2010. Elaboration: own. Employment rate 45% 50% 55% 60% 65% 70% 75% 80% 85%
2001 2002 2003 2004 2005 2006 2007 2008 2009 2010 Total Urban Rural
6
2.2. Labour demand
How has the labour market responded to these challenges? Increasing participation rate means increasing labour supply, but how has the demand side responded? Is the labour market absorbing the increasing labour force or is unemployment rising?
Figure 6 presents the evolution of the Economically Active Population in absolute terms and in relative terms, the latter being the participation rate. As expected, because of the growth of the working age population described above, the EAP presents an upward trend in absolute terms. The participation rate has also presented an upward trend possibly associated to the economic expansion in the period. Thus, during the expansion period not only did the share of working age population increased, but also did the fraction of the population that is economically active.
Figure 7 presents the participation rate disaggregated by age groups, by level of education and by gender. During the period of analysis, participation rate has increased for all three age groups, though it has been more pronounced among the elderly group (7.5 percentage points vs. 6.6 percentage points for the young population and in 5.7 percentage points for the adult population). Regarding the evolution of the participation rate according to gender, not only the participation rate of women increased (in 8.3 percentage points), but also that of men (4.3 percentage points). Finally, when the level of education is taken into account, the increase in the participation rate seems to be relatively similar between groups, though it has increased the most among those with secondary education (5.8 percentage points) followed by those with tertiary education (4.9 percentage points).
Figure 6 Labour force and participation rate (2001-2010)
65% 66% 67% 68% 69% 70% 71% 72% 73% 74% 75%
11000 12000 13000 14000 15000 16000 17000
2001 2002 2003 2004 2005 2006 2007 2008 2009 2010
thousands % of working age population
7
Figure 7 Participation rate (2001-2010)
By age groups By gender
30% 40% 50% 60% 70% 80% 90%
2001 2002 2003 2004 2005 2006 2007 2008 2009 2010
15-24 years old 25-65 years old 66 years old or more
Source: ENAHOs 2001-2010. Elaboration: own.
50% 55% 60% 65% 70% 75% 80% 85%
2001 2002 2003 2004 2005 2006 2007 2008 2009 2010
men women
Source: ENAHOs 2001-2010. Elaboration: own.
By level of education
60% 65% 70% 75% 80% 85%
2001 2002 2003 2004 2005 2006 2007 2008 2009 2010 no level/primary secondary tertiary
Source: ENAHOs 2001-2010. Elaboration: own.
Figure 8 shows that the labour demand has responded adequately to the expansion of labour supply. We observe that both the size of the labour force and the proportion of the working age population that is occupied – that is, the employment rate – have increased steadily during the economic boom. The increment is considerable: 6.9 percentage points, greater than the increase in the labour supply (5.9 percentage points).
Figure 8 Occupied labour force (2001-2010)
62% 63% 64% 65% 66% 67% 68% 69% 70% 71% 72% 10000 11000 12000 13000 14000 15000 16000
2001 2002 2003 2004 2005 2006 2007 2008 2009 2010
thousands % of working age population
8
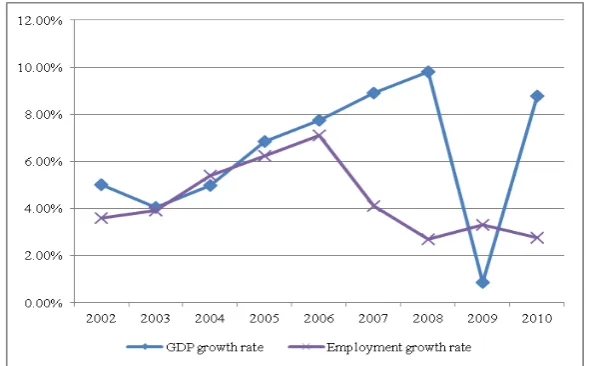
Overall, employment growth is closely associated to GDP growth, as Figure 9 shows. Do note, however, that the sharp decline in GDP growth in 2009, due to the international crisis, did not translate in a reduction in the employment growth rate. Elasticity of employment to GDP growth over this period has been close to 1.
Figure 9 GDP and employment growth (2001-2010)
Source: INEI and Central Bank of Peru. Elaboration: Own.
9
Figure 10 Employment rate (2001-2010)
By age groups By gender
30% 40% 50% 60% 70% 80% 90%
2001 2002 2003 2004 2005 2006 2007 2008 2009 2010
15-24 years old 25-65 years old 66 years old or more
Source: ENAHOs 2001-2010. Elaboration: own.
45% 50% 55% 60% 65% 70% 75% 80% 85%
2001 2002 2003 2004 2005 2006 2007 2008 2009 2010
men women
Source: ENAHOs 2001-2010. Elaboration: own.
By level of education
50% 55% 60% 65% 70% 75% 80%
2001 2002 2003 2004 2005 2006 2007 2008 2009 2010
no level/primary secondary tertiary
Source: ENAHOs 2001-2010. Elaboration: own.
10
Figure 11 Unemployment rate (2001-2010)
0% 1% 2% 3% 4% 5% 6%
2001 2002 2003 2004 2005 2006 2007 2008 2009 2010
Total Men Women
Source: ENAHOs 2001-2010. Elaboration: own.
Figure 12 Underemployment and adequate employment (2001-2010)
2.3. The structure of the Peruvian labour market
Now that we have assessed the quantity and evolution of employment in Peru, we will analyse the structure of the urban labour market. For this, we focus on the structure of the urban occupied labour force by type of job, type of firm (in terms of the number of employees) and by formality. The focus is on the urban labour market for two main reasons: (i) the urban labour market concentrates most of Peru’s labour force and (ii) regulation has a greater impact on urban labour markets.6 Consequently, the urban labour
market provides a better focus to analyse segmentation.
As Figure 13 shows, there have been only slight changes in the structure of employment by occupational category. During the economic growth period, the share of non-remunerated family workers and independent workers fell (2 and 1 percentage
11
points, respectively), while the percentage of wage earners and employers increased (neither in more than 2 percentage points). Employees in 2010 were 50 per cent of the total occupied labour force, while employers were little more than 6 per cent. However, independent workers, domestic workers and non-remunerated family workers still represent almost 45 per cent of the total occupied labour force.
Figure 13 Structure of employment, by occupational categories (2001-2010)
Source: ENAHOs 2001-2010. Elaboration: own.
Focusing on the salaried workforce, Figure 14 presents the evolution of its structure by size of firm. As it is well known, most of these workers are employed in small firms (70 per cent works in firms with 10 employees or less), while about 20 per cent works in firms with more than 100 employees. Median size firms (11-100 employees) are a very small fraction of the structure by firm size. In fact, Peru’s firm size structure does not resemble a pyramid as most developed economies. However, the structure has undergone significant changes since 2001, as the fraction of workers in small firms has shrunk by 4 percentage points while those in larger firms have grown in 3 per cent.
Figure 14 Structure of the dependent labour force, by size of firm (2001-2010)
0% 20% 40% 60% 80% 100%
2001 2002 2003 2004 2005 2006 2007 2008 2009 2010
10 employees or less 11-50 employees
51-100 employees More than 100 employees
Source: ENAHOs 2001-2010. Elaboration: own.
12
2.4. Informality
When analysing the structure of the occupied labour force by formality, we face the problem of which definition of informality to use. In effect, there is more than one standard definition of informality and each of these definitions focuses on different aspects of the concept.
The concept of informality was introduced by Keith Hart in 1970 and was first published by the ILO in 1972. The first official definition of informality was introduced in 1982 by the International Conference of Labour Statisticians and considered the following groups as informal: a) professional own account workers, b) non-remunerated family workers, c) dependent employees in private firms with less than 5 workers, and d) domestic workers. In 1993, the conference introduced a new definition that focused on the legal aspects of the institution where the worker was employed. In the late nineties, ILO started associating the concept with the notion of “decent work”, which includes four dimensions: rights, employment, social protection and dialogue.
Since 2002, the ILO recommended the use of the term “informal economy” to replace the spread use of the term “informal sector”. The informal economy concept included “especially vulnerable” workers. Vulnerable workers are defined as those workers that are not protected by the regulatory system or who lack employment protection. In 2003 the conference also approved a directive that includes a statistical definition of informal employment. According to this last directive, enterprises can be classified as formal if they comply with any of a number of conditions, such as firm size in terms of employment (the threshold to be determined according to national circumstances), and/or registration condition under specific forms contemplated in the national legislation.
From this description, we can see that informality may include a series of aspects. Unfortunately, most of the definitions are only useful in identifying some of these aspects. When looked into, we found that using, for example, a definition based in the size of the firm in terms of employment may not allow us to identify the government progress in terms of formalizing small firms. In a similar way, using a definition of informality focused on the level of vulnerability of the worker may not work when the government promotes social protection systems that are no longer attached to employment.
Given these limitations, we chose to use two definitions of formality in hope that we could identify the most important aspects of the concept. The first definition used focuses on the conception of informality as labour outside the modern industrial sector (informal sector employment) while the second definition focuses on the conception of informal labour as the absence of social benefits (informal employment).
The first definition (Definition 1) is associated to the traditional definition stated by the ILO in 1982. It considers two kinds of workers: wage earners and independent workers. Wage earners are categorized as informal if the firm where they work is informal. According to these criteria, private enterprises are regarded as informal if they have less than 10 workers. Informal independent workers are defined as independent workers with no tertiary education.
13
Table 1 Definitions of informality
Definition 1 Definition 2
Wage Earners
Are informal if they work in firms with 10 workers or
less. Are informal if they have no access to health benefits. Domestic workers and NRFW are always informal.
Independent Workers
Are informal if they have no tertiary education.
Figure 15 presents the level of informality in urban areas using Definition 1 and Definition 2.7 As the figure shows, informality (using either of the definitions) is a serious problem in urban areas, as it is a condition presented by 60 per cent of the total urban occupied labour force (almost 70 per cent according to Definition 2). Informality is higher using the definition based on social benefits (Definition 2) and has also decreased the most according to this definition (2.6 percentage points in Definition 1 vs. 5.2 percentage points in Definition 2). According to Definition 2, informality has fallen more steeply since 2005, which suggests that recent efforts to improve health insurance coverage as employment benefits have been relatively effective.
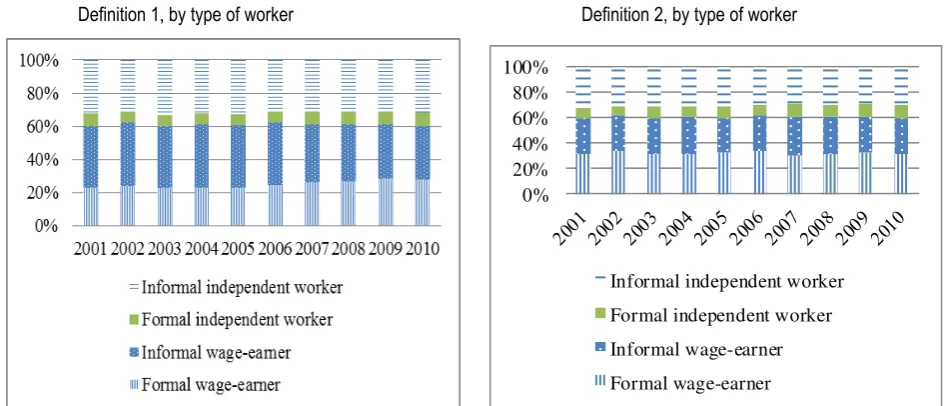
Figure 16 presents the evolution of the structure of the labour force dividing it in four groups: formal wage earners, informal wage earners, formal independent workers and informal independent workers. Most of the independent workers and employees are informal, though informality is higher among independent workers. The left hand side panel (Definition 1) shows a decline in the share of informal wage labour while the proportion of the independent workers has been stable through the decade. This is likely associated to the increase in employment in larger firms. Contrastingly, the right hand side (Definition 2) shows a slight increase in the share of formal independent workers while formal wage earners have a stable share of the workforce.
7
14
Figure 15 Occupied labour force by formality (2001-2010)
0% 10% 20% 30% 40% 50% 60% 70% 80%
2001 2002 2003 2004 2005 2006 2007 2008 2009 2010
Informal 1 Informal 2
Source: ENAHOs 2001-2010. Elaboration: own.
Figure 16 Structure of employment by formality (2001-2010)
Definition 1, by type of worker Definition 2, by type of worker
In 2010 women represented 50 per cent of the informal labour force, which is worrying as they only represent 44 per cent of the total labour force. Figure 17 shows that informality affects women more than men, no doubt because of their greater presence in small firms and independent workers.
0% 20% 40% 60% 80% 100%
Informal independent worker
Formal independent worker
Informal wage-earner
Formal wage-earner
15
Figure 17 Share of informal workers by gender (2001-2010)
Figure 18 shows that youth is also over represented among the informal workforce. So is the elder population. According to Definition 1, the informality problem is higher among the over-65 age group, as more than 80 per cent of the age group occupied population is informal, while informality is less severe among the 25 to 65 age group. These results change significantly when applying the second informality definition, as the group most affected seems to be the under-25 age group. This may be so as people in the younger group may be more likely to accept jobs with no health benefits. Figure 19 shows the composition of the informal labour force by educational level. Results suggest that informality is associated with the education level: the more educated, the less likely to be informal.
Figure 18 Composition of the informal labour force, by age group (2001-2010)
0% 10% 20% 30% 40% 50% 60% 70% 80% 90% 100%
Total Urban Labour Force
Informal Labour Force - Definition 1
Informal Labour Force - Definition 2
15-24 years old 25-65 years old 66 years old or more
Source: ENAHOs 2001-2010. Elaboration: own.
Definition 1 Definition 2
40% 45% 50% 55% 60% 65% 70% 75% 80%
2001 2002 2003 2004 2005 2006 2007 2008 2009 2010
% of Occupied Men % of Occupied Women
Source: ENAHOs 2001-2010. Elaboration: own.
40% 45% 50% 55% 60% 65% 70% 75% 80%
2001 2002 2003 2004 2005 2006 2007 2008 2009 2010
% of Occupied Men % of Occupied Women
16
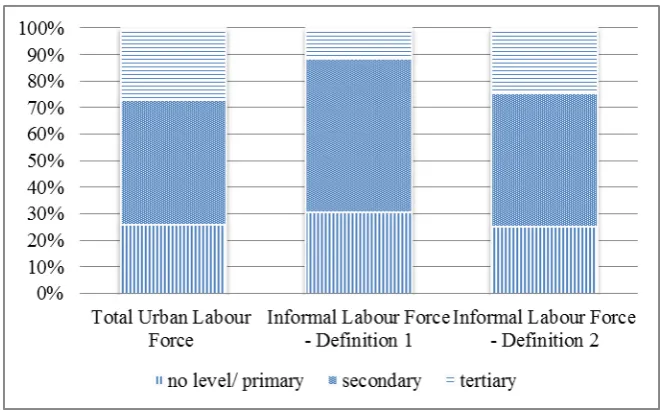
Figure 19 Composition of the informal labour force, by level of education (2001-2010)
Source: ENAHOs 2001-2010. Elaboration: own.
Table 2 shows the results of a probit regression estimated to identify which factors affect the formality status using Definition 1, conditional on being employed. We find that male workers are less likely to be informal, as well as workers with higher educational levels than primary education. Prime-age workers are also less likely to be in the informal sector than youth (base group). Contrastingly, the over-65 age group is more likely to be in the informal sector. Also, independent workers are more likely to be informal that wage workers. Finally, as expected, results indicate that being affiliated to a pension system correlates negatively with being in the informal sector.
Table 2 Determinants of being informal, probit marginal effects
Equation Variables Marginal Effects
INFORMAL Male -0.0634*** (0.00610)
Secondary education -0.0677*** (0.00837) Tertiary education -0.405*** (0.00767)
Age 25-44 -0.0281*** (0.00770)
Age 45-64 -0.0128 (0.00892)
Age 65> 0.0960*** (0.0154)
Self-employed 0.101*** (0.00641) Affiliated to pension system -0.225*** (0.00579)
N 28,914
Standard errors in parentheses; *** p<0.01, ** p<0.05, *
17
One important question to assess segmentation is how much mobility there is between a formal and an informal condition (i.e., with and without social security) and how has it changed with the recent economic expansion. In order to address this question, we exploit the panel structure of the Permanent Employment Survey for Metropolitan Lima, the country’s largest labour market, to construct mobility matrices.8
Table 3 presents mobility matrices for two periods, at the beginning and at the end of the decade, 2002-2003 and 2008-2009. Each row tells us the distribution in the second observation period of those that were in each category in the first observation period. Three features of formal-informal dynamics stand out. First, formal workers tend to stay formal and that has not changed much over time. Second, this is much less so for informal or self-employed workers, a significant portion of which (10 to 14 per cent) tend to switch between these two sectors. Moves from self-employment to informal employment have declined over the period, however. Third, moves from informal to formal have more than doubled over the two periods, from 6 to 15.4 per cent, while a smaller portion of informal workers stay informal from one period to the next. This evidence suggests that economic growth has reduced the probability of informal workers to stay informal and weakened labour market segmentation in Peru.
Table 3 Mobility matrices, 2002-2003 and 2008-2009
Formal Informal Self-employed
Formal 92,4% 3,8% 3,8% 100,0%
Informal 6,0% 79,7% 14,3% 100,0%
Self-employed 2,9% 13,1% 84,0% 100,0%
2002 2003
Formal Informal Self-employed
Formal 91,7% 5,3% 3,0% 100,0%
Informal 15,4% 73,1% 11,5% 100,0%
Self-employed 4,4% 9,5% 86,1% 100,0%
2008 2009
Source: Encuesta Permanente de Empleo de Lima Metropolitana. Elaboration: own.
18
3. Employment security and quality
The results presented in the last subsection show that informality is a serious problem in Peru’s labour market. The results show that informality levels either measured through a firm formality (size) approach or through an employment benefit approach are high (60 per cent of the urban labour force and 70 per cent of the national labour force). Informality is a more serious issue among independent workers, women, workers over 65 and under 25, and workers with lower educational levels.
The existence of this dual market affects job quality, as informal workers suffer from lack of employment protection. In this subsection, we analyse employment security and quality indicators for Peru’s urban labour market as an effort to identify those aspects that are more affected by the duality of the job market. In this subsection informality will be defined as in Definition 1.9 We focus on market composition by type of contract, pension affiliation, employment duration, incomplete unemployment duration and income as indicators of job security and quality.
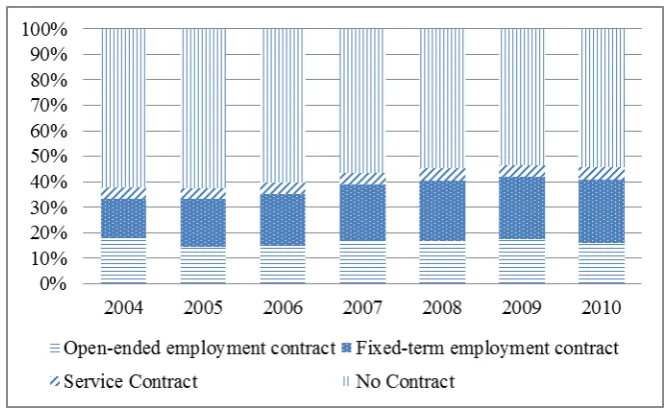
Figure 20 Composition of the urban labour market by type of contract (2001-2010)
Source: ENAHOs 2001-2010. Elaboration: own
Figure 20 presents the composition of the urban labour market by type of employment contract. During the period, the share of workers with no employment contract decreased in 8 percentage points, while the share of workers with fixed-term employment contracts increased in a similar amount. The share of open-ended employment contracts decreased as well, though only in 1 percentage point. Although the decrease of workers with no contracts is good for workers, it is worrying that this decline has resulted in an increase in fixed-term contracts rather than in open-ended contracts.
9
19
This is so as workers with fixed-term contracts may overbear the costs of labour market adjustments, especially when compared with workers with open-ended contracts. This suggests that employment termination regulation may be playing an important role in the choice of contract, as this is the only difference between the two contract types.10
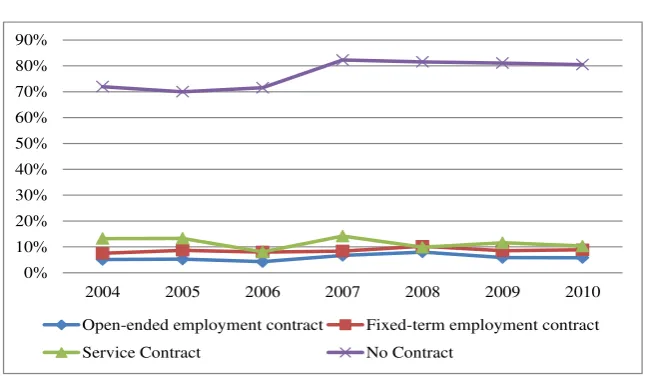
Figure 21 shows the share of informal workers for each of the contract types. As expected, most workers with no contract are also classified as informal, though this proportion has increased over time. This indicates that the share of formal workers with no contract has decreased over the period. The figure also shows that informal workers represent a small proportion of workers with any kind of contract. The absence of a working contract implies a less secure work situation, as no contract implies that the employer does not have any legal responsibility over the employee.
Figure 21 Share of informal workers by type of contract (2001-2010)
0% 10% 20% 30% 40% 50% 60% 70% 80% 90%
2004 2005 2006 2007 2008 2009 2010
Open-ended employment contract Fixed-term employment contract
Service Contract No Contract
Source: ENAHOs 2001-2010. Elaboration: own
Table 4 shows the results of a probit regression estimated to find which variables correlate with having a fixed-term contract versus having an open-ended contract, conditional on having a contract. As expected, we find that having secondary and higher education lowers the probability of having a fixed-term contract vis-à-vis having only up to primary education. Also, youth (base group) are more likely to have a fixed-term contract than any other age group. Marginal effects are larger for the older population, which suggests that the probability of having a fixed-term contract decreases with age. Having a fixed-term contract correlates negatively with being affiliated to a pension system as well. Finally, it is surprising that men have a higher probability of having this kind of contract than women, though the coefficient is small. It indicates that women that manage to get a formal contract (38 per cent of those with a contract) have a better chance to have it open-ended.
10
20
Table 4 Determinants of having a fixed-term contract, probit marginal effects
Equation Variables Marginal Effects
Fixed-term
Contract Male 0.0328** (0.0143)
Secondary education -0.0724* (0.0385) Tertiary education -0.182*** (0.0368)
Age 25-44 -0.199*** (0.0306)
Age 45-64 -0.505*** (0.0277)
Age 65> -0.588*** (0.0654)
Affiliated to pension system -0.318*** (0.0308)
Observations 5,935
Standard errors in parentheses. Marginal Effects: *** p<0.01, ** p<0.05, * p<0.1
Note: Estimation is conditional on having a contract.
Table 5 shows estimates of gaps in wages, hourly wages, monthly hours worked, duration of employment and probability of access to social security between two types of segments: formal/informal and open ended/temporary contracts. Consistent with our previous methodology, estimates are conditional on being employed and on having a contract, respectively. We also restricted the analysis to full-time workers, i.e., those working no less than 30 hours a week. Coefficients result from a pooled sample of national household surveys (ENAHO), for 2004-2010.11 We observe that, as expected, formal workers earn more than informal workers (24,3 per cent more of monthly wages and 22,3 per cent more of hourly wages). However, they work more hours (the equivalent of a little less than one extra day per month), and have slightly shorter job tenure. Likelihood to have social security is not of importance in this estimation since the definition of formality used to estimate gaps was access to social security. On the other hand, workers with open-ended contracts earn more (25 per cent and 32 per cent of monthly wages and hourly wages, respectively), work about two days less per month, tend to have longer lasting jobs, and are more likely to have access to social security than those who have a fixed-term contract. To sum up, results indicate that both formal workers and workers with open-ended contracts have better quality jobs. In the case of contract types, since we are controlling for observable worker and firm features, the evidence suggests that firms reward workers with open-ended contracts considering features not observable to the researcher.
11 Controls include: age, age-squared, education, firm size, activity sector and year dummies. To see full
21
Table 5 Job quality gaps according to formal/informal and open ended/temporary contract segments
Variables Gap
Formal Open-ended contract
Wages 0.243*** (0.0141) 0.254*** (0.0140)
Hourly wages 0.223*** (0.0128) 0.323*** (0.0143)
Hours worked 6.48*** (8.526) -15.59*** (7.538)
Duration of employment (Months) -0.887*** (0.0745) 8.403*** (0.128)
Social security -- 0.197*** (0.00719)
Standard errors in parentheses. *** p<0.01, ** p<0.05, * p<0.1
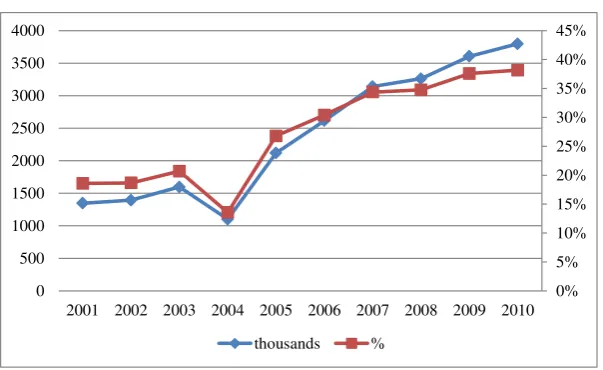
Figure 22 presents the evolution of pension affiliation. It shows that, starting at a very low point, the share of affiliated workers has doubled while the number of affiliates has tripled. As Figure 23 shows, the increase in affiliation has included informal workers, as they currently represent more than 30 per cent of the affiliated population. In absolute terms, the number of informal workers affiliated to the pension system is more than five times the number of informal workers affiliated in 2001 while the number of formal workers affiliated to the system has more than doubled.
[image:30.595.148.450.394.579.2]Figure 22 Pension affiliation (2001-2010)
0% 5% 10% 15% 20% 25% 30% 35% 40% 45%
0 500 1000 1500 2000 2500 3000 3500 4000
2001 2002 2003 2004 2005 2006 2007 2008 2009 2010
thousands %
22
Figure 23 Pension affiliation, by formality (2001-2010)
Source: ENAHOs 2001-2010. Elaboration: own
How have the trends reviewed affected variables such as employment and incomplete unemployment duration? Figure 24 shows employment duration for the years 2004 and 2010. It is clear that employment duration now focuses more in the less than 3 years range than in 2004.
[image:31.595.144.451.567.744.2]Figure 25 shows the evolution of average employment duration for the period 2004-2010 by gender, educational level and age groups. It seems that the average employment duration for men and women has remained relatively constant, though it has decreased the most for women (throughout the period, employment duration has been higher for men than for women). By educational level, we also find that job duration seems to be higher for those with no education or primary education, while the duration of employment among those with tertiary education seems to have increased over the last few years. By age groups, as expected, older people have had more time in their jobs, followed by adults and by young people. Job duration for those over 66 seems to have decreased the most on average, while employment duration for workers under 25 has also decreased.
Figure 24 Distribution of employment duration (2004 and 2010)
0
.0
5
.1
.1
5
.2
0 10 20 30 40 x
2004 2010
23
Figure 25 Average employment duration in years (2004-2010)
By gender By level of education
0 2 4 6 8 10 12
2004 2005 2006 2007 2008 2009 2010 Employment Duration (Average) Employment Duration - Men Employment Duration - Woman
Source: ENAHOs 2001-2010. Elaboration: own.
0 2 4 6 8 10 12 14 16
2004 2005 2006 2007 2008 2009 2010
no level/ primary secondary tertiary
Source: ENAHOs 2001-2010. Elaboration: own.
By age group
0 5 10 15 20 25
2004 2005 2006 2007 2008 2009 2010
15-24 years old 25-65 years old 66 years old or more
Source: ENAHOs 2001-2010. Elaboration: own.
24
Figure 26 Employment duration by age (2004 and 2010)
0
5
10
15
20
25
20 40 60 80 100 Age
2004 2010
Source: ENAHOs 2004 and 2010. Elaboration: own.
Survey data also allows us to observe how many weeks has the unemployed respondent has been out of a job. As there is no data about the time in which he/she eventually got a job, we only have the information to present the distribution of incomplete unemployment duration for the years in the sample. We start by presenting incomplete unemployment duration for the years 2001 and 2010 (Figure 27). It is clear that unemployment duration has changed between the two years, as now the distribution is concentrated in the under 4 weeks period, while in 2001 there was a considerably larger share of respondents with unemployment higher than 4 weeks. In figure 28 we distinguish this more clearly, as we present incomplete unemployment duration by groups for the whole period of analysis. We found that over 3 months incomplete unemployment periods have decreased significantly over the decade, while 1-week incomplete unemployment periods have increased. Overall, in 2010 over 80 per cent of the unemployed had been searching for work for less than one month. Further, unemployment for more than a year has virtually disappeared.
Figure 27 Incomplete unemployment duration (2001-2010)
0
.1
.2
.3
0 20 40 60 80 100 x
2001 2010
Source: ENAHOs 2001 and 2010. Elaboration: own.
0
20
40
60
80
0 20 40 60 80 100 Age
[image:33.595.150.449.542.717.2]25
Figure 28 Incomplete unemployment duration (2001-2010)
Source: ENAHOs 2001-2010. Elaboration: own
[image:34.595.137.456.498.694.2]Labour earnings have also increased in Peru since the beginning of the decade. As figure 29 shows, average labour income has increased in 4.7 per cent per annum in urban areas since 2001. It has increased more for the male workers than for female workers. It has also increased similarly for age groups, though the increase has been higher for the over-45 age group. By educational level, we found that income has increased similarly for all the educational levels. Finally, when analysing employment income evolution by income quintile, it becomes clear that labour income has increased for the whole population, not just for the richest.
Figure 29 Labour earnings (2001-2009, urban)
Source: INEI 2010. Elaboration: own
0 200 400 600 800 1000 1200
26
Figure 30 Labour earnings (2001-2009)
By gender By age group
0 200 400 600 800 1000 1200 1400
2001 2002 2003 2004 2005 2006 2007 2008 2009
Men Women
Source: INEI 2010. Elaboration: own.
0 200 400 600 800 1000 1200 1400
2001 2002 2003 2004 2005 2006 2007 2008 2009
14-24 years old 25-44 years old 45 years old or more
Source: INEI 2010. Elaboration: own.
By level of education
0 200 400 600 800 1000 1200 1400 1600 1800
2001 2002 2003 2004 2005 2006 2007 2008 2009
no level/primary secondary tertiary
[image:35.595.163.431.552.733.2]Source: INEI 2010. Elaboration: own.
Figure 31 Labour earnings by income quintile (2001-2009)
0 500 1000 1500 2000 2500
2001 2002 2003 2004 2005 2006 2007 2008 2009
Q1 Q2 Q3 Q4 Q5
27
Some conclusions may be drawn about the evolution of the labour market over the last decade. First, Peru’s labour market seems to be responding quite well to the challenging demographic environment. In effect, it has managed not only to absorb the growing labour force, but also several job quality indicators, including labour earnings and social protection coverage, are moving in the right direction.
Employment quality and security indicators have shown improvements. The share of workers that currently do have a working contract has increased, although the portion that does not have one is still high (around 40 per cent). On the other hand, the share of fixed-term contracts has increased, while the share of open-ended employment contracts has slightly decreased. The number of workers affiliated to pension systems has considerably increased, as well as the share of “informal” workers affiliated to pension systems. Employment duration and unemployment duration have both decreased over the period. Given the significant decrease in unemployment duration and the increase in wages, this may suggest that shorter employment duration is associated to more active job search, rather than dismissals. Also, labour earnings have increased across different socio-demographic groups, which is a solid indicator of improvements in job quality.
28
4. The institutional setting of the Peruvian labour market
During the 1980s, the Peruvian economy fell into a deep recession. Output fell steeply in the midst of a hyperinflationary process. Entering in 1990, the Fujimori government implemented a drastic macroeconomic stabilization program and a full set of structural reforms in an attempt to improve the situation. As a result, Peru experimented one of the fastest liberalization reforms and one of the deepest labour market reforms in Latin America (Saavedra and Torero, 2004; Jaramillo and Saavedra, 2005).
The Peruvian Labour Code in effect at the moment, developed during the import substitution period, has been termed one of the most restrictive, protectionist, and cumbersome of Latin America (International Labour Organization [ILO], 1994). The code was complex and had overlapping decrees, which had gone through too many changes. The labour market reform relaxed labour market regulations through a series of modifications. Firing costs decreased considerably, red tape for the use of temporary contracts was reduced, and the structure of severance payment changed. However, firms in the private sector faced an overall slight increase in nonwage costs (Saavedra and Torero, 2004).
One of the main consequences of having such a restrictive labour market regulation was the proliferation of informal employment. The liberalization process was not able to fully compensate the advances in the segmentation produced on the labour market and, to some degree, it may have even contributed to its increase (Toyama, Chávez, Tostes Vieira, 2009). After 2001 labour regulation tendencies have migrated towards regulation instead of deregulation, without returning to the levels reached during the late eighties. In the next section we describe current labour market legislation and its most recent evolution in order to set out key elements to assess the linkage between regulation and the current labour market outcomes.
4.1. Employment protection legislation
Protection of workers facing events of unemployment represents one of the main goals of labour market regulations. Imperfections in credit markets may prevent workers, especially the poorest ones, to insure against unemployment spells. Unemployment may also produce income fluctuations that governments try to avoid. Often, however, regulations protect not the worker but the job. As a consequence, countries tend to discourage layoffs as a way to minimize the effects of unemployment on the worker.
29
[image:38.595.126.533.196.392.2]The severance payments mechanism has suffered changes with each political regime. Table 6 shows the evolution of severance payment rules in the last three decades. Today, severance payment is 1.5 months’ wages for every year of tenure for workers with more than 3 months in the firm, with a minimum of 3 months’ wages and a maximum of 12 months’ wages. It is applicable only if dismissal is unjustified or arbitrary.
Table 6 Evolution of severance payment legislation rules
Period Tenure Severance
June 1986 - November 1991
3 months - 1 year 3 months' wages
1-3 years 6 months' wages
More than 3 years 12 months' wages
November 1991 - July 1995
3 months - 1 year 0 months' wages
1-3 years 3 months' wages
3-12 years 1 months' wages per year
July 1995 - November 1996 3 months - 12 years 1 months' wages per year More than 12 years 12 months' wages
November 1996 – to present 3 months - 12 years 1.5 months' wages per year More than 8 years 12 months' wages
Source: Saavedra and Torero, 2004; Toyama, Chávez, Tostes Vieira, 2009. Elaboration: Own.
30
Table 7 Protection system at the event of a dismissal
Type of Dismissal Description Active Law Constitutional Court
Uncaused Dismissal
Verbal or written dismissal with no expressed legal cause.
Arbitrary Dismissal:
Severance Payment. Reinstatement.
Fraudulent Dismissal Wrongful dismissal. Arbitrary Dismissal:
Severance Payment. Reinstatement.
Invalid Dismissal
Discriminatory dismissal. Dismissal as a reaction to union activity.
Invalid Dismissal:
Reinstatement. Reinstatement.
Dismissal in breach of a fundamental right
Intimacy, religion, expression, etc.
Arbitrary Dismissal:
Severance Payment. Reinstatement.
Dismissal for serious misconduct
Serious misconduct and rightful process exist but the employer was not able to prove the fault judicially.
Arbitrary Dismissal:
Severance Payment. Severance Payment.
Source: Toyama, Chávez, Tostes Vieira, 2009. Elaboration: Own.
The UISA (CTS) regulation in Peru has also changed significantly over the past years. During the last two decades, the unemployment protection objectives of the CTS were somewhat lost due to reforms that allowed partial withdrawals from the CTS account during periods of employment. In 2010, after a number of legal dispositions, the Law N°29352 regulated the progressive restoration of the intangible characteristic of the CTS account. According to this law, from May 2011 until the end of the employment contract, workers can only dispose of up to 70 per cent of the surplus over 6 wages of their CTS account. This restriction has been an important improvement from past approaches as it assures that workers keep a considerable share of the CTS savings for unemployment periods.
Table 8 Evolution of the CTS (Compensation for time of service)
Bank Deposits Partial Withdrawals
Before 1990 No No. Few exceptions.
1991-2000 Semi-annual 50%
2001 - October 2004 Monthly 100%
November 2004 – 2008 Semi-annual 50%
From 2009 Semi-annual 100%
From May 2010 Semi-annual 40%
From October 2010 Semi-annual 30%
From May 2011 Semi-annual 70% of the surplus over 6 months'
wage.
[image:39.595.109.490.563.737.2]31
4.2. Employment contracts: The evolution of fixed-term contracts
The hiring process in Peru allows for three types of contracts: (i) open-ended employment contracts (undefined), (ii) fixed-term contracts (temporary contracts) and (iii) part-time contracts (less than 4 hours a day, on average). Fixed-term contracts allow firms to hire workers for fixed periods of time under a modality that requires firms to pay for the same working benefits as open-ended contracts, but with the benefit that no severance payment has to be made once the contract expires.12
[image:40.595.111.478.329.572.2]Although temporary contracts were introduced in the 1970s, the high administrative costs this procedure implied, which involved approval from the Labour Ministry, seriously restricted their use. In August 1991 red tape for the use of this kind of contracts was significantly reduced, and the reasons that could be used to justify these contracts were increased. Still, current employment law establishes both verbal and written contracts as open-ended contracts. Thus, temporary contracts are only allowed under certain circumstances and must be written and registered with the Ministry of Labour. Table 9 presents the main types of fixed-term contracts.
Table 9 Types of fixed term contracts
Contract Justification Max. Duration
Starting a new activity or increasing an
activity 3 years
Market need 5 years
Corporate restructuring 2 years
Occasion, due to transitory needs 6 months per year
To substitute a permanent employee for a
limited time As long as it is needed
Emergency The duration of the emergency
Specific service The duration of the specific service
Intermittent need As long as required
Seasonal As long as required
Source: Toyama, Chávez, Tostes Vieira, 2009. Elaboration: Own.
As seen in Section 3, the number of fixed-term contracts has increased significantly since the 1991 reform. The evolution continued even after the severance payment costs reduction in the mid-nineties. Today, most of formal employment growth is explained by temporary contracts (see Section 1). There are a number of reasons why employers may prefer to use temporary contracts. The main reason is to avoid termination costs. An additional reason could be to dissuade labour unions or their activities. This is so as although labour legislation allows temporary workers to organize in unions, the fact that
12
32
employers have yet to decide if their contracts are renewed may disincentivize union involvement. Also, the use of fixed-term contracts may increase the firms’ negotiation power, which may in turn allow them to adjust wages during periods of recession. Finally, the use of temporary contracts may be a direct consequence of firms not trusting the stability of labour market legislation. These possible motivations have not been tested empirically, so this is clearly an area where more research would be helpful.
4.3. Nonwage costs
[image:41.595.122.475.378.583.2]Peru’s nonwage costs are high and complicated. The structure of these contributions is criticized as they increase labour costs and have potentially negative effects on formal employment. Although most people believe that workers’ benefits were reduced during the liberalization period, nonwage costs increased throughout the nineties. Figure 30 shows the evolution of nonwage costs from 1987 to 2001. Clearly, both nonwage costs covered by the employer and nonwage costs covered by the employee increased through the period.
Figure 32 Evolution of nonwage costs (1987-2001)
Source: Saavedra and Maruyama, 2000.
33
Table 10 Nonwage costs in Peru13
General Regime Contracts Micro & Small Firm
Regime1
Health plan payment (EsSalud) 9% 9%
Life insurance 0.53% 0.53%
Manufacturing training fund
(SENATI) 0.75% 0.75%
Christmas and national holiday
bonuses 16.67% 8.34%
Individual savings account (CTS) 9.72% 4.17%
Health plan payment on bonuses 1.50% 0.75%
Vacations 8.33% 14.17% (15 days)
Health plan payment on vacations 0.75% 0.38%
Accident insurance 1.89% 1.89%
Others (Family Bonus: 55 soles) Applicable Not applicable
Profit distributions Varies by sector Varies by sector
Severance pay 1.5 x monthly wage up to 12 wages 0.66 x monthly wage up to 3 wages
Sub-total firm 49.14% + variables + expected
severance pay
29.98% + variables + expected severance pay
Public and private retirement plan
payments (on worker) 13% 13%
Total 62.14% + variable payments 42.98% + variable payments
Source: Toyama, Chávez, Tostes Vieira, 2009. Elaboration: Own.
1 Applicable for firms with between 11 to 100 workers and up to 1,700 tax units in annual sales. Presently the
value of a tax unit is US$1,380. For micro firms (10 workers or less) only vacations and health plan on vacation apply, while severance pay is calculated as one third of monthly wage multiplied by number of years worked up to 3 monthly wages. Also, employer pays 15 soles (US$5.80) per month towards a health plan, the rest is subsidized by the state
through the publicly-ran Seguro Integral de Salud.Thus, the non-wage bill adds up to 4.55% + 15 nuevos soles +
expected severance pay.
Pay bonuses are best understood as differed wages, as they imply proportionately lower wages throughout the year. The vacation period is high for Latin American standards, as most countries provide paid vacation periods of two weeks a year, while Peru’s general regime has a one-month vacation period. It should be noted that the demand for vacations in Peru is lower than one month a year, as most workers do not use their whole vacation period. As Table 11 shows the special regime for micro and small firms provides lower non-wage costs for small firms and even more so for microfirms. Below a description of this special regime is presented.
13
34
4.4. Special regimes: Micro and small enterprises
14Legally, Micro and Small Enterprises in Peru (commonly denoted as MYPEs) are defined as businesses which fulfil requirements related to the number of employees and annual sales levels. The Law for Promotion and Formalization of Micro and Small Enterprises (Law N°28015), enacted in 2003, had the objective of promoting the formalization of micro and small enterprises and established a special temporary regime for this kind of firms. In this direction, employment benefits such as the vacations period, severance payments, among others, were adapted to the requirements of smaller firms. In 2008, the Legislative Decree N° 1086 was enacted, which radically altered the regime through two main changes: (i) the Government now subsidizes social security contributions of micro and small enterprises and (ii) it created a labour regime for enterprises with less than a 100 employees which reduces non wage labour costs in about 50 per cent.
[image:43.595.104.495.323.429.2]Table 11 presents the legal definition of both micro and small enterprises in Peru since 2008. Table 12 provides a summary of the employment regulation by regime.
Table 11 Micro and Small Enterprises
Number of employees Annual sales
Micro-enterprises From 1 to 10 employees
Up to a maximum amount of 150 Tax Units
Small
enterprises From 1 to 100 employees
Up to a maximum amount of 1700 Tax Units
Source: LD N°1086. Elaboration: Own.
4.5. On the link between the institutional setting and market outcomes
Addressing empirically the link between regulation and labour market outcomes is not easy, since typically regulations are broadly mandated thus leaving researchers without proper comparison groups. Fur