Full Terms & Conditions of access and use can be found at
http://www.tandfonline.com/action/journalInformation?journalCode=vjeb20
Download by: [Universitas Maritim Raja Ali Haji] Date: 11 January 2016, At: 22:35
Journal of Education for Business
ISSN: 0883-2323 (Print) 1940-3356 (Online) Journal homepage: http://www.tandfonline.com/loi/vjeb20
Evaluating a Program Designed to Demonstrate
Continuous Improvement in Teaching at an
AACSB-Accredited College of Business at a Regional
University: A Case Study
Robert E. Pritchard , Michael S. Saccucci & Gregory C. Potter
To cite this article: Robert E. Pritchard , Michael S. Saccucci & Gregory C. Potter (2010) Evaluating a Program Designed to Demonstrate Continuous Improvement in Teaching at an AACSB-Accredited College of Business at a Regional University: A Case Study, Journal of Education for Business, 85:5, 280-283, DOI: 10.1080/08832320903449568
To link to this article: http://dx.doi.org/10.1080/08832320903449568
Published online: 08 Jul 2010.
Submit your article to this journal
Article views: 31
View related articles
ISSN: 0883-2323
DOI: 10.1080/08832320903449568
Evaluating a Program Designed to Demonstrate
Continuous Improvement in Teaching at an
AACSB-Accredited College of Business at a
Regional University: A Case Study
Robert E. Pritchard
Rowan University, Glassboro, New Jersey, USA
Michael S. Saccucci
Western Connecticut State University, Danbury, Connecticut, USA
Gregory C. Potter
Rowan University, Glassboro, New Jersey, USA
This article provides a detailed statistical analysis of a process intended to demonstrate contin-uous improvement in teaching at an AACSB accredited college of business. The Educational Testing Service’s SIR II student evaluation instrument was used to measure teaching effec-tiveness. A six-year longitudinal analysis of the SIR II results does not indicate improvement in the overall teaching. The results indicate two important concerns when designing a proce-dure to demonstrate teaching effectiveness. First, resulting data should be analyzed frequently; second, more than one measure of teaching effectiveness should be included. This paper may be of assistance when blueprinting or applying processes designed to demonstrate continuous improvement in teaching.
Keywords: analysis of teaching effectiveness, course evaluation, demonstrating improvement in teaching, evaluation methods, faculty evaluation, faculty performance, learning assurance, student evaluation of teaching, teacher evaluation
To obtain and retain accreditation from the Association to Advance Collegiate Schools of Business (AACSB) In-ternational, AACSB Eligibility Procedures and Standards for Business Accreditation requires its member institutions to demonstrate continuous improvement in teaching within their colleges of business. AACSB Standard 4 (Continuous Improvement Objectives; AACSB, 2008) sets the tone for what is expected of accredited schools. An example out-lined in the interpretive guidelines of this standard states: “a school’s mission statement might contain an aim of ‘pro-viding high quality instruction. . ..’ This aim in the mission
statement could give rise to an action item of ‘establishing a
Correspondence should be addressed to Robert E. Pritchard, Rowan University, Department of Accounting and Finance, 201 Mullica Hill Road, Glassboro, NJ 08028, USA. E-mail: pritchard@rowan.edu
systematic program of instructional evaluation and develop-ment’“ (p. 12).
Once processes designed to demonstrate continuous im-provement in teaching are established by a college of busi-ness, the institution must (a) apply those processes regularly to measure teaching quality and effectiveness and (b) ana-lyze the results of the measurements to demonstrate that the processes are effective. That is, the member institutions must clearly demonstrate that teaching is, in fact, improving.
Clearly, the procedures utilized to demonstrate continu-ous improvement in teaching depend on the school’s mission statement. The mission statement developed by the AACSB-accredited College of Business (COB) at the regional uni-versity (Uniuni-versity) at which this study was conducted includes a statement that the COB regards as its highest pri-ority effective teaching that engages students in the learning process.
EVALUATING A CONTINUOUS-IMPROVEMENT PROGRAM 281
The Present Study
The statistical analysis described herein examines the results of the process adopted by the COB that was designed to demonstrate continuous improvement in teaching (Process). Specifically, this article presents the results of a longitu-dinal analysis of teaching quality and effectiveness over a 12-semester period during which the Process was used.
For many years the COB has used the Educational Test-ing Service’s (ETS) Student Instructional Report (SIR; and more recently the SIR II) student evaluation instrument as a primary measure of teaching effectiveness. For example, the SIR II results are used in conjunction with peer teaching evaluations for purposes of evaluating candidates for recon-tracting, tenure, and promotion.
Given the COB’s experience using the SIR II, the COB faculty and administration developed the Process, employing the SIR II as the single measure of teaching quality and effectiveness. The Process required all COB faculty members (full-time as well as part-time and adjuncts) to administer the SIR II instrument in every class every semester. The students participating in the Process included all undergraduate and graduate students taking courses offered by the COB. In addition, when the faculty members received their SIR II Class Reports (summaries of the student evaluations for each of their classes) provided by the ETS, the faculty members were required to prepare (a) an analysis of their individual student evaluations and (b) an annual teaching improvement plan.
The Process was first implemented during the spring semester of 1999. At that time, a mechanism to provide summary data for the COB as a whole did not exist. Without such summary data, it was not possible to measure the COB’s overall teaching quality and effectiveness. A solution to this problem was provided by the ETS. Commencing with the fall 2001 semester, ETS provided the COB with a Combined Report University College of Business (Combined Report). Each semester’s Combined Report provides the semester av-erages of the student evaluations by SIR II category for the COB as a whole. Recording the Combined Report averages semester by semester provides the data needed to develop a longitudinal analysis of the changes in teaching quality and effectiveness for the COB as a whole.
A copy of each semester’s Combined Report was pro-vided to each COB faculty member along with the individual SIR II Class Report(s) for the faculty member’s classes. The Combined Reports thereby provide faculty members with a set of benchmarks that individual faculty members can use to compare student evaluations for a given semester with the averages for the COB as a whole.
As noted previously, COB faculty members were required to prepare an analysis of their individual student evaluations as well as teaching improvement plans. Commencing with the availability of the Combined Reports, when preparing their teaching improvement plans, faculty members were
asked to focus particularly on those SIR II categories in which their individual results were lower than the COB Combined Report averages. The rationale for requiring faculty members to focus on their areas of below average student evaluations is to try to boost the COB Combined Report averages.
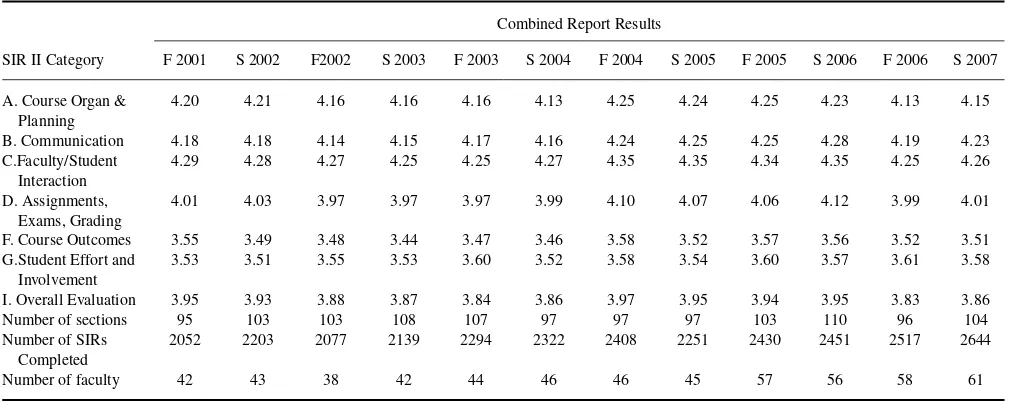
ETS Combined Report Results: Fall 2001 Through Spring 2007
As shown in Table 1, the Combined Report results are divided into seven SIR II categories. Categories A, B, C, D, and I used a 5-point Likert-type scale ranging from 1 (ineffective) to 5 (very effective). Categories F and G used a 5-point Likert-type scale ranging from 1 (much less than most courses) to 5 (much more than most courses).
Although there are other categories within the SIR II eval-uation instrument (such as course difficulty, work load, and pace), ETS does not compute the averages for these and, consequently, does not provide information on these in its Combined Reports.
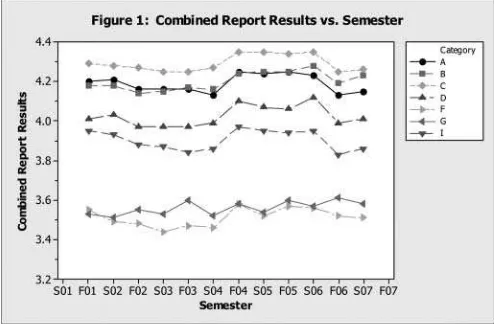
Figure 1 shows the semester-to-semester changes in the SIR II Combined Report results commencing in the fall of 2001 through the spring 2007 semester (six academic years). Each of the seven SIR II categories (listed in Table 1) is shown with a separate symbol.
As shown in Figure 1, the Combined Report results for SIR II Category G (Student Effort and Involvement) appear to show a slight linear increase from fall 2001 to spring 2007. The Combined Report results for the other SIR II categories show changes over three distinct time periods:
1. Time Period 1: fall 2001 through spring 2004—a slight decrease.
2. Time Period 2: fall 2004 through spring 2006—an up-ward shift from Time Period 1 followed by a relatively stable period.
FIGURE 1 Combined report results vs. semester.
TABLE 1
SIR II Combined Report Results for the College of Business Fall 2001 Through Spring 2007
Combined Report Results
Number of sections 95 103 103 108 107 97 97 97 103 110 96 104 Number of SIRs
Completed
2052 2203 2077 2139 2294 2322 2408 2251 2430 2451 2517 2644 Number of faculty 42 43 38 42 44 46 46 45 57 56 58 61
Note.SIR=student instructional report; F=fall; S=spring.
3. Time Period 3: fall 2006 and spring 2007—a down-ward shift from Time Period 2 back to approximately pre-fall 2004 levels.
METHOD
A weighted regression analysis using proprietary Minitab 15 (Minitab, n.d.) statistical software was used to examine the trend in the seven SIR II Combined Report category results separately for each category. Table 2 contains the estimated time slopes using the separate regression models. The analysis for Category G did not include time period variable because it did not exhibit the same pattern as the other SIR II Categories.
TABLE 2
Estimated Time Slopes for the Seven SIR II Categories
Time Period 1 Time Period 2 Time Period 3 Category Slope p Slope p Slope p
A –.01428 .004 –.00513 .404 .02000 .318
Note.SIR=student instructional report.
RESULTS
An examination of Table 2 shows that there was a negative trend in the SIR II Combined Report Results for the fall 2001 through spring 2004 time period (i.e., Time Period 1) for Categories A, B, C, D, F, and I. Examination of thep
values shows that only the slopes for Categories A and I are statistically significant (α=.01). However, after adjusting
thepvalues for multiple comparisons, none of the slopes are significant.
During Time Periods 2 and 3, the direction of the trends was mixed. Furthermore, none of the slopes during these two time periods were statistically significant. Comparing the SIR II results for all categories (with the exception of Category G) in Time Period 1 with their values in Time Period 3 indicated that there was no overall significant change in these six SIR II Combined Report results. Finally, Category G shows a very slight, but statistically significant, positive slope.
CONCLUSION
The results of this longitudinal analysis clearly indicate that, with the exception of Category G (Student Effort and In-volvement), the COB’s SIR II Combined Report results did not improve between Time Period 1 and Time Period 3. The process intended to demonstrate continuous improvement in teaching; although well intended, it did not demonstrate long-term improvement.
As evidenced by the slight increase in Category G, stu-dents apparently felt that they were putting increased effort into their courses and were more involved in them. Although any improvement in student effort and involvement may
EVALUATING A CONTINUOUS-IMPROVEMENT PROGRAM 283
produce more learning, it is important to note that the es-timated increase per semester amounted to approximately 0.006305 points on a scale of 1–5 points. Although the stu-dents felt that they were expending more effort and were more involved in their courses, this did not translate into any measurable improvement in their evaluations of the instruc-tors’ teaching (SIR II Categories A, B, C, D, I) or the course outcomes (Category F).
SIR II Category F may be viewed as especially important because this category focuses on measuring various aspects of student learning—arguably the single most important mea-sure of teaching effectiveness. Category F differs from Cat-egories A, B, C, D, and I; all of the evaluations in the latter categories focus on the instructor. That is, these five cate-gories all focus on the results of student evaluations, such as the instructor’s ability to organize and plan the course as well as the instructor’s ability to communicate.
Category F includes the following five SIR II items all of which focus on the students’ perception of how much they learned:
29. My learning increased in this course.
30. I made progress toward achieving course objectives. 31. My interest in the subject area has increased. 32. This course helped me to think independently about
the subject matter.
33. This course actively involved me in what I was learn-ing.
The fact that the Category F results did not improve sug-gests that, on average, the COB’s students were not learning any more during the latter semesters of the six-academic-year analysis (Time Period 3) than they did during the earlier semesters (Time Period 1), even though they reported a slight increase in effort and involvement. Furthermore, the analysis of the Combined Report results indicated that, on average, the quality and effectiveness of the COB’s instructors did not increase from Time Period 1 to Time Period 3.
The analysis suggests that faculty and administrators are faced with a difficult challenge when trying to demonstrate continuous improvement in teaching over time. If, for ex-ample, a longitudinal analysis had been conducted after the results for the fall of 2003 were obtained, it likely would
have indicated that the Combined Scores had deteriorated slightly and that the Process required revision. Waiting to perform the longitudinal analysis until midway in Time Pe-riod 2 might have indicated that the Process was resulting in improved teaching. Such an indication of success could have reinforced the original rationale for using the Process and resulted in its continued use.
The fact that the results of the longitudinal analysis ap-pear to change from time period to time period suggests that (a) it is important to analyze the data frequently and (b) it would probably be wise to include more than one measure of teaching effectiveness in a process designed to demonstrate continuous improvement in teaching.
Finally, it should be noted that the AACSB Eligibility Pro-cedures and Standards (2008) include demonstrating contin-uous improvement in teaching as an integral part of it stan-dards for Assurance of Learning. The Assurance of Learning Standards (Standards 15–21) encompass several issues re-lated to the quality of instruction, including Standards 12 and 13.
Standards 12 (Aggregate Faculty and Staff Educational Responsibility) and 13 (Individual Faculty Educational Re-sponsibility; AACSB, 2008) are both relevant in discussions of continuous improvement in teaching. The interpretive ma-terials in Standard 12 state: “The school and its faculty mem-bers use established processes to evaluate and guide instruc-tional improvement. Instrucinstruc-tional improvement depends on individual faculty members, the faculty as a whole, and sup-port staff, as appropriate” (p. 54). That is, demonstrating continuous improvement in teaching (as well as the effec-tiveness of other related processes such as academic and ca-reer advisement) is not a stand-alone process. Rather, these processes are integral to and directly related to assurance of learning.
REFERENCES
American Association of Collegiate Schools of Business. (2008).Eligibility procedures and standards for business accreditation. Tampa, FL: Author. Retrieved April 2, 2010, from www.aacsb.edu/accreditation/AAACSB-STANDARDS-2010.pdf
Minitab Statistical Software. (n.d.).Release 15. State College, PA: Author.