EFFECT OF THE ION TREATMENT ON AN RNA HAIRPIN:
MOLECULAR DYNAMICS STUDY
Elisabeth Catherina Widjajakusuma, Alessandra Villa, and Gerhard Stock
* Institute for Physical and Theoretical Chemistry, J. W. Goethe University,Max-Von-Laue-Strasse 7, 60438 Frankfurt am Main, Germany
Received September 24, 2011; Accepted November 5, 2011
ABSTRACT
Molecular dynamics has been employed to study the effect of ion treatment on the stability of 14-nucleotide RNA hairpin of Coxsackievirus B3. Three AMBER force fields were used: AMBER94, AMBER98, and AMBER99, which showed no significant structural difference of the hairpin. Thereafter, we applied two different long-range electrostatic treatments that were reaction field and PME methods, and calculated the distribution of ions around the hairpin. Although the structural stabilities of the MD simulations using both methods were similar in 0.14 M Na+, ion environment around the hairpin was notably different. In particular, structural stabilition of the hairpin with increasing ion concentration and with ion Mg2+ cannot be accommodated by simulations using reaction field method. Furthermore, the MD simulations using PME method suggested the strong similarity in structural and dynamical properties of the hairpin with 0.14 M Na+, 0.50 M Na+, 1.03 M Na+, and 0.08 M Mg2+concentrations. However, the simulations revealed different ion occupations of Na+and Mg2+.
Keywords:RNA hairpin; md simulations; ion treatment; Coxsackievirus B3
ABSTRAK
Dinamika molekul telah digunakan untuk mempelajari pengaruh perlakuan ion pada stabilitas 14-nukleotida RNA jepit rambut dari Coxsackievirus B3. Tiga medan gaya AMBER digunakan: AMBER94, AMBER98, dan AMBER99, yang menunjukkan tidak ada perbedaan struktural yang signifikan dari jepit rambut tersebut. Setelah itu, diterapkan dua perlakuan yang berbeda untuk elektrostatik jarak-panjang menggunakan metode medan reaksi dan PME, dan dihitung distribusi ion di sekitar jepit rambut tersebut. Meskipun stabilitas struktur hasil simulasi MD menggunakan kedua metode adalah serupa pada 0,14 M Na+, namun lingkungan ion di sekitar jepit rambut tersebut menunjukkan perbedaan. Secara khusus, stabilisasi struktur jepit rambut dengan peningkatan konsentrasi ion dan dengan ion Mg2+, tidak dapat diakomodasi oleh simulasi menggunakan metode medan reaksi. Simulasi MD menggunakan metode PME menunjukkan kesamaan yang kuat untuk sifat struktur dan sifat dinamis dari jepit rambut untuk konsentrasi 0,14 M Na+, 0,50 M Na+, 1,03 M Na+, dan Mg2+ 0,08 M. Namun demikian, hasil simulasi mengungkapkan adanya sifat kerja yang berbeda untuk ion Na+dan Mg2+.
Kata Kunci:RNA jepit rambut; simulasi DM; perlakuan ion; Coxsackievirus B3
INTRODUCTION
RNA’s functional diversity very often requires this molecule to change its conformation [1]. Conformational changes of RNA can occur either through self-induced transition or, in response to biological signals such as small molecules, divalent ions, proteins or other nucleic acids. Particularly, a series of studies looking at the sequence dependence on flexibility of nucleic acids confirm the notion that sequence affects the flexibility [2-3]. Different flexibility and different population of conformational state are probably important for protein-recognition. Moreover, local motions in nucleic acids may also facilitate protein-recognition and allow
enzymes acting on RNA to access functional groups on the bases that would otherwise be hidden in Watson-Crick base pairs [4-5].
monovalent cations mainly bind in a non-specific manner, localization of divalent counterions is more favorable since fewer particles tend to be localized to neutralize the same charge which probably provides significant entropic advantage [13]. Understanding the effect of ions is important because it is a step toward elucidating the function of biomolecules in the realistic cellular environment. Much effort has been devoted to the study of the importance of metal ions on nucleic acids stability. Increasing the NaCl concentration from 0.1 M to 1.0 M increased the melting temperature and thermal stability of DNA helix, which was studied based on TBI (tightly bound ion) theory [14]. Furthermore, magnesium ions appear to interact with the eubacteral loop E duplex oligomer in a distinctly different manner than with the other oligomer [11].
The importance of salts on structural stability of nucleic acids was also demonstrated in molecular dynamics simulations [7,9-10,15-23]. Simulations of DNA in the gas phase clearly show that duplex stability in the gas phase requires neutralization of some of the phosphates and newer experiments are clearly demonstrating the binding of monovalent ions to DNA in solution [24]. The ordered ion sites in the grooves as a part of DNA solvation and their implication in the stabilization of A-DNA and B-DNA conformations were analyzed and discussed. [23]. The occupancies of sodium ions in the grooves of the DNA shown indistinctly to be sensitive to sequence [18].
Below, we study a 14-nucleotide RNA hairpin, 5’-(gguauCACGguacc)-3’ (Fig. 1), which represents the stem-loop D of 5’-non-translated region of the Coxsackievirus B3 [25-27]. This stem-loop D RNA are thought to be the important determinant for 3C proteinase-RNA interaction [26]. Classical replica-exchange molecular dynamics (REMD) simulations were employed to study structure, dynamics, and thermostability of uCACGg hairpin [28]. The results in this study confirmed the previous NMR studies [29-31], which suggested structural similarity and different thermostability of uCACGg hairpin compared to cUUCGg hairpin. In particular, the REMD of uCACGg hairpin showed less flexible, a stronger attitude to donate hydrogens, and cooperative thermal unfolding. Moreover, a joint NMR/MD study of temperature dependence of RNA hairpins revealed that the first event of destabilization of the uCACGg and cUUCGg hairpins was the loss of the stacking interactions between the first and the third nucleobase in the loop region [32-33].
In the present study, we examine the effects of different long-range electrostatic treatments, cation concentrations, and ion types on the structure of uCACGg hairpin by using all-atom MD simulations. First, the performances of different AMBER force fields are compared in reproducing the structure of uCACGg hairpin
Fig 1.The 14-mer uCACGg hairpin which consists of a stem and a loop region with numbering. (A) Secondary and (B) tertiary structure. The lines which connect two bases represent the hydrogen bonds between Watson-Crick base-pairs, and the black point wobble base-pair.
in 60 ns MD simulations. These force fields, based on the Cornell and co workers, are the AMBER94 [34], AMBER98 [35], and AMBER99 [36] force fields. Then, the long-range electrostatic interactions are treated by reaction field and particle-mesh Ewald (PME) method using AMBER98 force field. MD simulations were carried out for the uCACGg hairpin using both methods with three different Na+-ion concentrations. One simulation with Mg2+ as counterion was performed to examine the effect of ion type on RNA hairpin. Finally, to illustrate the effect of cations on the structural stability, we present more details about ion interaction with RNA hairpin.
EXPERIMENTAL SECTION
Simulation Conditions
(PME) method [40] was employed to treat Coulomb interactions, using a switching distance of 1.0 nm, a grid of 0.12 nm and a beta value of 3.1 nm−1. Constant pressure p and temperature T were maintained by weakly coupling the system to an external bath at 1 bar and at the chosen temperature, using the Berendsen barostat and thermostat, respectively [41]. The RNA, the ions, and the solvent were independently coupled to the temperature bath with a coupling time of 0.1 ps. The pressure coupling time was 0.5 ps and the isothermal compressibility 4.5·10−5 bar−1. The bond distances and the bond angle of the solvent water were constrained using the SETTLE algorithm [42] All other bond distances were constrained using the LINCS algorithm [43] A leap-frog integrator with a integration time step of 2 fs was used. The starting structure of the 14-mer uCACGg hairpin was taken from the Brookhaven Protein Data Bank (PDB structure 1RFR.pdb) [29].
To study the effect of the long-range electrostatic treatment, we repeated the simulation using reaction field (RF) approach [44]. A twin range cut-off was used for the electrostatic interactions, that is, interactions between atoms within 1.0 nm were evaluated every step, while interactions between atoms within 1.4 nm were evaluated every 10 steps. A reaction field correction was applied to the electrostatic beyond 1.4 nm using a water dielectric constant of 78.
To study the effect of the ions on the system, the calculations were performed at three different NaCl concentrations (0.1 M, 0.5 M and 1.0 M) and at MgCl2
concentration of 0.1 M. These values refer to the ionic strength of the ion solution not including the solute. Simulations were performed including 13 Na+ (0.1 M), 45 Na+ and 32 Cl− (0.5 M), 90 Na+ and 77 Cl−(1.0 M), and 7 Mg2+and 1 Cl−(0.1).
Each simulation was performed for 60 ns. Table 1 report a summary of the calculations.
Analysis of System Property
Analysis of the trajectories was performed with tools from the GROMACS package and with modified versions of them. A range of properties of the system were analyzed with the use of each simulation. The properties included interproton distances, root mean square standard deviation (RMSD), fraction of hydrogen bonds and base stacking, radius of gyrations and solvent accessible surface area for evaluating the stability of simulations. The interproton distances, rHH, corresponding to the 521 NOE interactions, were calculated from the 60 ns trajectory and the <r6HH>
1/6
values were compared with experimentally determined upper limit distances [29] [the NOE data are given kindly by Jens Wöhnert]. The NOE violations were those, whose computed range values (average ± standard
deviation) are larger than upper limit distance (derived by NOE signal intensity). The RMSD values were calculated for all hairpin’s atom after performing a least-square fitting of the backbone atoms of the MD and NMR average structures. Additional RMSD calculations were also done for the atoms in the loop and stem regions after fitting on backbone atoms in the related region to check if not only the whole molecule but also each region is stable during the simulations.
To define the presence of an hydrogen bond, an acceptor-donor distance smaller than 0.35 nm was requested and the donor-hydrogen-acceptor angle bigger than 120 degree. The N-H· · ·N hydrogen bond of Watson-Crick base-pair, the two hydrogen bonds of wobble base-pair, and the N1-H1· · ·O2 and hydrogen bond of the loop region between residues C6 and G9 were taken as descriptors for the structure definition of the hairpin. An interaction between two stacked bases was defined when their center of mass separation was within 0.15 nm of that seen in the native experimental structure. The base-stacking involved base stacking interactions in the successive strand, the U5-C6 base stacking in the stem-loop junction, and the C6-C8 base stacking in the loop region, for a total number of 10 base stacking. A total number of seven hydrogen bond and ten base stacking interactions were used to define uCACGg hairpin.
The solvent accessible surface was computed numerically [45]. The atomic radii used were 0.16 nm for carbon, 0.13 nm for oxygen, 0.14 nm for nitrogen, 0.20 nm for phosphor and 0.10 nm for hydrogen. An atom was recognized as hydrophobic if the absolute value of its partial charge was less than 0.2 e. In addition, the dynamic behaviour of the hairpin was assessed by calculating the atomic fluctuations (RMSFs) of the backbone atoms after fitting on all atoms.
To give a one dimensional view of the distribution of the cations, we calculated the radial distribution functions (RDF) [46-47] between cations and cations-phosphorous. Finally, the spatial distribution function (SDF) [46,48-49] was calculated.
RESULT AND DISCUSSION
AMBER94, AMBER98, and AMBER99 versus Experimental Data
Table 1.Summary of MD simulations of the uCACGg hairpin performed in 60 ns
Force field Long-range interaction [Na+] (M) [Mg2+] (M)
AMBER94 PME 0.1
AMBER98 PME 0.1
AMBER99 PME 0.1
AMBER98 RF 0.1 0.5 1.0 0.1
AMBER98 PME 0.1 0.5 1.0 0.1
Table 2. Structural features of the uCACGg hairpin: comparison between the MD simulations using AMBER94, AMBER98, AMBER99 force fields and the NMR experimental structure
AMBER94 AMBER98 AMBER99
NOE [29] violation (%) 7.2 6.6 6.4
RMSD from ref [29] (nm) 0.22 0.21 0.24
RMSD from ref [30] (nm) 0.20 0.18 0.21
Fraction of selected hydrogen bonds PH 0.993 0.994 0.954
Fraction of selected base stacking PS 0.999 0.998 0.997
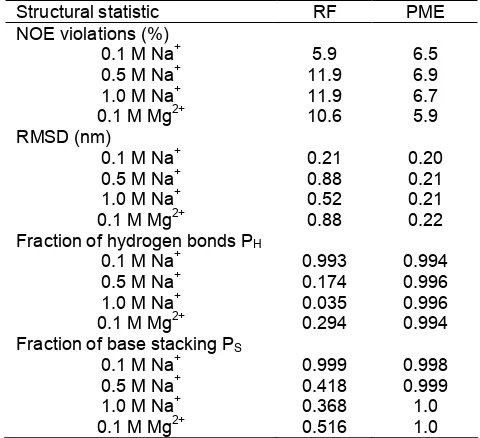
Table 3.Structural characteristic for the uCACGg hairpin of MD simulations using AMBER98 force field with different ion concentration of Na+and one concentration of Mg2+
Fraction of hydrogen bonds PH
0.1 M Na+ 0.993 0.994
0.5 M Na+ 0.174 0.996
1.0 M Na+ 0.035 0.996
0.1 M Mg2+ 0.294 0.994
Fraction of base stacking PS
0.1 M Na+ 0.999 0.998
0.5 M Na+ 0.418 0.999
1.0 M Na+ 0.368 1.0
0.1 M Mg2+ 0.516 1.0
the MD simulations and NMR spectroscopy [29]. It is to note that the experiments are carried out for 30-mer uCACGg hairpin at 283 K and the MD simulations were performed for 14-mer uCACGg hairpin at 300 K. The MD simulations using the three AMBER force fields are in overall agreement with the experimental structure [29]. In the three simulations, the intraresidual distances have the least violations respect to experimental data, the intrastrand distances between neighboring residues in the hairpin show the most violations. Moreover, the interstrand distances related to hydrogen bonds in the stem are in good agreement with the NOE distances, presenting marked stability for the hairpin of the stem region.
The average all-atom RMSDs of a trajectory from the NMR experimental structures [29-30] are calculated after fitting on the backbone atoms. The simulations deviate on average 0.2 nm from the NMR available experimental structures and similar RMSD values are obtained from the three version of the AMBER force field, showing a good agreement with experiment and not different relevant different among the force field’s versions. Calculating average RMSDs of individual regions fitted only on backbone atoms of the related regions give lower results. This indicates that the local structures are better maintained over course of the simulations than the global structure. Moreover, one can notice that even though the flexibility of the residue A7 looped out into the solvent and the NOE violations are more observed in the loop region, the RMSDs of the loop region, on the contrary, are lower than the RMSDs of the stem, except for the RMSDs relative to 1ROQ average structure. Another way to obtain more insight into the structural characteristic is calculating the fraction of the hydrogen bonds and the base stacking. The section Methods explains how to do these calculations. The results of the calculation reveal that these structural parameters are very similar for all of the three AMBER force field. Moreover, the hydrogen bonds between stem base-pairs are in full agreement with the experimental data, but this is not the case for the hydrogen bonds in the loop. On the one side, Oliver Ohlenschläger and co workers [29] have proposed four hydrogen bonds observed in the loop and on the other side, Zhihua Du and co workers [30] six hydrogen bonds. However, we found from our simulations two strong hydrogen bonds and two weak ones.
performed using three force fields and between the MD simulations and experiments. The NMR structures of the uCACGg hairpin were determined and deposited as 20 structures of 30-mer and 10 structures of 14-mer RNA hairpin in PDB code 1RFR [29] and 1ROQ [30] respectively. The two NMR structures have similarity in sugar pucker, and these sugar puckers are maintained in the simulations, except for the last residue C14. The sugars remain confine in one conformation, consisting of C2' -endo for residues A7 and C8, and C3' -endo for the rest of the residues. Similarly, the glycosidic torsional angle , are stable using the three AMBER force field, showing anti-conformation for all residues except for A7 und G9. The residue G9 adopts a syn-conformation, while a transition of two types syn conformations (72%: -50° and 27%: 24°) occurs by the residue A7. Negligible difference between three AMBER force fields are observed. The backbone conformations, which are related to torsional angle α, β, γ, ε and ζ angles are in good agreement with the NMR structure 1RFR apart from the α, β, or γ angles for residues A4, U5, A7, and G9 noticed for deviation from NMR structure 1RFR. The difference between the force fields is located around the U5. The some torsional angles (β and γ) of U5 show different values especially in the AMBER99 MD simulation with respect to the reference structure 1RFR as well, whereas in the structures 1ROQ the angles show a quite large standard deviation. The divergency observed for some α and γ angle values are in line with the necessity of a refinement of the AMBER in the description of α/γ conformers as discussed by Pérez and coworker [50].
Besides the above-mentioned structural calculation, the solvent accessible surface are also computed which provides similar results. The structural analysis yields no significant differences between the three AMBER force fields for MD simulation of uCACGg hairpin. The radius gyration of the overall NMR structure shows a (Rg) of 9.8 Å, in the other hand from the simulation, the average (Rg) was 10.1 Å representing a 3% increment due to expansion in the loop region. The solvent accessible surfaces per atom of residues U5 to G10 are calculated for the starting structure and for the average values over 60 ns simulation time.
Effect of Electrostatic Treatments on uCACGg Hairpin
To test the effect of the electrostatic treatments on uCACGg simulations were performed also using RF to treat long range electrostatic at different ion concentrations (Table 1). Table 3 compares the structural feature of the hairpin simulated using the two different long-range electrostatic treatments (PME and RF). Stable conformations of the hairpin are observed
mainly when PME method is used for long-range electrostatic. Only one of four simulations performed with reaction field shows the structural stability. That is the simulation with Na+ as counterions at the concentration of 0.1 M. It has been commonly accepted, that the role of the metal ions is to neutralize the polyanionic nucleic acids [23,51-52], and the increase of ion concentration [14] should not destabilize the uCACGg hairpin. This phenomenon cannot be accommodated by simulations using reaction field. The NOE violations of value more than 10% indicate that there is no more the original structure. Likewise, the RMSD of values more 0.5 nm show instability of the starting structure during the simulation. The instability of the structure is also reflected by the fraction of hydrogen bonds and base stacking, which decrease strongly. Especially for the fraction of hydrogen bonds in Table 3, it shows clearly that the simulations which can maintain the hairpin structure has value s1, otherwise the simulations are unstructured in few nanoseconds. The MD simulations using PME method exhibit reasonable structural stability at different ion concentrations and with multivalent counterion such as Mg2+.
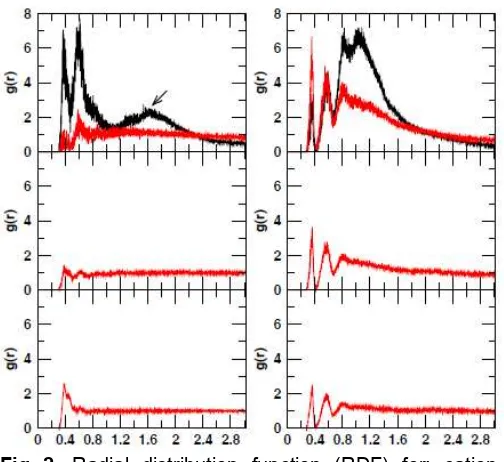
Furthermore, either cation-cation or phosphorus atom-cation interaction are investigated by calculating the radial distribution function (RDF), as shown in Fig. 2 as well. The previous MD studies on 1 M NaCl water solution showed that g(r)Na−Na and g(r)Cl−Cl from MD
simulation using reaction field method had a peak around the cutoff radius [44]. The ions tend to accumulate at the cutoff distance to minimize unfavorable interactions. Our results show similar artifact which is observed here in g(r)X−X, where X is
Na+ or Mg2+ (shown by arrows). That might indicate that the screening effect of water molecules also do not be improved when the reaction field correction are used. Concerning to Na+-Na+interactions at 0.1 M, the MD simulation using reaction field method shows that sodium ions tend to accumulate together implied by the first and second peaks RDF around 0.37 and 0.58 nm which are remarkable high. What typically happens is that two charges with the same sign repel each other and the positively charged sodium ions can approach each other due to the electrostatic screening by the negatively charged RNA hairpin. The accumulation of sodium ions may indicate that at the low concentration of sodium ions the RF underestimes the long-range electrostation interactions of sodium ions, so that the attractive interactions with the hairpin are strong enough to screen the repulsive interactions between sodium ions.
Fig 2. Radial distribution function (RDF) for: cation-cation (left), phosphor-cation-cation (right); from top to bottom: 0.14 M Na+, 0.50 M Na+, and 1.03 M Na+. The g(r) results using reaction field are shown by black curves and using PME red curves. Artifacts at cutoff radius are depicted by black arrows
Fig 3. RMSF of backbone atoms and O2P/C14 relative to their average positions after fitting to all atoms for uCACGg hairpin at different concentration of Na+ and Mg2+. The black, red, green and blue lines show 0.14 M Na+, 0.50 M Na+, 1.03 M Na+0.08 M Mg2+
peaks at 0.35 nm and 0.58 pronounce the certain position of sodium ions to the phosphorus atom and the neighboring phosphorus atoms, and the third peak at 0.83 nm may corresponds to the sodium ions that locate in the major groove. The extraordinary highest peaks of Mg-phosphorus interactions at the distance of ~0.3 nm from both methods are due to one ion Mg2+ that stay close to the O2P/C14 atom after 10 ps during the 60 ns simulations. The extraordinary highest peaks of Mg-phosphorus interactions at the distance of s0.3 nm from both methods are due to one ion Mg2+ that stay close to the O2P/C14 atom after 10 ps during the 60 ns simulations.
The different distributions patterns of g(r)Mg−Mgand
g(r)P−Clare observed. All of magnesium are coordinated
with six water molecules, excepting one of the magnesium ions that is excluded in the RDF calculation involves O2P (C14) in its coordination shell together with five water molecules over the simulation time in the simulations using RF and PME method. In the cation-cation interaction, the screening effect of the hairpin is indeed not observed due to water coordination shell, and at the simulation using RF methods, the cations are accumulated strongly at the cutoff distance. Moreover, three are also observed three peaks, and according to the trajectory we can see that the first peak at 0.46 nm corresponds to the position of magnesium ions between two phosphorus atom and the third peak at 0.96 nm is the distance of magnesium ions to the neighboring phosphorus atoms at the same position. The second peak at 0.77 nm may related to the position of magnesium ions in the major groove. We note that there is different behavior of cations among different ion concentrations and counterion types and we return to this point in the next section.
Comparison of Different Ion Concentrations and Counterion Types
In previous section, the two methods (reaction field and PME method) for electrostatic treatments were compared. Based on the results, the electrostatic interactions are treated more properly with PME method. Therefore, we continue to study the interactions of certain electronegative atoms of the hairpin with cation in this section using the PME method. By investigating the radial distribution (RDF), minimum distances, and spatial distribution function (SDF), we discuss behavior of cations around the hairpin in different ion concentrations and counterion types.
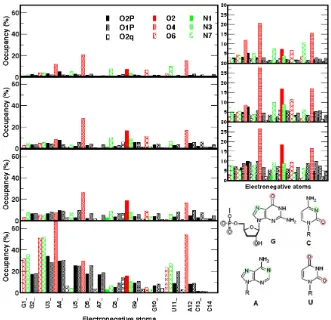
Fig 4. Averaged occupancy of 0.1 M Na+, 0.5 M Na+, and 1.0 M Na+, and 0.1 M Mg2+ (from top to bottom) around electronegative atoms of uCACGg hairpin. The symbols for the electronegative atoms are represented (top). To compare ion occupancy of Na+with different concentration, zooms of ion occupancies are provided in the right side. To highlight the certain electronegative atoms, these atoms are showed inside circles in the right bottom
as Na+ ion and the system does not become homogeneous in a long distance. The reason for this is possibly because our simulations is too short (60 ns) in comparison to lifetime of water oxygens around Mg2+ (about 2 fs). In the RNA-Mg interaction, one phosphate oxygen replaces one oxygen of water molecule in the hydration shell of a Mg2+ ion which causes the highest peak at distance of about 0.3 nm. The Mg2+ cations appear to congregate in certain region different from Na+ and they even do not reach homogeneous system in a long distance as well.
To get more detail information, occupancies of ions around electronegative atoms are determined by integration the first maximum of the corresponding RDF. Ion occupancies are calculated as ensemble averages of the populations within a certain distance. The calculation of occupancies focuses on the several electronegative atoms, which are included in specific interaction sites of bases in Fig. 4 and phosphate oxygens [56], except for the atoms whose RDF values smaller than 2% at all concentrations of metal ions. The calculation of the occupancy of magnesium ions do not include the one
coordinating with of O2P/C14. The results are summarized in Fig. 4.
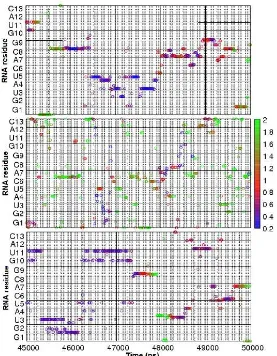
Fig 5.3D description of minimum distance of ions around RNA in 0.1 M Na+, 1.0 M Na+, and 0.1 M Mg2+(from top to bottom). The x-axis corresponds to 45-50 ns simulation time; the y-axis to all electronegative atoms of RNA residues; the color of circle to the minimum distance between an ion and an electronegative atoms. Only one atom is shown
the only sugar oxygen that exists on the major groove is O2'/C8 together with the base C8(O2, and N3). Interestingly, the 2’-hydroxyl group of C8 are supposed to be involved in hydrogen bond interaction with O2/C8 [30] observed as a weak interactions in our simulations. The occupancies in the minor groove are only observed for residues in the loop which are A7(N7), and G9(O6). While the atom N7/A7 is not involved in any hydrogen bond interaction, the hydrogen bond between O6/G9 and O2'/C6 and was identified from experiment [29-30] but is not observed in our simulations. The major groove occurs where the backbones are far apart, while the minor groove where they are close together.
The increase of sodium concentration enlarges mainly the occupancies of phosphate oxygens. Comparing to the atoms previous described with high occupancy of sodium ions, the ion occupancies around phosphate oxygens are relative low at 0.1 M Na+ concentration. However, these low occupancies become
more significant with increase of ion concentration. The concentration effect on electronegative site in the major and minor group on the other hand, proposes a noticeable effect only at increment of concentration from 0.1 M to 0.5 M. At the 1.0 M sodium concentration the, the sodium occupancies are relatively uniform at various electronegative sites. The O4/U5, O2/C8, and O4/U11 are still observed, however, as important sites for the hairpin-Na interaction.
Fig 6. Spatial distribution function (SDF) of Na+ (violet) and Mg2+(green) around averaged structure of uCACGg hairpin. To highlight the preferential presence of the ions, the backbone atoms have been displayed thicker than the rest atoms of the hairpin, and certain residues are signed. For the best display, the SDFs of ions are illustrated in top view (B and D) and side view (A, and C). The isosurfaces correspond to g(r,ω)=60)
for the several atom pairs, which are O6 and N7 of the base guanine, O2 and N3 of C8, and the phosphate oxygens O1P and O2P. The Mg-occupancies compared to Na-occupancies are clearly higher. Moreover, Fig. 4 exhibits the clear difference between Na+ and Mg2+ interaction with the uCACGg hairpin. In the major groove Mg2+ ions preferably interact with O4/U3, O4/U11, O6 and N7 of G2, G1 and G10, O4/U4. The O2 and N3 of C8 have lower but still substantial binding of Mg2+.
Additionally, the effect of ion concentration and counterion type on the flexibility of the uCACGg hairpin is reported in Fig. 3. The RMS fluctuation of the simulations provides information concerning atomic fluctuation of backbone atoms relative to their average positions after fitting on all atoms for uCACGg hairpin. The average fluctuations decrease to 7% (0.5 M Na+) and 10% (1.0 M Na+) with respect to the average fluctuation of Na+ concentration of 0.1 M. Average fluctuation with 0.1 M Mg2+, however, is 2% higher. The major difference of atomic fluctuation due to different concentration and counterion type is observed at residue
A4, U5, and C6. The residues in the loop region and U11-A12 show only a slight but noticeable difference in atomic fluctuation.
In Fig. 5, the minimum distances of ions around electronegative atoms of the hairpin were described in three dimensions. We extracted 5 ns from 60 ns simulations to visualize the behavior of one ion around the hairpin.
In order to get more accurate three dimensional view of the ion distribution around the hairpin, Fig. 6 displays the spatial distribution function (SDF) of cations around the uCACGg hairpin. We compare the SDF of 0.1 M Na+ and 0.1 M Mg2+. The value of isosurfaces reflects ion density of that value times that of the bulk. As we can see in the picture, the much higher ion density of Mg2+and different binding patterns between both ions. Interestingly, the affinity of the phosphate oxygens at the both sides appears different in the interaction with Mg2+ ions, where the occupancies of phosphate oxygens are remarkable higher at the sites of G1, G2, U3, A4, and U5 than of G10, U11, A12, C13, and C14. The pictures of ion binding of Na+ and Mg2+ give evidence of more localized occupancy of Mg2+ in major groove and around phosphate oxygens.
CONCLUSION
We applied classical MD simulations to investigate effect of ion treatment on uCACGg hairpin. Based on our result, the MD results using the AMBER94, AMBER98, and AMBER99 force fields agree well with the experimentally results. Generally speaking, the three AMBER force fields revealed quite similar results in NOE violations, RMSD, hydrogen bond network, base stacking, sugar pucker, glycosidic torsion, solvent accessible access and radius of gyration. In particular, their glycosidic torsional angle differ slightly at closing base pair U5-G10 and looped-out base A7.
Finally, after analyzing three different concentration of Na+ and one concentration of Mg2+ with 60 ns simulation time respectively, we could not find any significant change in the structure of the hairpin. However the atom fluctuations appear slightly different. From dynamical point of view of ion environment, Na+ ions are found mainly in the major groove at distance (about 0.25 nm) and in the low concentration they tend to stay longer. On the other hand, Mg2+ions stay longer than Na+ and are located not only in the major groove but also close to the phosphate groups of certain residues. Thus, MD simulations provide a theoretical opportunity to propose reasonable ion locations in the surroundings of the hairpin in the solution.
ACKNOWLEDGEMENT
The authors thank Harald Schwalbe and Jens Wöhnert for numerous inspiring and helpful discussions. This work has been supported by the Frankfurt Center for Scientific Computing, the Fonds der Chemischen Industrie, and the Deutsche Forschungsgemeinschaft (SFB 579 RNA-ligand interactions). E.C.W. thanks the DAAD for financial support.
REFERENCES
1. Al-Hashimi, H.M., 2005,ChemBioChem, 6, 9, 1506– 1519.
2. Scipioni, A., Anselmi, C., Zuccheri, G., Samori, B., and De Santis, P., 2002, Biophys. J., 83, 5, 2408– 2418.
3. Gavathiotis, E., Sharman, G.J., and Searle, M.S., 2000,Nucleic Acids Res., 28, 728–735.
4. Shajani, Z., and Varani, G., 2007,Biopolymers, 86, 5-6, 348–359.
5. Meints, G.A., and Drobny, G.P., 2001,Biochemistry, 40, 12436–12443.
6. Draper, D.E., Grilley, D., and Soto, A.M., 2005, Annu. Rev. Biophys. Biomol. Struct., 34, 221–243. 7. Cheatham III, T.E., 2004,Curr. Opin. Struct. Biol, 14,
3, 360–367.
8. Draper, D.E., 2004,RNA, 10, 3, 335–343.
9. Lyubartsev, A.P., 2004, Dekker Encyclopedia of Nanoscience and Nanotechnology, 2131–3143. 10. Korolev, N., Lyubartsev A.P., Laaksonen, A., and
Nordenskiöld, L., 2002, Biophys. J., 82, 6, 2860– 2875.
11. Serra, M.J. Baird, J.D., Dale, T., Fey, B.L. Retatagos, K., and Westhof, E., 2002, RNA, 8, 3, 307–323.
12. Misra, V.K., and Draper, D.E., 2000, J. Mol. Biol., 299, 3, 813–825.
13. Šponer, J.E., Burda, J.V., Leszczynki, J., and
Šponer, J., Interaction of metal cations with Nucleic
Acids and their building units, in Computational studies of RNA and DNA, J. Šponer, F. Lankaš, Eds., Computational studies of RNA and DNA, Dordrecht: Springer, 2006, 389–410.
14. Tan, Z.J., and Chen, S.J., 2006, Biophys. J., 90, 1175–1190.
15. Prabhu, N.V., Panda, M., Yang, Q., and Sharp, K.A., 2008,J. Comput. Chem., 29, 7, 1113–1130. 16. Brovchenko, I., Krukau, A., Oleinikova, A., and
Mazur, A.K., 2008, J. Am. Chem. Soc., 130, 1, 121–131.
17. Rueda, M., Cubero, E., Laughton, C.A., and Orozco, M., 2004,Biophys. J., 87, 2, 800–811. 18. Ponomarev, S.Y., Thayer, K.M., and Beveridge,
D.L., 2004,Proc. Natl. Acad. Sci. U.S.A., 101, 41, 14771–14775.
19. Auffinger, P., Bielecki, L., and Westhof, E., 2003, Chem. Biol., 10, 551–561.
20. Réblová, K., Spacková, N., Šponer, J.E., Koca, J., and Šponer, J., 2003, Nucleic Acids Res., 31, 23, 6942–6952.
21. Auffinger, P., and Westhof, E.J., 2000,J. Mol. Biol., 300, 1113–1131.
22. Bonvin, A.M.J.J., 2000, Eur. Biophys. J., 29, 57– 60.
23. Feig, M., and Pettitt, B.M., 1999,Biophys. J., 77, 4, 1769–1781.
24. Rueda, M., Kalko, G.S., Luque, F.J., and Orozco, M., 2003,J. Am. Chem. Soc., 125, 26, 8007–8014. 25. Rieder, E., Xiang, W., Paul, A., and Wimmer, E.J.,
2003,J. Gen. Virol., 84, 2203–2216.
26. Zell, R., Sidigi, K., Stelzner, A., and Görlach, M., 2002,RNA, 8, 2, 188–201.
27. Andino, R., Rieckhof, G.E., and Baltimore, D., 1990,Cell, 63, 2, 369–380.
28. Villa, A., Widjajakusuma, E., and Stock, G., 2008, J. Phys. Chem. B, 112, 1, 134–142.
29. Ohlenschläger, O., Wöhnert, J., Bucci, E., Seitz, S., Häfner, S., Ramachandran, R., Zell, R., and Görlach, M., 2004,Structure, 12, 2, 237–248. 30. Du, Z., Yu, J., Andino, R., and James, T.L., 2003,
Biochemistry, 42, 15, 4373–4383.
31. Proctor, D.J., Schaak, J.E., Bevilacqua, J.M., Falzone, C.J., and Bevilacqua, P.C., 2003, Biochemistry, 41, 40, 12062–12075.
32. Ferner, J., Villa, A., Duchardt, E., Widjajakusuma, E., Wöhnert, J., Stock, G., and Schwalbe. H., 2008, Nucleic Acids Res., 36, 1928-1940.
33. Villa, A., and Stock, G., 2006, J. Chem. Theory Comput., 2, 5, 1128–1236.
35. Cheatham, T., Cieplak, P., and Kollman, P.J., 1999, Biomol. Struct. Dyn., 16, 4, 845–861.
36. Wang, J., Cieplak, P., and Kollman, P.A., 2000, J. Comput. Chem., 21, 12, 1049–1074.
37. Berendsen, H.J.C., van der Spoel, D., and van Drunen, R., 1995,Comput. Phys. Commun., 91, 43– 56.
38. Lindahl, E., Hess, B., and van der Spoel, D., 2001,J. Mol. Model., 7, 306–317.
39. Jorgensen, W.L., Chandrasekhar, J., Madura, J.D., Impey, R.W., and Klein, M.L., 1983,J. Chem. Phys., 79, 2, 926–935.
40. Darden, T., York, D., and Pedersen, L., 1993, J. Chem. Phys., 98, 12, 10089–10092.
41. Berendsen, H.J.C., Postma, J.P.M., van Gunsteren, W.F., DiNola, A., and Haak, J. R., 1984, J. Chem. Phys., 81, 8, 3684–3690.
42. Miyamoto, S., and Kollman, P.A., 1992,J. Comput. Chem., 13, 8, 952–962.
43. Hess, B., Bekker, H., Berendsen, H.J.C., and Fraaije, J.G.E.M., 1997, J. Comput. Chem., 18, 12, 1463–1472.
44. Tironi, I.G., Sperb, R., Smith, P.E., and van Gunsteren, W.F., 1995,J. Chem. Phys., 102, 5451– 5459.
45. Eisenhaber, F., Lijnzaad, P., Argos, P., Sander, C., and Scharf, M., 1995, J. Comput. Chem., 16, 3, 273–284.
46. Allen, M.P., and Tildesley, D.J., 1987, Computer Simulations of Liquids, Oxford, New York, USA: Oxford University Press.
47. McQuarrie, D.A. 1976, Statistical Mechanics, New York: Harper and Row.
48. Kulińska, K., Kuliński, T., Lyubartsev, A., Laaksonen, A., and Adamiak, R.W., 2000,Comput. Chem., 24, 3-4, 451–457.
49. Haile, J.M., and Gray, C.G., 1980, Chem. Phys. Lett., 76, 3, 583–588.
50. Peréz, A., Marchán, I., Svozil, D., Sponer, J., Cheatham III, T.E., Laughton, C.A., and Orozco, M., 2007,Biophys. J., 92, 11, 3817–3829.
51. Korolev, N., Lyubartsev, A.P., Laaksonen, A., and Nordenskiöld, L., 2003,Nucleic Acids Res., 31, 20, 5971–5981.
52. Martínez, J.M., Elmroth, S.K.C., and Klo, L., 2001, J. Am. Chem. Soc., 123, 49, 12279–12289.
53. Periole, X., Allouche, D., Daudey, J.P., and Sanejouand, Y.H., 1997, J. Phys. Chem. B, 101, 5018–5025.
54. Ohtaki, H., and Radnai, T., 1993,Chem. Rev., 93, 3, 1157–1204.
55. York, D.M., Darden, T., Deerfield II, D., and Pedersen, L.G., 1992,Int. J. Quantum Chem., 44, supplement 19, 145–166.
56. Sigel, R.K., and Pyle, A.M., 2007, Chem. Rev., 107, 1, 97–113.