Indonesian :
NIDN
Ir. I Made Anom Sutrisna Wijaya, M.pp.Sc., Ph.D
0013116309
Ir. Linawati, M.Eng.Sc., Ph.D.
0024086607
I Putu Gede Budisanjaya, S.TP., MT.
0030057906
Overseas (Japan):
Prof. Dr. Sakae Shibusawa
!"#$
Code
: 164
iii
ENDORSEMENT PAGE ii
TABLE OF CONTENT iii
ABSTRACT iv
CHAPTER I. INTRODUCTION 1
1.1.Background 1
1.2.Objectives 2
1.3.Research Urgency 2
CHAPTER II. LITERATURE REVIEW 4
CHAPTER III. MATERIALS AND METHODS 8
3.1.Site and samplings 8
3.2.Spatio>temporal variability analyses, and EC>based management zone map
development 8
CHAPTER IV. RESEARCH RESULTS 9
4.1. Modified EC Sensor 9
4.2. Correlation between soil EC, SOM, and total N 9
4.3. Spatio>Temporal EC Variability 15
4.4. Spatial Trend Soil EC Map 16
4.5. Temporal Stability EC Map 16
4.6. Management Zone Map 17
CHAPTER V. CONCLUSION 18
iv
Soil Electrical Conductivity (EC) is a measurement that correlates to soil properties affecting crop productivity. It is expected by the end of this research, an appropriate technology to measure soil EC which enable to modify land management in a site>specific manner based on information technology will be developed. The aims the second year’s research was to determine the best approach to measure soil EC. Capacitive and spectroscopy approach will be compared. Besides, correlation between soil EC and selected soil properties to describe the cause of variability of soil EC will be also determined. The soil sensor has been developed and modified using capacitive method. The soil data were collected at spacing interval 5 m x 5 m from field, and conducted after harvesting before the next planting time, during the research period. The coordinate where the soil data are collected were recorded using GPS to obtain spatial variability map. All spatial data will be analyzed (Spatio>temporal analysis and management zone map development) using the commercial GIS software package. In this research, soil data have been collected and analysed three times, and correlation analysis between soil EC and some soil fertility variables have been performed. The results indicated that soil EC has higher correlation with soil organic matter than total N. Next, further correlation analysis will be performed using wider soil EC value, and spatial analysis of collected data at each experimental field will be conducted.. Also, spatial analysis and another data collection that will be used for generating temporal stability map will be carried out.
1
%
#%#% &' ()*
Conventionally, agricultural inputs such as seed, irrigation, fertilizer and pesticide have
been applied evenly over a given field. However, the EC at the end of growing season can
vary. Changes in soil properties such as soil water content, organic matter, and salinity and
soil texture are all factors that can cause changes in EC. Therefore, it is more economical to
apply different amounts of agriculture inputs to sections of a field that have different soils.
Currently, GIS systems have capacity to analyze large amounts of spatial grid data;
however collecting, analyzing and interpreting soil data can be expensive, time consuming
and labor intensive. One way to decrease costs related to acquiring soil data is to develop
techniques for rapidly measuring soil properties across a field. The most informative, simple,
least expensive and accurate map of soil variability across the field is made using
measurements of soil electrical conductivity (EC).
Soil EC is a property of soil that is determined by standardized measures of soil
conductance by the distance and cross sectional area through which a current travels.
Traditionally, soil paste EC has been used to assess soil salinity (Rhoades et al., 1989), but
now commercial sensors are available that allow rapid field mapping of bulk soil EC;
however there has been little published research this area.
The movement of electrons through bulk soil is complex. Electrons may travel through
soil water in macro pores, along the surface of soil minerals and through alternating layers of
particles and solution (Rhoades et al., 1989). Therefore soil EC correlates with soil properties
that affect crop productivity including soil organic matter, soil texture, soil moisture content
and salinity. If soil EC maps have utility in production agriculture, 1) soil EC must be
spatially structured, 2) spatial patterns must have temporal stability and 3) soil EC must be
related to factors of agronomic importance. In application of a new agricultural system, called
Pecision Agriculture, which is offer the promise of increasing productivity while decreasing
production costs and minimizing the environmental impacts (Blacmore, 1994, National
Research Council, 1997; Shibusawa, 1999a; Earl, 1997), the knowledge and the
understanding about the variability of soil parameters within the field become very important.
Therefore, the availability of appropriate technology to measure the soil parameters
variability within a field is necessary. In this research, development of capacitance>based soil
EC sensor which is enable describing the spatio>temporal variability of soil electric
2
#%!% +, -./
This main objective of this research is to produce an appropriate technology to measure
soil EC which enable to modify land management in a site>specific manner based on
information technology.
The objective of the third year is to analyze the spatio>temporal variability of soil EC,
and to develop the EC>based management zone map which can be used as guidance in
application of variable>rate fertilizer. Spatio>temporal analysis and the development of
management zone map will be carried out using the data that collected from the first year
until the third year.
#% % ' * 0
This research will be a collaborative between Laboratory of Environmental Science and
Agriculture System Engineering (EASY), Tokyo University of Agriculture & Technology,
Tokyo, Japan (Prof. Sakae Shibusawa) and Laboratory of Natural Resources Management
(NRM), Faculty of Agricultural Technology, Udayana University (I Made Anom S Wijaya,
Ph.D., Ni Nyoman Sulastri, M.Agr., Dr. Sumiyati, and I Wayan Tika, MP.). Prof. Shibusawa
will help Udayana University team to develope soil EC sensor, to conduct field trial, and
analysing the collected data. He also will provide on>the>go real time soil sensor which will
used for collectng data using the spetroscopy approach. I Made Anom will responsible for
overall project and has experience in conducting field trial using on>the>go real time soil
sensor and analysing the data using ArcView, the commercial GIS software package.
Linawati and I Putu Gede Budisanjaya will assist to conduct field trial, laboratory analysis,
and data analysis using ArcView.
This is the first collaborative research between NRM and EASY. If this research is
successfull, there is a chance in the future to apply for collaborative funding through JSPS,
Monkabusho, or industry, to develop other soil sensor. By establishing a partnership with
Tokyo University of Agriculture & Technology will further open the opportunity for mutual
benefit sharing, with possibilities of expanding partnership to other project and education
purpose.
The knowledge and the understanding about the variability of soil EC within the field
become very important, since soil EC correlates with soil organic matter, soil texture, soil
3
used as a basic data for precision soil sampling, erosion mapping, fertilization management,
irrigation, and nematode management (Ortiz, 2009):
It is hoped, the results of this project will benefited farmers on how to observe and
measure the variability of their field, and how to use the variability information for managing
the field efectively and efficiently. This will resulted into an optimal EC, and
enfirontmentally safe.
Research result will also be prepared for publication in both international seminar and
journal. With collaborative partner from Tokyo University of Agriculture & Technology,
there will be a greater chance to be able to publish paper in International Journal such as
4
%
Soil is an electrical conductor. The soil EC is a measure of how easily an electric
current flows through the soil. Soil EC responds to the amount of salt in the soil as well as
indicates the soil’s composition>the amount of sand, clay, organic matter and water content
(Farahani et al, 2007).
The conduction of electricity in soil takes place through the moisture>filled pores that
occur between individual soil particles. Therefore, the soil EC is determined by the following
soil properties (Doerge, 1999):
1. Porosity, the greater soil porosity, the more easily electricity is conducted. Soil with high
clay content has higher porosity than sandier soil. Compaction normally increases soil
EC.
2. Water content, dry soil is much lower in conductivity than moist soil.
3. Salinity level, increasing concentration of electrolytes (salts) in soil water will
dramatically increase soil EC.
4. Cation exchange capacity (CEC), mineral soil containing high levels of organic matter
(humus) have higher ability to retain positively charged ions than soil lacking the organic
matter.
5. Temperature, as temperature decrease toward the freezing point of water, soil EC
decreases slightly. Below freezing, soil pores become increasingly insulated from each
other and overall soil EC declines rapidly.
Research has shown that spatial variability maps of soil EC combined with terrain
attributes can be used to delineate management zone (MZ) which can be basic data for (Ortiz,
2009):
1. Precision soil sampling. MZ can be used as a guide to identify areas within a field where
soil samples can be grouped, therefore reducing the number of samples required to
represent the within>field variability (directed soil sampling).
2. Erosion mapping. Soil EC spatial variability maps often be used to separate more highly
eroded from uneroded areas. Usually, higher soil EC readings are typically found where
clayier subsoils are exposed at the surface.
3. Fertilization management. The discrimination of zones with differences in soil properties
5
4. Irrigation. MZ different soil texture/water content can signify variations in soil water
holding capacity which can be used to generate variable>rate irrigation maps.
5. Nematode management. Southern Root Knot Nematodes (RKN) prefer sandy areas
which can be identified on a soil EC spatial variability map, particularly in some coastal
plain soils. Therefore soil EC MZ may suggest different risk levels for high populations
of RKN leading to variable>rate application of nematicides.
6. Improvement of USDA>NRCS soil surveys. Available soil surveys in most cases do not
provide the level of detail required for a site>specific management. However, these
digital maps can be used in combination with soil EC and elevation maps to improve the
resolution of soil variability.
Recent development in soil EC sensors and their ability to produce soil EC variation
maps has attracted much attention among producers about potential applications on this
sensor for improving field management (Ehsani, 2002). Several commercial application have
been developed and marketed that utilize one of several soil EC sensor methods for on>the>go
measurements of soil EC. Veris technologies has developed a commercial mobile system for
measuring soil EC using the principles of electrical resistivity (ER)>contact sensor and
electrical magnetic induction (EM)>non contact sensor.
In contact sensor method, two to three pairs of coulters are mounted on a toolbar; one
pair applies electrical current into the soil while the other two pair of coulters measure the
voltage drop between them (Figure 1). Soil EC information is recorded in a data logger along
with location information. A Global Positioning System (GPS) provides the location
information to the data logger. The contact method is more popular for precision agriculture
applications, because with this method it is easier to cover more area and it is less susceptible
to outside interference. The disadvantage of this system is that it is usually bulky and cannot
be used in some small farms and plots. Currently, Veris Technology manufactures the contact
type of soil EC measuring device. There are two types of Veris units commercially available:
the 300XA and the 200XA. The 300XA provides EC readings from two different depths (1
foot and 3 feet). The 200XA provides EC measurements at only one depth. However, the
depth is adjustable and is normally set at 3 feet. The 200XA is smaller in size and easier to
maneuver on smaller farms. The Veris unit can be pulled behind a truck through the field at
speeds of up to 10 mph and covers swaths 20 to 60 feet wide, depending on the needed
6
For non>contact method, soil EC sensor works on the principle of electromagnetic
induction (EM). EM does not contact the soil surface directly. The instrument is composed of
a transmitter and a receiver coil usually installed at opposite ends of a non>conductive bar
located at opposite ends of the instrument. EM38 (Geonics Limited) and GEM>2 (Geophex)
are two popular models of non>contact sensors that are available on the market. GEM>2 is a
digital and multi>frequency sensor that can operate in a frequency range of 300 Hz to 24
KHz. The GEM>2 is capable of measuring soil EC at different depths. EM>38 works only
with a fixed frequency and has an effective measurement depth of 1.5 m (5 ft.) in horizontal
dipole mode or 0.75 m (2.5 ft.) in vertical dipole mode.
Figure 1. Principle of operation for contact type EC sensor (Source: http://www.veristech.com)
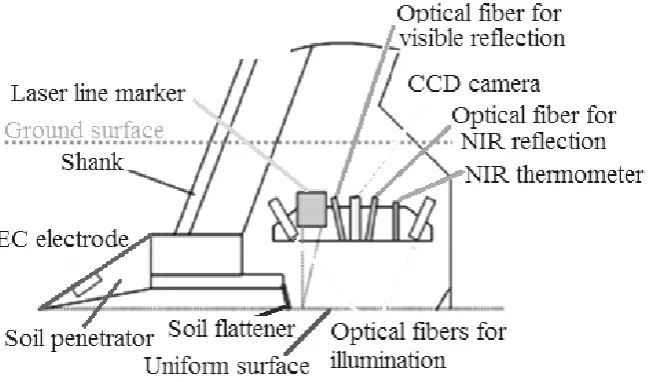
A real>time soil sensor (R
sor (RTSS) with a GPS has been developed to co
hich maps of several soil parameters including
hibusawa et al., 2000, 2001).
hani (2002), Fritz et al., (1999) and Sudduth et al.
while mapping agricultural fields. They reported si
ion between collocated points.
ods for measuring soil EC will be used in this s
to use the spectroscopic and capacitance sensor i
In addition, this research will be the first research
ith some soil properties influencing crop productivi sing of real>time soil sensor (RTSS) (Shibusawa et
8
planting. In addition, this farm is traditionally managed by local farmer using subak irrigation
system. The soil data were collected at spacing interval 5 m x 5 m, and carried out after
harvesting, before the next planting time. The coordinate of each point where the soil data are
collected were recorded using GPS to obtain spatial variability map. The research
%!% 1 -.( - 1( 2 / . +.2.-0 * 20 3 * + * ' *- 4(* 1
/ 2(1
*-Spatio>temporal variability will be analyzed using the calibrated data that collected
from year 1 until year 3. The management zone map also developed using those data. Both
the variability analysis and management zone map will be analyzed using ArcView software.
Firstly, the collected data should be selected to get data that have the same number and
the same coordinate from one experiment to another experiment. Then the data are
normalized by dividing the soil EC data with their respective average, and multiplied by 100
%. Based on the normalized data then the normalized soil EC maps are created to see how the
soil EC behaves from time to time. Next, the average and standard deviation of the
normalized data series are calculated. These calculations are performed in time direction.
Finally, the coefficient of variation (CV) are calculated by dividing the standard deviation
with their average value and multiplied by 100 %. The averages of normalized data are used
for generating the spatial trend maps, and the CV data are used for developing the temporal
stability maps. Finally, from the spatial trend and the temporal stability information, and by
defining the cutting point of variation and management unit levels, the management zone
maps could be developed. This analyses will be conducted in year 3, both in Japan and
9
%
5%#% ( .6. * (
Some modification have been carried out in EC sensor, especially on the sensor probe
configuration and materials. The modifed soil EC sensor was presented in Figure 1.
Modification have been made as shown from Figure 1a into Figure 1b.
(a) (b)
Figure 1. Modified soil EC sensor
5%!% ( 2 -.(* + -7 * (.2 3 3 * -(- 2
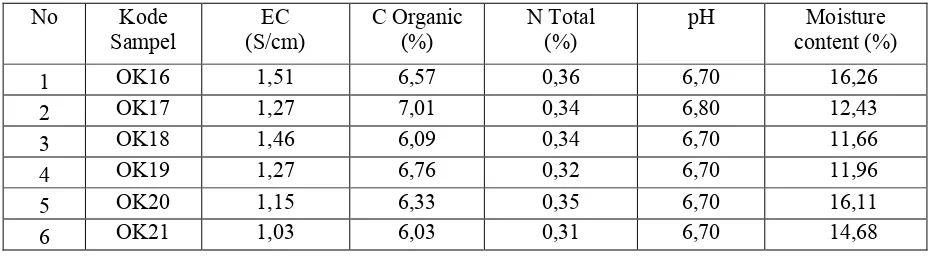
Soil sample have been collected twice from the research field, eg.October 2013 and
July 2014. The soil sample were analysed in the laboratorium. The analysis results are
tabulated in Table 1 and Table 2. Based on those data then the correlation between soil EC,
SOM and total N was carried out. It can be seen from Table 1 and 2 that soil EC, SOM, total
N and pH varried according the field.
Table 1. Soil EC, C Organic, N Total and Moisture content collected on October 2013
11
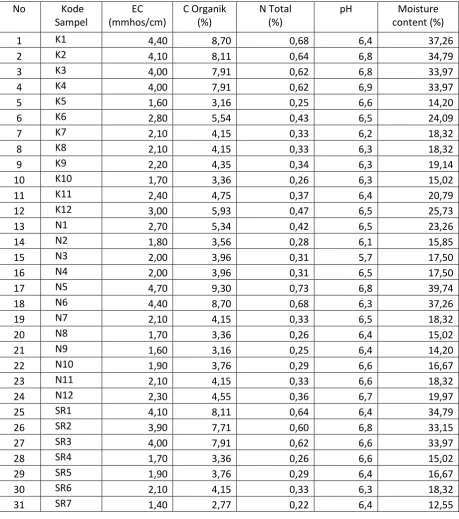
Table 2. Soil EC, C Organic, N Total and Moisture content collected on July 2014
13
Table 3. Soil EC, C Organic, N Total and Moisture content collected on Feb 2015
14
From correlation analysis using selected soil data it was found the correlation between
15
compared with other soil properties. Coefficient determination of correlation between soil EC
and pH was 0,923, while coefficient correlation between soil EC and moisture, SOM, and
Total N was 0,881; 0,839; and 0,702 respectively.
Table 4. Correlation equation between soil EC, SOM, total N, pH and moisture content
No Correlation Equation R2
1 EC vs. SOM Y = 1,978 X 0,839
2 EC vs. Total N Y= 0,155 X 0,702
3 EC vs. pH Y = 0,376 X + 6,021 0,923
4 EC vs. Moisture Y = 8,237 X +1,022 0,881
5% % 1 -.( 1( 2 . +.2.-0
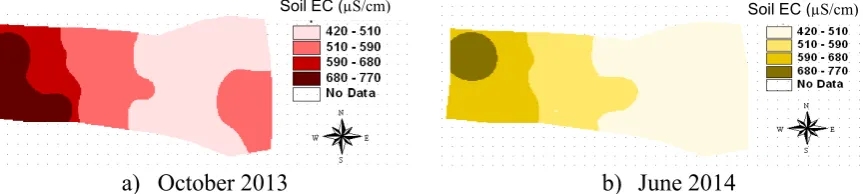
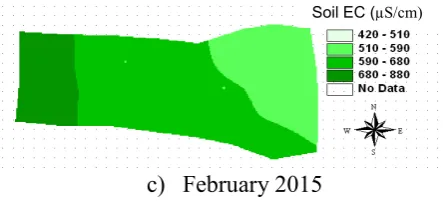
The results of spatial analyses of soil EC data collected on October 2013, June 2014, and
February 2015, and analyzed using ArchView software was presented spatial variability map
on Figure 1. It can be seen that the soil EC was varied spatially along the field. Similar
variability pattern was seen in all variability map. The higher soil EC was always seen in the
western part of the field, while the lower EC seen in the eastern part of the field, except at
south east corner of October 2013 map. The EC of this part was ranged from 510 to 590
µS/cm. On February 2015, however, the EC was higher than October 2013 and June 2014.
The soil EC on February 2015 ranged from 420>880 µS/cm, while the previous EC range
from 420>770 µS/cm. This is might be caused by the forage that planted before paddy was
planted, since the planting pattern in the experimental site is paddy>paddy>forage. When the
forage was planted the fertility of the field increased which is affected on the soil EC that
planted after forage.
a) October 2013 b) June 2014
16
c) February 2015
Figure 1. Spatio>temporal variability of soil EC : a) October 2013, b) June 2014, and c) February 2015
5%5% 1 -. 2 * (.2 1
Spatial trend map that developed using the average normalized EC data was presented in
Figure 2. This map indicated the trend of EC variability within the field. It can be seen that
the western part of field tent has highest EC, which is then followed by the lower EC when
move to the eastern part of the field. Figure 2 also showed that half of the field (eastern part)
always has the lowest EC, while the western part of the field has higher EC.
Figure 2. Spatial Trend EC Map
5%$% 1( 2 - +.2.-0 1
The temporal stability map was developed using the coefficient variation (CV) of
normalized EC data. CV was calculated by dividing the standard deviation with their average
value and multiplied by 100 %. The temporal stability map of the EC collected on February
2011, June 2011, and February 2012 was illustrated on Figure 3. CV of the EC was seen
varied within the field. Most field, however, has CV less than 10%. Only view area has CV
higher than 10%.
µS/cm)
17
Figure 3. Temporal Stability EC Map
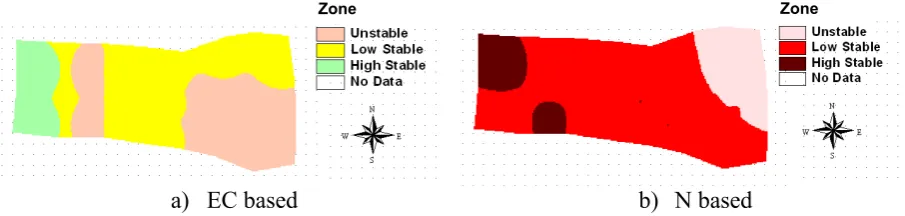
5%8% * ' *- 9(* 1
In this experiment, management zone map as illustrated in Figure 4 was constructed using
combination of spatial trend and temporal stability data. Spatial trend map was divided into
two region: low and high EC, while temporal stability which is represented by CV was also
divided into two classes: stable and unstable. The stable area was developed using CV less
than 10%, and unstable area using CV more than or equal to 10%. From those region and
classes, then three region was developed on management zone map. The zone region was
unstable, high stable, and low stable area. The EC>based management zone map of this
experiment was illustrated in Figure 4a. As indicated in Figure 4a, most of the field had low
stable EC, only view has high stable EC (western part). Unstable area was seen at south east
and some of western part of the field.
If compared with N>based management zone map, EC>based management zone seem has
strong correlation with N>based management zone map (Figure 4b). Most of the field has low
stable N availability. High stable N availability only occured at North West part of the field,
and unstable area was seen at North East part of the field.
a) EC based b) N based
Figure 4. Management Zone Map
18
%
It can be concluded that soil EC has high correlation with pH, moisture SOM and total N.
The variability of EC, pH, SOM and total N has been confirmed in small scale paddy field.
EC>based zone map with three regions have been also developed. Those EC maps can be
19
Bulchleiter and Fahrani. 2002. Comparison of electrical conductivity measurements from two
different sensing technologies. Paper No. 02>506, ASAE. Michigan.
Doerge, Tom. Fitting Soil Electrical Conductivity Measurements into the Precision Farming
Toolbox. 2001. Presented at the 2001 Wisconsin Fertilizer, Aglime and Pest
Management Conference. Madison.
Ehsani, R. and Sullivan, M. Soil electrical conductivity (EC) Sensors. The Ohio State
University extension. AEX>565>02. http://ohioline.osu.edu/aex>fact/pdf/0565.pdf
(Accessed December 2nd, 2009).
Faharani, H.J., Khosla, R., Buchleiter, G.W. 2007. Field EC Mapping: A New Tool to Make
Better Decisions. Colorado State University Extension.
Ortiz, B.V. 2009. Soil electrical conductivity mapping: a tool for within>field soil variability
assessment. Alabama cooperative extension system. AGS>PA>09>03.
Rhoades, J.D., Manteghi, Shouse and Alves. 1989. Soil Electrical Conductivity and Soil
Salinity: New Formulations and Calibrations.Soil Sci.Soc.Am.J. 53:433>439.
Shibusawa, S., et al. 2000. A revised soil spectrophotometer. Proceedings of the 2nd
IFAC/CIGR International Workshop on bio>robotics II, S. Shibusawa, M.Monta, H.
Murase, November 25>26 Osaka, Japan.
Shibusawa, S., et al. 2001. Soil mapping using the real>time soil spectrophotometer.
Proceeding of the third European Conference Agriculture. Montpellier, France, June
18>20, 2001.
Veris Technologies, 2001. Frequently asked questions about soil electrical conductivity
(Online). http://www.veristech.com (Accessed January, 8th 2010). Veris Technologies,